1243 Blue Spruce Ln · Wilmington, OH
Flood risk 1/10 · Minimal
- FEMA flood zone
- X (unshaded)
- Chance of flooding over 30 yrs
- 0.0%
- Est. flood insurance / yr
- $507 – $1,088
Fire risk 1/10 · Minimal
- Est. fire insurance / yr
- $713 – $1,323
Heat risk 3/10 · Minor
- Hot days now (above 100°F)
- 7 days/yr
- Hot days in 30 yrs
- 19 days/yr
Wind risk 2/10 · Minimal
- Chance of severe wind over 30 yrs
- 1.0%
Air-quality risk 2/10 · Minimal
- Unhealthy air days now
- 1 days/yr
- Unhealthy air days in 30 yrs
- 2 days/yr
Risk factors via First Street. Map © Google.
Why this score? — see what drove the C grade
The composite is a weighted blend of 9 inputs, each scored 0–100. Each bar is that input's sub-score; the figure is the points it added to the 100-point composite (weight × sub-score).
- Cash flow +25.6/30.0
- DSCR +8.5/10.0
- 1% rule +6.9/10.0
- ARV discount +4.5/15.0
- Schools +3.9/10.0
- Livability +3.9/5.0
- Rent growth +2.5/5.0
- Condition / age +1.0/5.0
- Appreciation +0.0/10.0
$348,000
🖨 Deal sheet (PDF) 📄 Offer letter ✓ Due diligence
Listing remarks MLS
The Mayfair II Design by Cristo Homes! This beautiful 3 bed, 2 bath ranch boasts ~1802 sqft of living space! Eat-in kitchen with granite countertops + pantry offers a full view to the Great Rm & Dining Area. Split bedroom layout. Primary suite w adjoining bath ft. double vanity and walk-in closet. Convenient first floor laundry! Mudroom. 2-car oversized garage.
Key facts
- Pantry
- Adjoining bath
- Primary suite
Tags
Neighborhood map
What this means for you Summary
Snapshot
- This is a 3-bed/2.0-bath single-family listed at $348k. Condition is rated poor.
Deal economics
- At list price, monthly cash flow is $826 ($10k/yr) — positive.
- The deal already cash-flows at list — no discount required.
- Meets the 1% rule at list price ($4k rent vs $348k).
- Recommended offer: $306k (12.0% below list) — sets the bar for market timing.
- Cap rate 9.1% vs local median 6.0% in Wilmington — top-decile yield for the area; either an underpriced asset or a hidden risk that comps aren't pricing in. Stress-test before assuming the spread holds.
Location & tenants
- Location reads 77/100 on livability (#202 in OH, #3,127 nationally) — a middle-class / working-renter tenant base. Strengths: cost of living A+, housing A+, health & safety A+; Watch: amenities D, commute F, employment F.
- Wilmington City (town): math 42% / reading 51% proficiency, ranked #492 of 656 in OH (top 75%) — families likely to look elsewhere, expect single-tenant / working-renter base with shorter leases.
- Zoned schools: Roy E Holmes Elementary School (508 students, 58% FRL); Rodger O. Borror Middle School (math 35% / reading 44%, grade F, #519 of 654 statewide, top 80%, 502 students, 48% FRL); Wilmington High School (math 24% / reading 62%, grade F, #494 of 781 statewide, top 63%, 663 students, 46% FRL) — zoned schools at 51% FRL track the district average.
- Market conditions: 108 active listings in the ZIP; 3 comparable units currently listed for rent nearby; rentals leasing fast (median 5d on market — plan ~1-2 weeks tenant-placement turnaround); 119 units permitted in Clinton County in 2024 (0 in 5+ unit buildings).
- At $4,125/mo this rent would consume 70% of the median local household income ($70k/yr) — very limited rent-growth headroom before tenants either downsize or default.
Forward outlook
- Local home prices are declining (-3.0%/yr); year-one equity from $2k of loan paydown is wiped out by about $10k of value loss. Plan a longer hold.
- Clinton County population projected at -12% by 2050 — secular population decline; favor cash flow + early exit over multi-decade hold.
Negotiation context
- It's been on market 213 days — a 12% lower offer ($306k) is reasonable based on typical stale-listing flexibility.
- 3 sale attempts; this cycle's ask has dropped $21k (6%) from the opening price — seller is motivated, your offer sets the floor, not the list.
Questions for the listing agent
- It's been on market 213 days. Have you received any prior offers? Is the seller open to a 12% concession, seller financing, or rate buy-down credit?
- Have any recent inspections been done? Can we get a copy of the seller's disclosures and any deferred-maintenance estimates?
- What does the HOA fee cover, when was the last increase, and are there any pending special assessments or reserve-fund shortfalls?
- Why hasn't it sold? Are there any deal-killer items the seller is aware of (foundation, flood, title, zoning, code violations)?
- Is there a deadline driving the sale (1031 exchange, divorce, estate, relocation)? That informs how much negotiation room exists.
- What's the average days-on-market for RENTAL listings here right now (not sales)? A rising rental-DOM trend means longer vacancies and softer asking-rent achievability than the comps imply.
- What's the recent tenant-quality profile in this submarket — average credit score on applications, eviction rate, late-payment / NSF rate, and stable-employment percentage? A property-management company in the area should have these aggregated.
- How much new for-sale + rental construction is in the pipeline within 1–3 miles? Heavy new supply typically softens prices + rents 12–24 months out; constrained supply supports both.
Investment metrics
- 1% rule
- 1.19% ✓
- Cap rate
- 9.14%
- Cash-on-cash
- 10.17%
- DSCR
- 1.45
- GRM
- 7.0
CMA / ARV
- ARV (median comp)
- $326,451
- List price
- $348,000
- Delta
- 6.60%
- Verdict
- FAIR
- Comps
- 20 within 1.0 mi
Show comp detail 6 sales within ~0.75 mi
| Address | Dist | Beds/Ba | Sqft | Sold | Price | $/sf | Match |
|---|---|---|---|---|---|---|---|
| 1300 Blue Spruce Ln | 0.00mi | 4/3.0 (+1) | 1,797 (-0%) | 14mo | $426,244 | $237 | 79 |
| 432 Red Maple Ln | 0.15mi | 4/3.0 (+1) | 1,802 (0%) | 12mo | $449,940 | $250 | 74 |
| 21 Garden Cir | 0.63mi | 3/2.0 | 1,853 (+3%) | 11mo | $314,900 | $170 | 56 |
| 1985 St Rt 730 | 0.70mi | 3/3.0 | 1,860 (+3%) | 4mo | $305,000 | $164 | 55 |
| 1282 Ridge Rd | 0.60mi | 4/2.5 (+1) | 1,896 (+5%) | 18mo | $250,000 | $132 | 41 |
| 97 Glenwood Cir | 0.63mi | 3/1.5 | 1,596 (-11%) | 22mo | $250,000 | $157 | 31 |
Match score weights: distance 35% · size 25% · config 20% · recency 20%. Top-matched comps best support the ARV.
Projected returns pro-forma
-3.0% appreciation · 3.0% rent growth · sell at horizon
- IRR
- -1.0%
- Equity multiple
- 0.96×
- Total profit
- $-3,728
- Equity at exit
- $51,888
- IRR
- 8.7%
- Equity multiple
- 1.66×
- Total profit
- $64,786
- Equity at exit
- $30,089
Cash invested: $97,440 (down + closing). Projections, not guarantees.
Landlord ↔ Tenant lean methodology
- Overall (STATE)
- 73 Landlord-Friendly
- State Ohio
- 73 Landlord-Friendly · R+6
- County
- — inherits STATE
- City
- — inherits STATE
ZIP-level market 45177
- Active inventory
- 108
- Price-to-rent
- 7.0×
Monthly cashflow live
- Estimated rent
- $4,125 medium interval (Pro) →
- Mortgage (P&I)
- −$1,825
- Tax est. 1.5%
- −$435 /mo · $5,220/yr
- Insurance
- −$145
- HOA
- −$28
- Vacancy / Maint / Mgmt
- −$866
- Net cashflow
- $826
Break-even live
Sensitivity live
| Price | -10% $1,066 | -5% $946 | +0% $826 | +5% $705 | +10% $585 |
|---|---|---|---|---|---|
| Rent | -10% $500 | -5% $663 | +0% $826 | +5% $989 | +10% $1,151 |
| Rate | -1.0pp $1,001 | -0.5pp $914 | base $826 | +0.5pp $735 | +1.0pp $644 |
UW: 25.0% down · 7.5% · 30yr · 1.5% tax · 5.0% vac · 8.0% maint · 8.0% mgmt
Financing live
Cash to close
- Down payment
- $87,000
- Closing costs
- $10,440
- Reserves months
- —
- Total cash needed
- —
Loan-product check · same deal, 3 products live
Conventional
25% down · 7.5% · 30yr
- Down + closing
- —
- Monthly P&I
- —
- Monthly cashflow
- —
- DSCR
- —
- Eligible?
- —
Personal DTI + credit; lowest rate.
DSCR
20% down · 8.5% · 30yr
- Down + closing
- —
- Monthly P&I
- —
- Monthly cashflow
- —
- DSCR
- —
- Eligible?
- —
No personal income docs; deal must DSCR.
Hard money
10% down · 12.0% · 12mo
- Down + closing
- —
- Monthly P&I
- —
- Monthly cashflow
- —
- DSCR
- —
- Eligible?
- —
Short-term bridge; refi at stabilization.
Rent comps 3 comps
| Address | Beds | Baths | Sqft | Rent | $/sqft | DOM | Units | Dist |
|---|---|---|---|---|---|---|---|---|
| 109 Southwind Blvd Wilmington, OH | 3.0 | 2.0 | 1344 | $4,995 | $3.72 | 4d | 1 | 0.64mi |
| 121 Southwind Blvd Wilmington, OH | 3.0 | 2.0 | 1344 | $4,995 | $3.72 | 4d | 1 | 0.65mi |
| 229 Taylor Dr Wilmington, OH | 3.0 | 2.0 | 1242 | $2,000 | $1.61 | 13d | 1 | 0.73mi |
HOA detail
- Monthly dues
- $28 · $336/yr
Listing history 22 events
-
2026-06-22days on market $348,000 Active 213 DOM
-
2026-06-18days on market $348,000 Active 210 DOM
-
2026-06-17days on market $348,000 Active 209 DOM
-
2026-06-16days on market $348,000 Active 208 DOM
-
2026-06-15days on market $348,000 Active 207 DOM
-
2026-06-14days on market $348,000 Active 205 DOM
-
2026-06-10days on market $348,000 Active 202 DOM
-
2026-06-09days on market $348,000 Active 201 DOM
-
2026-06-08days on market $348,000 Active 200 DOM
-
2026-06-07days on market $348,000 Active 199 DOM
-
2026-06-05days on market $348,000 Active 196 DOM
-
2026-06-03days on market $348,000 Active 195 DOM
-
2026-06-02days on market $348,000 Active 194 DOM
-
2026-06-01days on market $348,000 Active 193 DOM
-
2026-05-31days on market $348,000 Active 192 DOM
-
2026-05-31days on market $348,000 Active 191 DOM
-
2026-05-14price $350,000 367-char remark
Show marketing remark (369 chars)
The Mayfair II Design by Cristo Homes! This beautiful 3 bed, 2 bath ranch boasts ~1802 sqft of living space! Eat-in kitchen with granite countertops + pantry offers a full view to the Great Rm & Dining Area. Split bedroom layout. Primary suite w adjoining bath ft. double vanity and walk-in closet. Convenient first floor laundry! Mudroom. 2-car oversized garage.
-
2026-05-14price $350,000 369-char remark
Show marketing remark (369 chars)
The Mayfair II Design by Cristo Homes! This beautiful 3 bed, 2 bath ranch boasts ~1802 sqft of living space! Eat-in kitchen with granite countertops + pantry offers a full view to the Great Rm & Dining Area. Split bedroom layout. Primary suite w adjoining bath ft. double vanity and walk-in closet. Convenient first floor laundry! Mudroom. 2-car oversized garage.
-
2026-03-27price $368,195
-
2026-01-24$369,195 Active
-
2025-11-19$368,195 Active 367-char remark
Show marketing remark (369 chars)
The Mayfair II Design by Cristo Homes! This beautiful 3 bed, 2 bath ranch boasts ~1802 sqft of living space! Eat-in kitchen with granite countertops + pantry offers a full view to the Great Rm & Dining Area. Split bedroom layout. Primary suite w adjoining bath ft. double vanity and walk-in closet. Convenient first floor laundry! Mudroom. 2-car oversized garage.
-
2025-11-19$368,195 Active 369-char remark
Show marketing remark (369 chars)
The Mayfair II Design by Cristo Homes! This beautiful 3 bed, 2 bath ranch boasts ~1802 sqft of living space! Eat-in kitchen with granite countertops + pantry offers a full view to the Great Rm & Dining Area. Split bedroom layout. Primary suite w adjoining bath ft. double vanity and walk-in closet. Convenient first floor laundry! Mudroom. 2-car oversized garage.
ⓘ Source: listings_history table (triggers on properties + properties_extension) + one-shot
backfill from property_details.listing_events for pre-trigger history.
Climate risk First Street
- Flood 1/10 Low FEMA zone X (unshaded) · 0% chance over 30 yrs
- Wildfire 1/10 Low
- Heat 3/10 Moderate 7 d/yr ≥100°F today · 19 d/yr by 30 yrs out
- Wind 2/10 Low 100% chance of damaging wind over 30 yrs
- Air quality 2/10 Low 1 unhealthy d/yr today · 2 by 30 yrs out
Nearby sold comps map
Loading sold comps map…
Walkable amenities ~0.75 mi
Loading nearby amenities…
Taxation est. · year 1
- Rental income
- $49,497
- − Mortgage interest
- −$19,493
- − Property taxes
- −$5,220
- − Insurance
- −$1,740
- − Repairs & maintenance
- −$3,960
- − Management
- −$3,960
- − HOA
- −$336
- − Depreciation
- −$10,124
- Taxable income
- $4,665
- Est. tax owed @ 24.0%
- −$1,119
- After-tax cash flow
- $8,788/yr
For passive investors: Depreciation is non-cash, so a rental often shows a tax loss while cash-flowing — sheltering income. Rental losses are passive: they offset passive income freely, and up to $25,000/yr can offset ordinary (W-2) income if you actively participate and your MAGI is under $100k (phasing out to $0 by $150k); unused losses carry forward. On sale, claimed depreciation is recaptured at up to 25%, and gains may owe capital-gains tax (a 1031 exchange can defer both). Figures are a year-1 estimate at your 24.0% rate — not tax advice; consult a CPA.
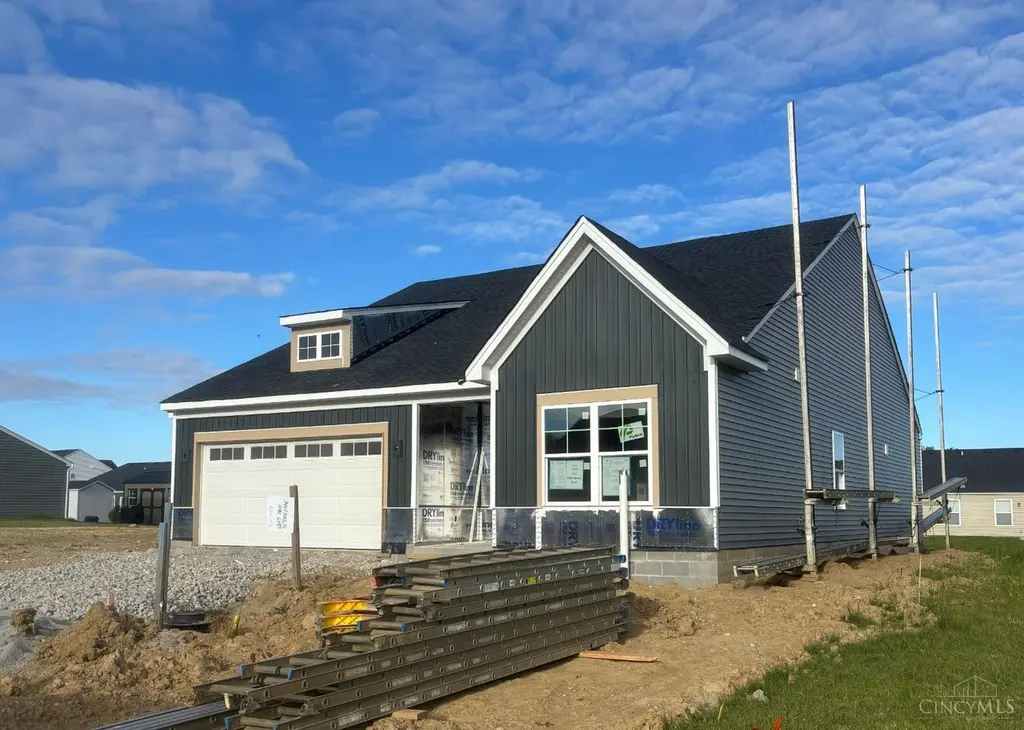
Condition & rehab AI · 1 photo
This property is in the construction phase and requires extensive renovation to be move-in ready. Significant updates are needed to complete the exterior, interior, and landscaping to increase its resale and rental value.
Value-add opportunities
- Both Complete exterior siding and roof installation — Completes the exterior and enhances curb appeal.
- Both Install kitchen cabinets and countertops — Enhances functionality and aesthetic appeal.
- Both Install bathroom fixtures and finishes — Enhances functionality and aesthetic appeal.
- Both Install flooring — Enhances functionality and aesthetic appeal.
- Both Paint interior walls — Enhances aesthetic appeal and creates a finished look.
- Both Install windows — Enhances natural light and aesthetic appeal.
- Both Install HVAC and mechanical systems — Ensures comfort and functionality.
- Both Complete landscaping and curb appeal — Enhances curb appeal and creates a welcoming environment.
Renovation cost estimate screening
Value-add ROI direction
- Both Complete exterior siding and roof installation — Completes the exterior and enhances curb appeal. ↑
- Both Install kitchen cabinets and countertops — Enhances functionality and aesthetic appeal. ↑
- Both Install bathroom fixtures and finishes — Enhances functionality and aesthetic appeal. ↑
- Both Install flooring — Enhances functionality and aesthetic appeal. ↑
- Both Paint interior walls — Enhances aesthetic appeal and creates a finished look. ↑
- Both Install windows — Enhances natural light and aesthetic appeal. ↑
- Both Install HVAC and mechanical systems — Ensures comfort and functionality. ↑
- Both Complete landscaping and curb appeal — Enhances curb appeal and creates a welcoming environment. ↑
ⓘ Cost ranges are severity-bucket heuristics (US national rule-of-thumb). Get contractor quotes + a written scope before underwriting a rehab budget.
Schools (NCES district)
- District
- Wilmington City
- NCES district ID
- 3904511
- Math proficiency
- 42% ▼ -16.00%
- Reading proficiency
- 51% ▼ -6.00%
- Median HH income
- $43,201
- Composite
- 39.2/100
- National rank
- #4020
- State rank
- #492 of 656 in OH
Livability — Wilmington
- Score
- 77/100
- State rank
- #202
- US rank
- #3127
Category grades
Schools grade is shown separately in the Schools card above.
Census & demographics
- Census place
- Wilmington, OH
- County
- Clinton · 46,911 people
- Population (ZIP)
- 22,442
- Household income
- $70,483
- Rent vs Own
- Severe rent burden
- 9.5
Population outlook (Clinton County) Hauer SSP2
- Today (2025)
- 41,352 people
- By 2030
- 40,831 · -1.3%
- By 2040
- 39,049 · -5.6%
- By 2050
- 36,408 · -12.0%
- By 2075
- 29,652 · -28.3%
- By 2100
- 20,736 · -49.9%
Race, ethnicity, and origin ACS 2023
- Neighborhood character
- Predominantly White (91%)
- Race & ethnicity
- White 91% Two or more races 3% Black 3% Hispanic / Latino 2% Asian 1%
- Common ancestry
- Lithuanian 2% Slovak 2% Romanian 2%
- Foreign-born
- 3% · Canada, Jamaica
- Languages at home
- 97% English-only · Spanish 1% Other Asian/Pacific 1%
Political lean MEDSL · Clinton
- 2024 margin
- Solid R (+54.6) · D 22.3% · R 76.9%
- 2008→2024 swing
- -24.3pp toward R · 2008: -30.3pp · 2024: -54.6pp
- All cycles
- 2024: R+54.6 2020: R+52.6 2016: R+52.6 2012: R+35.2 2008: R+30.3
Not yet ingested
- Civics
- —
Market trends
- HPI YoY
- ▼ -150.35%
- Current HPI
- 238.9182
- Rent YoY
- —
- Metro
- —
- State GDP YoY
- ▲ 1.98%
- F500 in state
- 48
Industry mix (Fortune 500 HQ in OH)
| Industry | F500 HQs | Revenue |
|---|---|---|
| Insurance | 3 | $145B |
|
||
| Industrial Machinery | 3 | $49B |
|
||
| Financial Services | 3 | $24B |
|
||
| Consumer Goods | 2 | $93B |
|
||
| Aerospace / Defense | 2 | $47B |
|
||
| Utilities | 2 | $33B |
|
||
Price history
-4.9% since first listed6 events — show timeline
- 2026-05-14 Price Changed $350,000 Cincy MLS
- 2026-05-14 Price Changed $350,000 Dayton MLS
- 2026-03-27 Price Changed $368,195 Zillow
- 2026-01-24 Listed $369,195 Zillow
- 2025-11-19 Listed $368,195 Dayton MLS
- 2025-11-19 Listed $368,195 Cincy MLS
Cash-flow waterfall
monthlySold comps — $/sqft
last 12 mo · ≤1 miLoading sold comps…