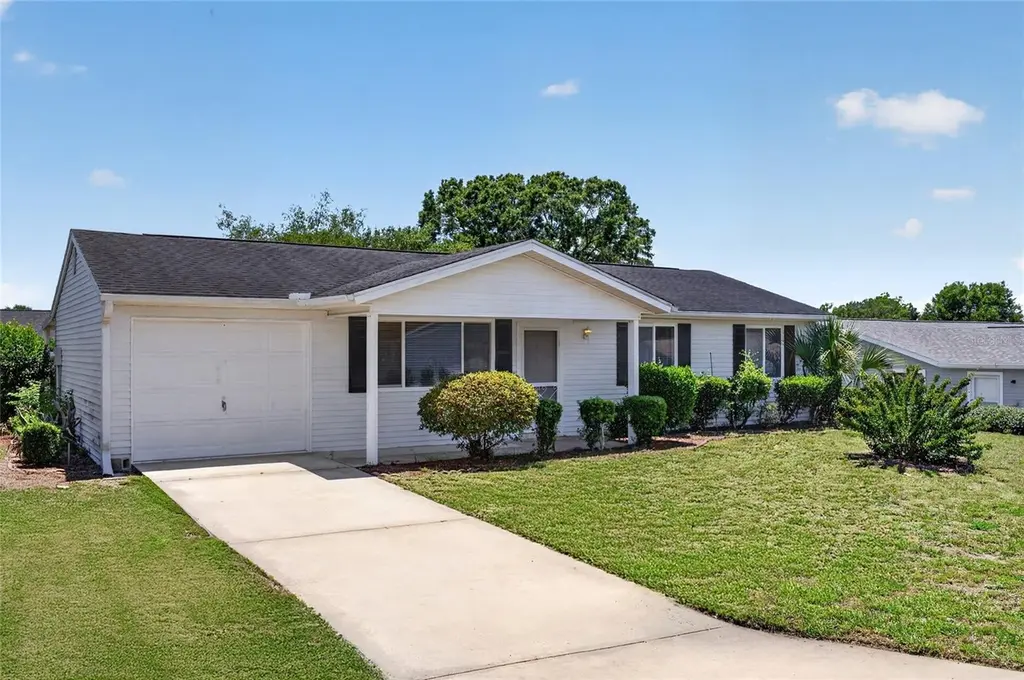
8720 SW 108th Ln · Liberty Triangle, FL
Flood risk 1/10 · Minimal
- FEMA flood zone
- X (unshaded)
- Chance of flooding over 30 yrs
- 0.0%
- Est. flood insurance / yr
- $507 – $1,088
Fire risk 4/10 · Minor
- Est. fire insurance / yr
- $947 – $1,759
Heat risk 8/10 · Major
- Hot days now (above 107°F)
- 7 days/yr
- Hot days in 30 yrs
- 23 days/yr
Wind risk 9/10 · Severe
- Chance of severe wind over 30 yrs
- 99.0%
Air-quality risk 3/10 · Minor
- Unhealthy air days now
- 3 days/yr
- Unhealthy air days in 30 yrs
- 3 days/yr
Risk factors via First Street. Map © Google.
Why this score? — see what drove the D grade
The composite is a weighted blend of 9 inputs, each scored 0–100. Each bar is that input's sub-score; the figure is the points it added to the 100-point composite (weight × sub-score).
- Cash flow +13.7/30.0
- ARV discount +8.6/15.0
- 1% rule +5.2/10.0
- DSCR +4.1/10.0
- Schools +3.6/10.0
- Rent growth +2.5/5.0
- Livability +2.5/5.0
- Condition / age +2.5/5.0
- Appreciation +0.0/10.0
$149,900
🖨 Deal sheet (PDF) 📄 Offer letter ✓ Due diligence
Listing remarks MLS
This is a Fannie Mae HomePath property. Purchase this home for as little as 3% down! Lovely gated community of Oak Run has a community pool and is close to all shopping, dining and hospitals. 2 bed 2 bath home has dining area in kitchen, master bath has walk-in shower, living room, ceramic tiled lanai with acrylic windows, perfect spot for entertaining.
Key facts
- Newer appliances
- Cozy porch
- Oak run community
Tags
Property features AI
Finance
- Other: Lot about 0.16 acre (approx. 85 x 80), cleared and paved, on private maintained road; PUD zoning
- HOA & community: Oak Run Association with monthly HOA of $155; HOA includes cable TV, pool, and recreational facilities; Community amenities: Clubhouse, deed restrictions, dog park, fitness center, golf, pool, tennis courts; golf carts allowed; Senior community; Pets allowed
Exterior
- Parking: Attached garage (1 car)
- Utilities: Public water; Public sewer; Electricity connected; Water connected; Sewer connected
- Home design: Single family residence; Residential property; One story; Faces southwest; Fixer condition
- Construction: Vinyl siding; Shingle roof; Slab foundation; Built on or before public records (one-story)
- Exterior features: Covered, enclosed, and screened front porch
Interior
- Kitchen: Dishwasher; Range; Microwave; Refrigerator; Electric water heater
- Bedrooms: 2 bedrooms
- Flooring: Carpet; Laminate; Tile
- Bathrooms: 2 full bathrooms
- Heating & cooling: Heat pump; Central air
- Interior features: Solid surface counters; Thermostat; Window treatments; Florida room
- Laundry & utility: Washer; Dryer; Laundry: Other
Neighborhood map
What this means for you Summary
Snapshot
- This is a 2-bed/2.0-bath single-family listed at $150k.
Deal economics
- At list price, monthly cash flow is $10 ($118/yr) — positive.
- The deal already cash-flows at list — no discount required.
- Meets the 1% rule at list price ($2k rent vs $150k).
- Cap rate 6.4% vs local median 4.5% in Liberty Triangle — top-decile yield for the area; either an underpriced asset or a hidden risk that comps aren't pricing in. Stress-test before assuming the spread holds.
Location & tenants
- Location reads: area grade D — affects rentability + tenant quality, not the cash-flow math above.
- Marion (rural): math 42% / reading 43% proficiency, ranked #61 of 73 in FL (top 84%) — families likely to look elsewhere, expect single-tenant / working-renter base with shorter leases; 61% free/reduced lunch — lower-income household profile, screen leases tightly.
- Zoned schools: Hammett Bowen Jr. Elementary School (math 56% / reading 56%, grade C+, #832 of 2,144 statewide, top 40%, 867 students, 54% FRL); Liberty Middle School (math 40% / reading 41%, grade F, #360 of 571 statewide, top 64%, 1,365 students, 54% FRL); West Port High School (math 34% / reading 52%, grade F, #255 of 667 statewide, top 39%, 2,906 students, 52% FRL).
- Market conditions: 1161 active listings in the ZIP; 9 comparable units currently listed for rent nearby; rentals at typical pace (median 23d on market — plan ~3-4 weeks tenant-placement turnaround); 7,071 units permitted in Marion County in 2024 (534 in 5+ unit buildings).
- This rent runs 32% of the median local income ($57k/yr) — at the standard rent-burdened threshold; future hikes will face affordability resistance.
Forward outlook
- Local home prices are declining (-3.0%/yr); year-one equity from $1k of loan paydown is wiped out by about $4k of value loss. Plan a longer hold.
- Marion County population projected at +13% by 2050 — modest demand growth; plan on rents tracking national, not racing it.
Negotiation context
- Only 12 days on market — expect competitive offers; lowballing is unlikely to land.
- 4 sale attempts since 21y ago with the ask held roughly flat each time — persistent listings suggest the price (not the market) is what's stuck; bring a comps-based counter.
- Current owner paid $37k; list at $150k implies a 305% gain — meaningful room to come down on a strong offer.
Risks & watch-outs
- Climate carrying-cost: severe wind risk, 99% chance of damaging wind over 30y; extreme-heat days projected 7→23/yr by 2055 (HVAC capex compounding) — expect insurance premiums to compound above CPI over the hold.
Questions for the listing agent
- What does the HOA fee cover, when was the last increase, and are there any pending special assessments or reserve-fund shortfalls?
- Is there a deadline driving the sale (1031 exchange, divorce, estate, relocation)? That informs how much negotiation room exists.
- The area grade is low — what's the realistic commute time and amenity access for the typical tenant pool here? Any planned neighborhood developments (good or bad) we should know about?
- What's the average days-on-market for RENTAL listings here right now (not sales)? A rising rental-DOM trend means longer vacancies and softer asking-rent achievability than the comps imply.
- What's the recent tenant-quality profile in this submarket — average credit score on applications, eviction rate, late-payment / NSF rate, and stable-employment percentage? A property-management company in the area should have these aggregated.
- How much new for-sale + rental construction is in the pipeline within 1–3 miles? Heavy new supply typically softens prices + rents 12–24 months out; constrained supply supports both.
Investment metrics
- 1% rule
- 1.02% ✓
- Cap rate
- 6.37%
- Cash-on-cash
- 0.28%
- DSCR
- 1.01
- GRM
- 8.2
CMA / ARV
- ARV (on-the-fly)
- $153,600
- Comps found
- 12
Show comp detail 12 sales within ~0.75 mi
| Address | Dist | Beds/Ba | Sqft | Sold | Price | $/sf | Match |
|---|---|---|---|---|---|---|---|
| 10940 SW 87th Ct | 0.13mi | 2/2.0 | 960 (0%) | 2mo | $178,000 | $185 | 92 |
| 11401 SW 85th Ct | 0.36mi | 2/2.0 | 1,000 (+4%) | 4mo | $187,000 | $187 | 73 |
| 11520 SW 85th Ct | 0.48mi | 2/2.0 | 988 (+3%) | 3mo | $170,000 | $172 | 70 |
| 8344 SW 107th Pl | 0.54mi | 2/2.0 | 960 (0%) | 8mo | $143,200 | $149 | 68 |
| 8329 SW 105th Pl | 0.71mi | 2/2.0 | 960 (0%) | 2mo | $185,000 | $193 | 66 |
| 8108 SW 108th Place Rd | 0.61mi | 2/2.0 | 992 (+3%) | 4mo | $160,000 | $161 | 63 |
| 8431 SW 109th Lane Rd | 0.40mi | 1/1.0 (-1) | 912 (-5%) | 4mo | $103,000 | $113 | 60 |
| 8473 SW 106th St | 0.59mi | 2/2.0 | 936 (-2%) | 10mo | $133,000 | $142 | 60 |
| 10917 SW 82nd Ter | 0.50mi | 2/2.0 | 1,032 (+8%) | 11mo | $115,000 | $111 | 55 |
| 8343 SW 105th Pl | 0.70mi | 2/2.0 | 936 (-2%) | 11mo | $150,000 | $160 | 54 |
| 8463 SW 108th Pl | 0.28mi | 2/2.0 | 1,100 (+15%) | 11mo | $165,000 | $150 | 53 |
| 8157 SW 108th Loop | 0.67mi | 2/2.0 | 1,101 (+15%) | 2mo | $175,000 | $159 | 43 |
Match score weights: distance 35% · size 25% · config 20% · recency 20%. Top-matched comps best support the ARV.
Projected returns pro-forma
-3.0% appreciation · 3.0% rent growth · sell at horizon
- IRR
- -15.8%
- Equity multiple
- 0.44×
- Total profit
- $-23,541
- Equity at exit
- $22,351
- IRR
- -7.2%
- Equity multiple
- 0.54×
- Total profit
- $-19,198
- Equity at exit
- $12,961
Cash invested: $41,972 (down + closing). Projections, not guarantees.
Landlord ↔ Tenant lean methodology
- Overall (STATE)
- 87 Strongly Landlord-Friendly
- State Florida
- 87 Strongly Landlord-Friendly · R+3
- County
- — inherits STATE
- City
- — inherits STATE
ZIP-level market 34481
- Home prices YoY
- -25.2%
- Active inventory
- 1161
- Price-to-rent
- 8.2×
Monthly cashflow live
- Estimated rent
- $1,526 high interval (Pro) →
- Mortgage (P&I)
- −$786
- Tax from tax record
- −$192 /mo · $2,309/yr
- Insurance
- −$62
- HOA
- −$155
- Vacancy / Maint / Mgmt
- −$321
- Net cashflow
- $10
Break-even live
Sensitivity live
| Price | -10% $95 | -5% $52 | +0% $10 | +5% $-33 | +10% $-75 |
|---|---|---|---|---|---|
| Rent | -10% $-111 | -5% $-50 | +0% $10 | +5% $70 | +10% $130 |
| Rate | -1.0pp $85 | -0.5pp $48 | base $10 | +0.5pp $-29 | +1.0pp $-69 |
UW: 25.0% down · 7.5% · 30yr · 1.5% tax · 5.0% vac · 8.0% maint · 8.0% mgmt
Financing live
Cash to close
- Down payment
- $37,475
- Closing costs
- $4,497
- Reserves months
- —
- Total cash needed
- —
Loan-product check · same deal, 3 products live
Conventional
25% down · 7.5% · 30yr
- Down + closing
- —
- Monthly P&I
- —
- Monthly cashflow
- —
- DSCR
- —
- Eligible?
- —
Personal DTI + credit; lowest rate.
DSCR
20% down · 8.5% · 30yr
- Down + closing
- —
- Monthly P&I
- —
- Monthly cashflow
- —
- DSCR
- —
- Eligible?
- —
No personal income docs; deal must DSCR.
Hard money
10% down · 12.0% · 12mo
- Down + closing
- —
- Monthly P&I
- —
- Monthly cashflow
- —
- DSCR
- —
- Eligible?
- —
Short-term bridge; refi at stabilization.
Rent comps 9 comps
| Address | Beds | Baths | Sqft | Rent | $/sqft | DOM | Units | Dist |
|---|---|---|---|---|---|---|---|---|
| 8942 SW 109th Ln Ocala, FL | 2.0 | 2.0 | 960 | $1,450 | $1.51 | 23d | 1 | 0.24mi |
| 8947 SW 108th Pl Ocala, FL | 2.0 | 2.0 | 1096 | $1,500 | $1.37 | 23d | 1 | 0.27mi |
| 8130 SW 108th Street Rd Ocala, FL | 2.0 | 2.0 | 1084 | $1,975 | $1.82 | 23d | 1 | 0.58mi |
| 10441 SW 85th Ct Ocala, FL | 2.0 | 2.0 | 1090 | $1,495 | $1.37 | 23d | 1 | 0.65mi |
| 11112 SW 78th Ave Ocala, FL | 2.0 | 1.0 | 672 | $1,150 | $1.71 | 23d | 1 | 0.90mi |
| 9075 SW 102nd Pl Ocala, FL | 2.0 | 2.0 | 1008 | $1,275 | $1.26 | 23d | 1 | 0.99mi |
| 10081 SW 95th Ave Ocala, FL | 2.0 | 2.0 | 1040 | $1,395 | $1.34 | 23d | 1 | 1.31mi |
| 10405 SW 99th Ave Ocala, FL | 2.0 | 2.0 | 1040 | $1,450 | $1.39 | 23d | 1 | 1.37mi |
| 10081 SW 97th Ct Ocala, FL | 2.0 | 1.0 | 992 | $1,200 | $1.21 | 15d | 1 | 1.47mi |
HOA detail
- Monthly dues
- $155 · $1,860/yr
- Likely covers
- poolsecurity
Listing history 22 events
-
2026-06-09remarks 693-char remark
-
2026-06-09status $149,900 Pending 12 DOM
-
2026-06-08days on market $149,900 Active 12 DOM
-
2026-06-07days on market $149,900 Active 11 DOM
-
2026-06-03days on market $149,900 Active 7 DOM
-
2026-06-02days on market $149,900 Active 6 DOM
-
2026-06-01days on market $149,900 Active 5 DOM
-
2026-05-31days on market $149,900 Active 4 DOM
-
2026-05-30days on market $149,900 Active 3 DOM
-
2026-05-27$149,900 Active
-
2026-02-24historical
-
2025-12-08price $169,900
-
2025-05-14price $174,000
-
2025-05-03$179,000 Active
-
2013-06-26soldstatus $37,000 355-char remark
Show marketing remark (355 chars)
This is a Fannie Mae HomePath property. Purchase this home for as little as 3% down! Lovely gated community of Oak Run has a community pool and is close to all shopping, dining and hospitals. 2 bed 2 bath home has dining area in kitchen, master bath has walk-in shower, living room, ceramic tiled lanai with acrylic windows, perfect spot for entertaining.
-
2013-03-15$40,900 355-char remark
Show marketing remark (355 chars)
This is a Fannie Mae HomePath property. Purchase this home for as little as 3% down! Lovely gated community of Oak Run has a community pool and is close to all shopping, dining and hospitals. 2 bed 2 bath home has dining area in kitchen, master bath has walk-in shower, living room, ceramic tiled lanai with acrylic windows, perfect spot for entertaining.
-
2006-06-28soldstatus $138,900
-
2005-11-21soldstatus $98,500
-
2005-11-15soldstatus $98,500
-
2005-09-29$98,500
-
1988-08-01soldstatus $55,000
-
1986-12-01soldstatus $46,330
ⓘ Source: listings_history table (triggers on properties + properties_extension) + one-shot
backfill from property_details.listing_events for pre-trigger history.
Tax reassessment forecast FL · Resets to sale price
- Current annual tax
- $2,309 · $192/mo
- Projected year-2 tax
- $2,309 · $192/mo
- Expected delta
- $0/yr ($0/mo · 0.0%)
ⓘ Screening estimate from a state-policy table — verify with the county assessor before closing.
Climate risk First Street
- Flood 1/10 Low FEMA zone X (unshaded) · 0% chance over 30 yrs
- Wildfire 4/10 Moderate
- Heat 8/10 Severe 7 d/yr ≥107°F today · 23 d/yr by 30 yrs out
- Wind 9/10 Extreme 99% chance of damaging wind over 30 yrs
- Air quality 3/10 Moderate 3 unhealthy d/yr today · 3 by 30 yrs out
Nearby sold comps map
Loading sold comps map…
Walkable amenities ~0.75 mi
Loading nearby amenities…
Taxation est. · year 1
- Rental income
- $18,317
- − Mortgage interest
- −$8,397
- − Property taxes
- −$2,309
- − Insurance
- −$750
- − Repairs & maintenance
- −$1,465
- − Management
- −$1,465
- − HOA
- −$1,860
- − Depreciation
- −$4,361
- Taxable loss
- −$2,290
- Est. tax savings @ 24.0%
- +$550
- After-tax cash flow
- $668/yr
For passive investors: Depreciation is non-cash, so a rental often shows a tax loss while cash-flowing — sheltering income. Rental losses are passive: they offset passive income freely, and up to $25,000/yr can offset ordinary (W-2) income if you actively participate and your MAGI is under $100k (phasing out to $0 by $150k); unused losses carry forward. On sale, claimed depreciation is recaptured at up to 25%, and gains may owe capital-gains tax (a 1031 exchange can defer both). Figures are a year-1 estimate at your 24.0% rate — not tax advice; consult a CPA.
Schools (NCES district)
- District
- Marion
- NCES district ID
- 1201260
- Math proficiency
- 42% ▼ -7.00%
- Reading proficiency
- 43% ▼ -4.00%
- Median HH income
- $40,015
- Composite
- 35.61/100
- National rank
- #4890
- State rank
- #61 of 73 in FL
Livability — Liberty Triangle
No livability data for this city. (Only ~50 U.S. cities are tracked.)
Census & demographics
- Census place
- Liberty Triangle, FL
- County
- Marion County · 315,796 people
- City population
- 26,397
- Metro
- Ocala, FL
- Population (ZIP)
- 26,782
- Household income
- $57,324
- Rent vs Own
- Severe rent burden
- 313.0
Population outlook (Marion County) Hauer SSP2
- Today (2025)
- 365,905 people
- By 2030
- 376,768 · +3.0%
- By 2040
- 396,555 · +8.4%
- By 2050
- 412,723 · +12.8%
- By 2075
- 446,090 · +21.9%
- By 2100
- 436,193 · +19.2%
Race, ethnicity, and origin ACS 2023
- Neighborhood character
- Predominantly White (80%)
- Race & ethnicity
- White 80% Hispanic / Latino 11% Black 7% Two or more races 5%
- Hispanic origin (detail)
- Mexican 4% Puerto Rican 4% Cuban 1%
- Common ancestry
- Romanian 7% Lithuanian 3% Slovak 2%
- Foreign-born
- 8% · Canada, Jamaica
- Languages at home
- 88% English-only · Spanish 9% French/Haitian/Cajun 1% German/W. Germanic 1%
Political lean MEDSL · Marion
- 2024 margin
- Solid R (+31.6) · D 33.8% · R 65.5%
- 2008→2024 swing
- -20.0pp toward R · 2008: -11.6pp · 2024: -31.6pp
- All cycles
- 2024: R+31.6 2020: R+25.9 2016: R+26.2 2012: R+16.2 2008: R+11.6
Not yet ingested
- Civics
- —
Market trends
- HPI YoY
- ▼ -67.48%
- Current HPI
- 199.986
- Rent YoY
- —
- Metro
- Ocala, FL
- State GDP YoY
- ▲ 3.28%
- F500 in state
- 36
Industry mix (Fortune 500 HQ in FL)
| Industry | F500 HQs | Revenue |
|---|---|---|
| Industrial Technology | 2 | $29B |
|
||
| Insurance | 2 | $17B |
|
||
| Retail | 1 | $60B |
|
||
| Technology Distribution | 1 | $58B |
|
||
| Homebuilding | 1 | $35B |
|
||
| Technology Manufacturing | 1 | $35B |
|
||
Price history
+223.5% since first listed13 events — show timeline
- 2026-05-27 Listed $149,900 Stellar MLS as Distributed by MLS Grid
- 2026-02-24 Listing Removed — Stellar MLS as Distributed by MLS Grid
- 2025-12-08 Price Changed $169,900 Stellar MLS as Distributed by MLS Grid
- 2025-05-14 Price Changed $174,000 Stellar MLS as Distributed by MLS Grid
- 2025-05-03 Listed $179,000 Stellar MLS as Distributed by MLS Grid
- 2013-06-26 Sold (MLS) $37,000 Stellar MLS as Distributed by MLS Grid
- 2013-03-15 Listed $40,900 Stellar MLS as Distributed by MLS Grid
- 2006-06-28 Sold (Public Records) $138,900 Public Records
- 2005-11-21 Sold (Public Records) $98,500 Public Records
- 2005-11-15 Sold (MLS) $98,500 Stellar MLS as Distributed by MLS Grid
- 2005-09-29 Listed $98,500 Stellar MLS as Distributed by MLS Grid
- 1988-08-01 Sold (Public Records) $55,000 Public Records
- 1986-12-01 Sold (Public Records) $46,330 Public Records
Property tax history
+8.5%/yrLatest (2025): $2,309 · +9.6% YoY. Source: county tax records.
Cash-flow waterfall
monthlySold comps — $/sqft
last 12 mo · ≤1 miLoading sold comps…