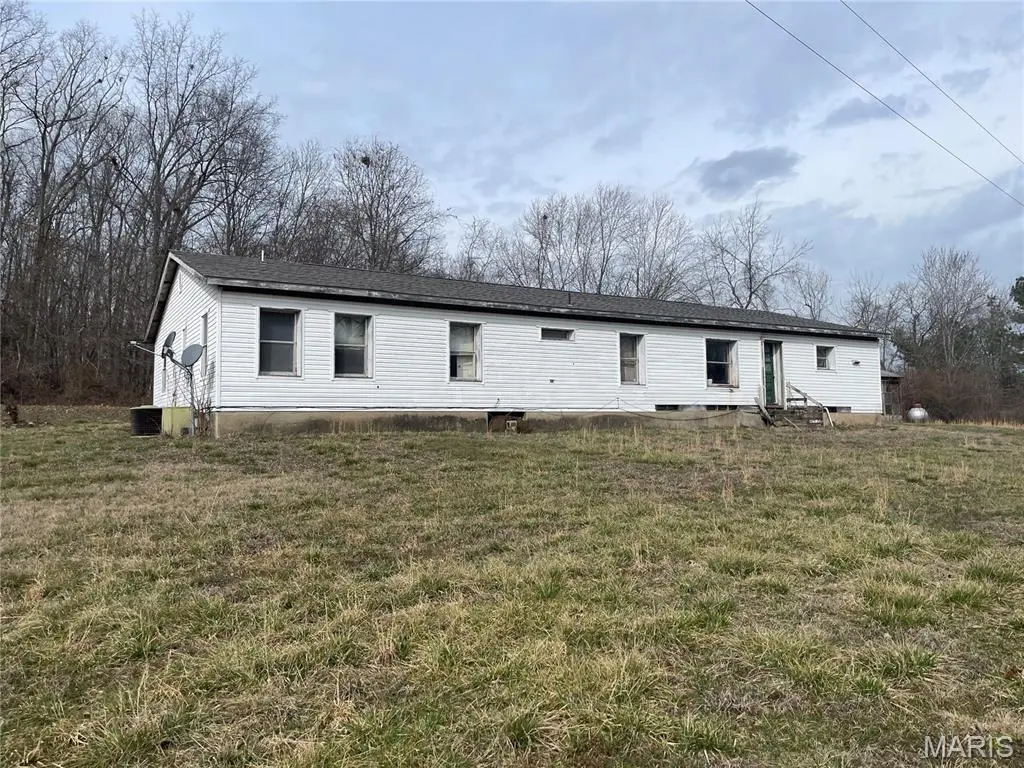
103 Private Rd 341-14 · Piedmont, MO
Flood risk 1/10 · Minimal
- FEMA flood zone
- X (unshaded)
- Chance of flooding over 30 yrs
- 0.0%
- Est. flood insurance / yr
- $507 – $1,088
Fire risk 4/10 · Minor
- Est. fire insurance / yr
- $1,054 – $1,958
Heat risk 5/10 · Moderate
- Hot days now (above 107°F)
- 7 days/yr
- Hot days in 30 yrs
- 20 days/yr
Wind risk 2/10 · Minimal
- Chance of severe wind over 30 yrs
- 3.0%
Air-quality risk 1/10 · Minimal
- Unhealthy air days now
- 0 days/yr
- Unhealthy air days in 30 yrs
- 0 days/yr
Risk factors via First Street. Map © Google.
Why this score? — see what drove the B grade
The composite is a weighted blend of 9 inputs, each scored 0–100. Each bar is that input's sub-score; the figure is the points it added to the 100-point composite (weight × sub-score).
- Cash flow +28.6/30.0
- DSCR +10.0/10.0
- 1% rule +7.9/10.0
- Appreciation +7.9/10.0
- ARV discount +7.5/15.0
- Schools +2.7/10.0
- Livability +2.6/5.0
- Rent growth +2.5/5.0
- Condition / age +1.0/5.0
$89,900
🖨 Deal sheet (PDF) 📄 Offer letter ✓ Due diligence
Listing remarks MLS
Nice location on dead end lane, just outside of town but near the golf course and Lon Sanders Canyon. Manufactured home with add on sitting on 4.19 acres m/l. Home has living room, family room, kitchen, dining room, 3-bedrooms and 1-3/4-bath. Home has a new roof, is vinyl sided with an attached carport/patio area. Detached garage and workshop with an add on. Lots of unfinished projects and remodeling has been started. Bring your creativity and elbow grease and make this house into your next country home.
Key facts
- Vinyl sided
- Attached carport
- Dead end lane
Tags
Neighborhood map
What this means for you Summary
Snapshot
- This is a 3-bed/1.5-bath single-family listed at $90k. Condition is rated poor.
Deal economics
- At list price, monthly cash flow is $297 ($4k/yr) — positive.
- The deal already cash-flows at list — no discount required.
- Meets the 1% rule at list price ($1k rent vs $90k).
- Recommended offer: $82k (9.0% below list) — sets the bar for market timing.
- Cap rate 10.3% vs local median 4.3% in Piedmont — top-decile yield for the area; either an underpriced asset or a hidden risk that comps aren't pricing in. Stress-test before assuming the spread holds.
Location & tenants
- Location reads 52/100 on livability (#854 in MO) — a working-class tenant base; expect higher turnover. Strengths: cost of living A+, housing A+; Watch: crime F, amenities F, commute F.
- Clearwater R-I (rural): math 33% / reading 33% proficiency, ranked #255 of 324 in MO (top 79%) — families likely to look elsewhere, expect single-tenant / working-renter base with shorter leases; 62% free/reduced lunch — lower-income household profile, screen leases tightly.
- Zoned schools: Clearwater Elementary (math 42% / reading 32%, grade F, #611 of 1,115 statewide, top 59%, 414 students, 72% FRL); Clearwater Middle (math 26% / reading 27%, grade F, #313 of 391 statewide, top 81%, 263 students, 66% FRL); Clearwater High (math 34% / reading 57%, grade D-, #174 of 521 statewide, top 33%, 239 students, 55% FRL) — zoned schools at 64% FRL track the district average.
- Market conditions: 70 active listings in the ZIP.
Forward outlook
- In year one you build about $6k of equity ($622 loan paydown + $5k appreciation (5.9% local appreciation)).
- Wayne County population projected to shrink 9% by 2050 — rents likely to lag national; underwrite the cash flow, not the appreciation.
- At projected returns (5.9% appreciation + 3.0% rent growth), your $25k cash investment doubles in ~3 years — after that, you're playing with house money.
- By year 6, paydown + projected appreciation supports a ~$32k cash-out refi (75% LTV) — recoverable capital for the next deal without selling this one.
Negotiation context
- It's been on market 101 days — a 9% lower offer ($82k) is reasonable based on typical stale-listing flexibility.
- 3 sale attempts since 4y ago with the ask held roughly flat each time — persistent listings suggest the price (not the market) is what's stuck; bring a comps-based counter.
Risks & watch-outs
- Climate carrying-cost: extreme-heat days projected 7→20/yr by 2055 (HVAC capex compounding) — expect insurance premiums to compound above CPI over the hold.
Questions for the listing agent
- It's been on market 101 days. Have you received any prior offers? Is the seller open to a 9% concession, seller financing, or rate buy-down credit?
- Have any recent inspections been done? Can we get a copy of the seller's disclosures and any deferred-maintenance estimates?
- Why hasn't it sold? Are there any deal-killer items the seller is aware of (foundation, flood, title, zoning, code violations)?
- Is there a deadline driving the sale (1031 exchange, divorce, estate, relocation)? That informs how much negotiation room exists.
- Schools are F-rated, which usually means shorter tenancies and higher turnover. Who's the typical renter profile here, and what's been the actual vacancy rate?
- Crime grade is F in this area — have there been break-ins, vandalism, or insurance claims at this property in the last 3 years? What carrier currently insures it and at what premium?
- What's the average days-on-market for RENTAL listings here right now (not sales)? A rising rental-DOM trend means longer vacancies and softer asking-rent achievability than the comps imply.
- What's the recent tenant-quality profile in this submarket — average credit score on applications, eviction rate, late-payment / NSF rate, and stable-employment percentage? A property-management company in the area should have these aggregated.
- How much new for-sale + rental construction is in the pipeline within 1–3 miles? Heavy new supply typically softens prices + rents 12–24 months out; constrained supply supports both.
Investment metrics
- 1% rule
- 1.29% ✓
- Cap rate
- 10.26%
- Cash-on-cash
- 14.15%
- DSCR
- 1.63
- GRM
- 6.4
CMA / ARV
- ARV (on-the-fly)
- $443,900
- Comps found
- 1
Show comp detail 1 sale within ~0.75 mi
| Address | Dist | Beds/Ba | Sqft | Sold | Price | $/sf | Match |
|---|---|---|---|---|---|---|---|
| 1797 Wayne CR 341 | 0.18mi | 4/2.5 (+1) | 2,069 (-10%) | 20mo | $399,500 | $193 | 49 |
Match score weights: distance 35% · size 25% · config 20% · recency 20%. Top-matched comps best support the ARV.
Projected returns pro-forma
5.89% appreciation · 3.0% rent growth · sell at horizon
- IRR
- 26.9%
- Equity multiple
- 2.76×
- Total profit
- $44,314
- Equity at exit
- $55,912
- IRR
- 25.3%
- Equity multiple
- 5.60×
- Total profit
- $115,728
- Equity at exit
- $100,877
Cash invested: $25,172 (down + closing). Projections, not guarantees.
Landlord ↔ Tenant lean methodology
- Overall (STATE)
- 81 Strongly Landlord-Friendly
- State Missouri
- 81 Strongly Landlord-Friendly · R+10
- County
- — inherits STATE
- City
- — inherits STATE
ZIP-level market 63957
- Home prices YoY
- 3.7%
- Active inventory
- 70
- Price-to-rent
- 6.4×
Monthly cashflow live
- Estimated rent
- $1,162 medium interval (Pro) →
- Mortgage (P&I)
- −$471
- Tax est. 1.5%
- −$112 /mo · $1,348/yr
- Insurance
- −$37
- HOA
- −$0
- Lot rent
- −$0
- Vacancy / Maint / Mgmt
- −$244
- Net cashflow
- $297
Break-even live
Sensitivity live
| Price | -10% $359 | -5% $328 | +0% $297 | +5% $266 | +10% $235 |
|---|---|---|---|---|---|
| Rent | -10% $205 | -5% $251 | +0% $297 | +5% $343 | +10% $389 |
| Rate | -1.0pp $342 | -0.5pp $320 | base $297 | +0.5pp $274 | +1.0pp $250 |
UW: 25.0% down · 7.5% · 30yr · 1.5% tax · 5.0% vac · 8.0% maint · 8.0% mgmt
Financing live
Cash to close
- Down payment
- $22,475
- Closing costs
- $2,697
- Reserves months
- —
- Total cash needed
- —
Loan-product check · same deal, 3 products live
Conventional
25% down · 7.5% · 30yr
- Down + closing
- —
- Monthly P&I
- —
- Monthly cashflow
- —
- DSCR
- —
- Eligible?
- —
Personal DTI + credit; lowest rate.
DSCR
20% down · 8.5% · 30yr
- Down + closing
- —
- Monthly P&I
- —
- Monthly cashflow
- —
- DSCR
- —
- Eligible?
- —
No personal income docs; deal must DSCR.
Hard money
10% down · 12.0% · 12mo
- Down + closing
- —
- Monthly P&I
- —
- Monthly cashflow
- —
- DSCR
- —
- Eligible?
- —
Short-term bridge; refi at stabilization.
Listing history 24 events
-
2026-06-22days on market $89,900 Active 101 DOM
-
2026-06-21days on market $89,900 Active 100 DOM
-
2026-06-21days on market $89,900 Active 99 DOM
-
2026-06-18days on market $89,900 Active 97 DOM
-
2026-06-17days on market $89,900 Active 96 DOM
-
2026-06-16days on market $89,900 Active 95 DOM
-
2026-06-15days on market $89,900 Active 94 DOM
-
2026-06-13days on market $89,900 Active 92 DOM
-
2026-06-12days on market $89,900 Active 91 DOM
-
2026-06-09days on market $89,900 Active 88 DOM
-
2026-06-08days on market $89,900 Active 87 DOM
-
2026-06-07days on market $89,900 Active 86 DOM
-
2026-06-07days on market $89,900 Active 85 DOM
-
2026-06-04days on market $89,900 Active 82 DOM
-
2026-06-02days on market $89,900 Active 81 DOM
-
2026-06-01days on market $89,900 Active 80 DOM
-
2026-05-31days on market $89,900 Active 79 DOM
-
2026-03-13$89,900 Active 511-char remark
Show marketing remark (511 chars)
Nice location on dead end lane, just outside of town but near the golf course and Lon Sanders Canyon. Manufactured home with add on sitting on 4.19 acres m/l. Home has living room, family room, kitchen, dining room, 3-bedrooms and 1-3/4-bath. Home has a new roof, is vinyl sided with an attached carport/patio area. Detached garage and workshop with an add on. Lots of unfinished projects and remodeling has been started. Bring your creativity and elbow grease and make this house into your next country home.
-
2025-03-01historical
-
2024-09-13price $80,000
-
2024-06-28$100,000 Active
-
2023-01-03historical
-
2022-06-17price $120,000
-
2022-05-31$150,000 Active
ⓘ Source: listings_history table (triggers on properties + properties_extension) + one-shot
backfill from property_details.listing_events for pre-trigger history.
Climate risk First Street
- Flood 1/10 Low FEMA zone X (unshaded) · 0% chance over 30 yrs
- Wildfire 4/10 Moderate
- Heat 5/10 Major 7 d/yr ≥107°F today · 20 d/yr by 30 yrs out
- Wind 2/10 Low 3% chance of damaging wind over 30 yrs
- Air quality 1/10 Low 0 unhealthy d/yr today · 0 by 30 yrs out
Nearby sold comps map
Loading sold comps map…
Walkable amenities ~0.75 mi
Loading nearby amenities…
Taxation est. · year 1
- Rental income
- $13,946
- − Mortgage interest
- −$5,036
- − Property taxes
- −$1,348
- − Insurance
- −$450
- − Repairs & maintenance
- −$1,116
- − Management
- −$1,116
- − Depreciation
- −$2,615
- Taxable income
- $2,266
- Est. tax owed @ 24.0%
- −$544
- After-tax cash flow
- $3,018/yr
For passive investors: Depreciation is non-cash, so a rental often shows a tax loss while cash-flowing — sheltering income. Rental losses are passive: they offset passive income freely, and up to $25,000/yr can offset ordinary (W-2) income if you actively participate and your MAGI is under $100k (phasing out to $0 by $150k); unused losses carry forward. On sale, claimed depreciation is recaptured at up to 25%, and gains may owe capital-gains tax (a 1031 exchange can defer both). Figures are a year-1 estimate at your 24.0% rate — not tax advice; consult a CPA.
Condition & rehab AI · 12 photos
This property requires extensive repairs and renovations to bring it up to a livable condition. Significant work is needed on the roof, exterior siding, flooring, interior walls, kitchen, bathrooms, and systems. The property has potential for substantial value increase with proper renovations.
Repairs flagged
- Major roof — Exposed framing, missing shingles
- Major exterior siding — Weathered siding, missing shingles
- Major flooring — Exposed subflooring, missing flooring
- Major interior walls — Exposed framing, missing drywall
- Major kitchen cabinets — Exposed cabinets, missing countertops
- Major bathrooms — Exposed framing, missing drywall
- Major systems — Exposed plumbing, electrical wiring visible
Value-add opportunities
- Both New roof and siding — Improves both resale and rental value
- Both New flooring and interior walls — Improves both resale and rental value
- Both New kitchen cabinets and countertops — Improves both resale and rental value
- Both New bathrooms with fixtures — Improves both resale and rental value
- Both New HVAC system — Improves both resale and rental value
Renovation cost estimate screening
| Repair item | Severity | Est. cost |
|---|---|---|
| roof · Exposed framing, missing shingles | Major | $15,000–50,000 |
| exterior siding · Weathered siding, missing shingles | Major | $15,000–50,000 |
| flooring · Exposed subflooring, missing flooring | Major | $15,000–50,000 |
| interior walls · Exposed framing, missing drywall | Major | $15,000–50,000 |
| kitchen cabinets · Exposed cabinets, missing countertops | Major | $15,000–50,000 |
| bathrooms · Exposed framing, missing drywall | Major | $15,000–50,000 |
| systems · Exposed plumbing, electrical wiring visible | Major | $15,000–50,000 |
| Total estimated repair cost · 7 items | $105,000–350,000 |
Value-add ROI direction
- Both New roof and siding — Improves both resale and rental value ↑
- Both New flooring and interior walls — Improves both resale and rental value ↑
- Both New kitchen cabinets and countertops — Improves both resale and rental value ↑
- Both New bathrooms with fixtures — Improves both resale and rental value ↑
- Both New HVAC system — Improves both resale and rental value ↑
ⓘ Cost ranges are severity-bucket heuristics (US national rule-of-thumb). Get contractor quotes + a written scope before underwriting a rehab budget.
Schools (NCES district)
- District
- Clearwater R-I
- NCES district ID
- 2909750
- Math proficiency
- 33% ▲ 1.00%
- Reading proficiency
- 33% ▼ -6.00%
- Median HH income
- $31,119
- Composite
- 26.89/100
- National rank
- #7095
- State rank
- #255 of 324 in MO
Livability — Piedmont
- Score
- 52/100
- State rank
- #854
- US rank
- #24925
Category grades
Schools grade is shown separately in the Schools card above.
Census & demographics
- Population (ZIP)
- 5,068
Population outlook (Wayne County) Hauer SSP2
- Today (2025)
- 13,005 people
- By 2030
- 12,767 · -1.8%
- By 2040
- 12,319 · -5.3%
- By 2050
- 11,828 · -9.1%
- By 2075
- 10,806 · -16.9%
- By 2100
- 9,610 · -26.1%
Race, ethnicity, and origin ACS 2023
- Neighborhood character
- Predominantly White (96%)
- Race & ethnicity
- White 96% Two or more races 3%
- Common ancestry
- Italian 2% Slovak 2% Lithuanian 1%
- Foreign-born
- 0%
Political lean MEDSL · Wayne
- 2024 margin
- Solid R (+72.6) · D 13.4% · R 86.0%
- 2008→2024 swing
- -47.6pp toward R · 2008: -25.0pp · 2024: -72.6pp
- All cycles
- 2024: R+72.6 2020: R+70.5 2016: R+64.4 2012: R+34.6 2008: R+25.0
Not yet ingested
- Civics
- —
Market trends
- HPI YoY
- ▲ 5.89%
- Current HPI
- 165.6832
- Rent YoY
- —
- Metro
- —
- State GDP YoY
- ▲ 1.84%
- F500 in state
- 20
Industry mix (Fortune 500 HQ in MO)
| Industry | F500 HQs | Revenue |
|---|---|---|
| Healthcare | 1 | $163B |
|
||
| Insurance | 1 | $21B |
|
||
| Industrial Technology | 1 | $17B |
|
||
| Retail | 1 | $16B |
|
||
| Industrial Distribution | 1 | $10B |
|
||
| Utilities | 1 | $9B |
|
||
Price history
-40.1% since first listed7 events — show timeline
- 2026-03-13 Listed $89,900 MARIS as Distributed by MLS Grid
- 2025-03-01 Delisted — MARIS as Distributed by MLS Grid
- 2024-09-13 Price Changed $80,000 MARIS as Distributed by MLS Grid
- 2024-06-28 Listed $100,000 MARIS as Distributed by MLS Grid
- 2023-01-03 Delisted — MARIS as Distributed by MLS Grid
- 2022-06-17 Price Changed $120,000 MARIS as Distributed by MLS Grid
- 2022-05-31 Listed $150,000 MARIS as Distributed by MLS Grid
Cash-flow waterfall
monthlySold comps — $/sqft
last 12 mo · ≤1 miLoading sold comps…