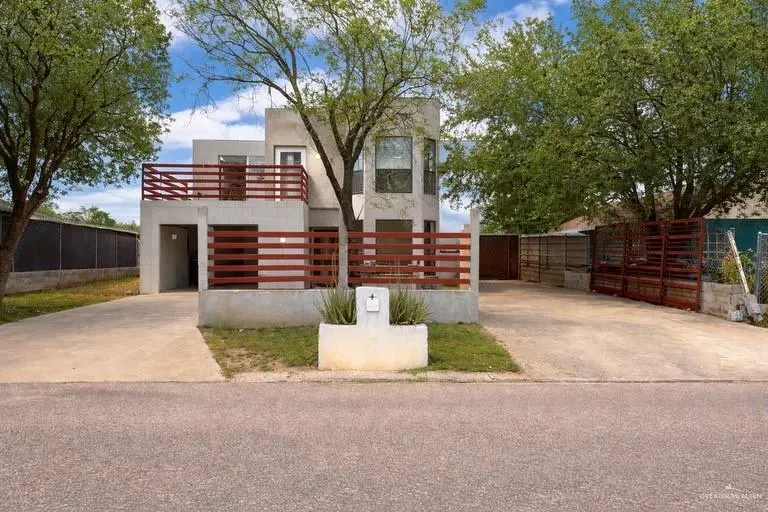
7300 Ciruelos St · Perezville, TX
Flood risk 7/10 · Major
- FEMA flood zone
- X
- Chance of flooding over 30 yrs
- 0.99%
- Est. flood insurance / yr
- $507 – $1,088
Fire risk 8/10 · Major
- Est. fire insurance / yr
- $1,222 – $2,270
Heat risk 9/10 · Severe
- Hot days now (above 112°F)
- 7 days/yr
- Hot days in 30 yrs
- 23 days/yr
Wind risk 8/10 · Major
- Chance of severe wind over 30 yrs
- 94.0%
Air-quality risk 1/10 · Minimal
- Unhealthy air days now
- 0 days/yr
- Unhealthy air days in 30 yrs
- 0 days/yr
Risk factors via First Street. Map © Google.
Why this score? — see what drove the B- grade
The composite is a weighted blend of 9 inputs, each scored 0–100. Each bar is that input's sub-score; the figure is the points it added to the 100-point composite (weight × sub-score).
- Cash flow +28.2/30.0
- DSCR +10.0/10.0
- 1% rule +9.7/10.0
- ARV discount +7.5/15.0
- Livability +3.2/5.0
- Rent growth +2.7/5.0
- Condition / age +2.5/5.0
- Schools +1.9/10.0
- Appreciation +0.0/10.0
$95,000
🖨 Deal sheet (PDF) 📄 Offer letter ✓ Due diligence
Listing remarks
Investor Special! Bring Your Vision. Solid block construction, 2 story, 6 bed/3 bath home in Palmview offering 3,217 sqft of potential on a 60x100 lot. Built in 2003 on a slab foundation with a 2 car carport, split bedroom layout, and walk in closets. Property is being sold as-is, interior is unfinished and ready for a full custom build out. The shell is structurally sound and ready for the right investor to finish and flip or hold. At $95,000, that's just $29/sqft, well below the Hidalgo CAD appraised value of $174,403.
Key facts
- 5,998 sq ft lot
- 2 parking spots
- Built 2003
Property features AI
Finance
- Financial info: Escrow amount listed (900)
- HOA & community: No homeowners association
Exterior
- Parking: 2 total parking spaces; 2 covered spaces; 2-car carport (attached)
- Utilities: Public water; City sewer
- Home design: Single-family property (per lot/area data); Entry level information not provided; Facing direction not provided
- Construction: Slab foundation; Construction materials: Other; Roof: Other; Building area approximately 3,217 (units recorded)
- Exterior features: Fencing: Other; Paved road access
Interior
- Kitchen: Water heater (other); No conveying appliances
- Bedrooms: Bedrooms arranged with split layout
- Flooring: Tile; Other flooring
- Bathrooms: 3 full bathrooms
- Interior features: Split bedroom floor plan; Walk-in closet(s); Countertops: Other; No window coverings
- Laundry & utility: Laundry area
Neighborhood map
What this means for you Summary
Snapshot
- This is a 3-bed/2.0-bath single-family listed at $95k.
Deal economics
- At list price, monthly cash flow is $236 ($3k/yr) — positive.
- The deal already cash-flows at list — no discount required.
- Meets the 1% rule at list price ($1k rent vs $95k).
- Recommended offer: $92k (3.0% below list) — sets the bar for market timing.
- Cap rate 10.1% vs local median 6.9% in Perezville — top-decile yield for the area; either an underpriced asset or a hidden risk that comps aren't pricing in. Stress-test before assuming the spread holds.
Location & tenants
- Location reads 64/100 on livability (#743 in TX) — a middle-class / working-renter tenant base. Strengths: cost of living A+, housing A+, crime A-; Watch: amenities F, commute F, health & safety F.
- La Joya ISD (suburban): math 18% / reading 29% proficiency, ranked #759 of 826 in TX (top 92%) — low school quality limits family demand, transient renter base, plan for 1-2y turnover.
- Zoned schools: Evangelina Garza El (math 13% / reading 31%, grade F, #3,333 of 4,322 statewide, top 80%, 439 students, 98% FRL); Ann Richards Middle (math 21% / reading 30%, grade F, #1,236 of 1,662 statewide, top 76%, 729 students, 96% FRL); La Joya H S (math 16% / reading 32%, grade F, #1,333 of 1,632 statewide, top 82%, 2,775 students, 92% FRL) — zoned schools average 95% FRL vs 54% district-wide (42 pts higher); higher-poverty schools than district average — tighter screening recommended.
- Market conditions: Rents flat; 852 active listings in the ZIP; 7,378 units permitted in Hidalgo County in 2024 (641 in 5+ unit buildings).
- This rent runs 31% of the median local income ($54k/yr) — at the standard rent-burdened threshold; future hikes will face affordability resistance.
Forward outlook
- Local home prices are declining (-3.0%/yr); year-one equity from $657 of loan paydown is wiped out by about $3k of value loss. Plan a longer hold.
- Hidalgo County population projected at +28% by 2050 — long-run rental-demand tailwind backs the buy-and-hold thesis.
Negotiation context
- It's been on market 60 days — a 3% lower offer ($92k) is reasonable based on typical stale-listing flexibility.
- 5 sale attempts since 3y ago with the ask held roughly flat each time — persistent listings suggest the price (not the market) is what's stuck; bring a comps-based counter.
Risks & watch-outs
- Watch-outs: property tax is 3.4% of price; flood insurance adds $66/mo.
- Climate carrying-cost: major flood risk; severe wind risk, 94% chance of damaging wind over 30y; severe wildfire risk; extreme-heat days projected 7→23/yr by 2055 (HVAC capex compounding) — expect insurance premiums to compound above CPI over the hold.
Questions for the listing agent
- It's been on market 60 days. Have you received any prior offers? Is the seller open to a 3% concession, seller financing, or rate buy-down credit?
- Property tax is high relative to price — has the assessment been appealed recently, and will the sale trigger a re-assessment?
- What's the actual annual flood-insurance premium (NFIP or private), and is the property in a SFHA with mandatory coverage?
- Is there a deadline driving the sale (1031 exchange, divorce, estate, relocation)? That informs how much negotiation room exists.
- Schools are F-rated, which usually means shorter tenancies and higher turnover. Who's the typical renter profile here, and what's been the actual vacancy rate?
- What's the average days-on-market for RENTAL listings here right now (not sales)? A rising rental-DOM trend means longer vacancies and softer asking-rent achievability than the comps imply.
- What's the recent tenant-quality profile in this submarket — average credit score on applications, eviction rate, late-payment / NSF rate, and stable-employment percentage? A property-management company in the area should have these aggregated.
- How much new for-sale + rental construction is in the pipeline within 1–3 miles? Heavy new supply typically softens prices + rents 12–24 months out; constrained supply supports both.
Investment metrics
- 1% rule
- 1.47% ✓
- Cap rate
- 10.11%
- Cash-on-cash
- 13.62%
- DSCR
- 1.61
- GRM
- 5.7
CMA / ARV
- ARV (median comp)
- $246,046
- List price
- $95,000
- Delta
- -61.39%
- Verdict
- UNDERPRICED
- Comps
- 5 within 2.0 mi
Projected returns pro-forma
-3.0% appreciation · 0.93% rent growth · sell at horizon
- IRR
- -3.2%
- Equity multiple
- 0.88×
- Total profit
- $-3,097
- Equity at exit
- $14,165
- IRR
- 3.5%
- Equity multiple
- 1.23×
- Total profit
- $5,991
- Equity at exit
- $8,214
Cash invested: $26,600 (down + closing). Projections, not guarantees.
Landlord ↔ Tenant lean methodology
- Overall (STATE)
- 87 Strongly Landlord-Friendly
- State Texas
- 87 Strongly Landlord-Friendly · R+5
- County
- — inherits STATE
- City
- — inherits STATE
ZIP-level market 78572
- Home prices YoY
- -22.9%
- Rents YoY
- 0.9%
- Active inventory
- 852
- Price-to-rent
- 5.7×
Monthly cashflow live
- Estimated rent
- $1,400 medium interval (Pro) →
- Mortgage (P&I)
- −$498
- Tax from tax record
- −$266 /mo · $3,198/yr
- Insurance
- −$40
- Flood insurance flood zone
- −$66 /mo · $798/yr
- HOA
- −$0
- Vacancy / Maint / Mgmt
- −$294
- Net cashflow
- $236
Break-even live
Sensitivity live
| Price | -10% $289 | -5% $262 | +0% $236 | +5% $209 | +10% $182 |
|---|---|---|---|---|---|
| Rent | -10% $125 | -5% $180 | +0% $236 | +5% $291 | +10% $346 |
| Rate | -1.0pp $283 | -0.5pp $260 | base $236 | +0.5pp $211 | +1.0pp $186 |
UW: 25.0% down · 7.5% · 30yr · 1.5% tax · 5.0% vac · 8.0% maint · 8.0% mgmt
Financing live
Cash to close
- Down payment
- $23,750
- Closing costs
- $2,850
- Reserves months
- —
- Total cash needed
- —
Loan-product check · same deal, 3 products live
Conventional
25% down · 7.5% · 30yr
- Down + closing
- —
- Monthly P&I
- —
- Monthly cashflow
- —
- DSCR
- —
- Eligible?
- —
Personal DTI + credit; lowest rate.
DSCR
20% down · 8.5% · 30yr
- Down + closing
- —
- Monthly P&I
- —
- Monthly cashflow
- —
- DSCR
- —
- Eligible?
- —
No personal income docs; deal must DSCR.
Hard money
10% down · 12.0% · 12mo
- Down + closing
- —
- Monthly P&I
- —
- Monthly cashflow
- —
- DSCR
- —
- Eligible?
- —
Short-term bridge; refi at stabilization.
Listing history 30 events
-
2026-06-22days on market $95,000 Active 60 DOM
-
2026-06-18days on market $95,000 Active 57 DOM
-
2026-06-17days on market $95,000 Active 56 DOM
-
2026-06-16days on market $95,000 Active 55 DOM
-
2026-06-15days on market $95,000 Active 54 DOM
-
2026-06-14days on market $95,000 Active 52 DOM
-
2026-06-13days on market $95,000 Active 51 DOM
-
2026-06-10days on market $95,000 Active 49 DOM
-
2026-06-09days on market $95,000 Active 48 DOM
-
2026-06-08days on market $95,000 Active 47 DOM
-
2026-06-07days on market $95,000 Active 46 DOM
-
2026-06-05days on market $95,000 Active 43 DOM
-
2026-06-03days on market $95,000 Active 42 DOM
-
2026-06-02days on market $95,000 Active 41 DOM
-
2026-06-01days on market $95,000 Active 40 DOM
-
2026-05-31days on market $95,000 Active 39 DOM
-
2026-05-31days on market $95,000 Active 38 DOM
-
2026-04-22$95,000 Active 526-char remark
-
2025-04-01price $89,000
-
2025-03-21price $90,000
-
2025-03-10soldstatus
-
2024-12-20$95,000 Active
-
2024-10-17status Active
-
2024-08-20status Pending
-
2024-08-09historical Option
-
2024-04-02status Active
-
2024-03-03historical Option
-
2024-02-14price $105,000
-
2023-09-09$135,000 Active
-
2000-05-03soldstatus
ⓘ Source: listings_history table (triggers on properties + properties_extension) + one-shot
backfill from property_details.listing_events for pre-trigger history.
Tax reassessment forecast TX · Resets to sale price
- Current annual tax
- $3,198 · $266/mo
- Projected year-2 tax
- $3,198 · $266/mo
- Expected delta
- $0/yr ($0/mo · 0.0%)
ⓘ Screening estimate from a state-policy table — verify with the county assessor before closing.
Climate risk First Street
- Flood 7/10 Severe FEMA zone X · 99% chance over 30 yrs
- Wildfire 8/10 Severe
- Heat 9/10 Extreme 7 d/yr ≥112°F today · 23 d/yr by 30 yrs out
- Wind 8/10 Severe 94% chance of damaging wind over 30 yrs
- Air quality 1/10 Low 0 unhealthy d/yr today · 0 by 30 yrs out
Nearby sold comps map
Loading sold comps map…
Walkable amenities ~0.75 mi
Loading nearby amenities…
Taxation est. · year 1
- Rental income
- $16,804
- − Mortgage interest
- −$5,321
- − Property taxes
- −$3,198
- − Insurance
- −$1,272
- − Repairs & maintenance
- −$1,344
- − Management
- −$1,344
- − Depreciation
- −$2,764
- Taxable income
- $1,560
- Est. tax owed @ 24.0%
- −$374
- After-tax cash flow
- $2,452/yr
For passive investors: Depreciation is non-cash, so a rental often shows a tax loss while cash-flowing — sheltering income. Rental losses are passive: they offset passive income freely, and up to $25,000/yr can offset ordinary (W-2) income if you actively participate and your MAGI is under $100k (phasing out to $0 by $150k); unused losses carry forward. On sale, claimed depreciation is recaptured at up to 25%, and gains may owe capital-gains tax (a 1031 exchange can defer both). Figures are a year-1 estimate at your 24.0% rate — not tax advice; consult a CPA.
Schools (NCES district)
- District
- La Joya ISD
- NCES district ID
- 4826130
- Math proficiency
- 18% ▼ -35.00%
- Reading proficiency
- 29% ▼ -10.00%
- Median HH income
- $27,845
- Composite
- 18.65/100
- National rank
- #8891
- State rank
- #759 of 826 in TX
Livability — Perezville
- Score
- 64/100
- State rank
- #743
- US rank
- #13748
Category grades
Schools grade is shown separately in the Schools card above.
Census & demographics
- Census place
- Perezville, TX
- County
- Hidalgo County · 623,128 people
- Metro
- McAllen-Edinburg-Mission, TX
- Population (ZIP)
- 78,024
- Household income
- $54,298
- Rent vs Own
- Severe rent burden
- 1714.0
Population outlook (Hidalgo County) Hauer SSP2
- Today (2025)
- 955,232 people
- By 2030
- 1,009,774 · +5.7%
- By 2040
- 1,120,332 · +17.3%
- By 2050
- 1,225,036 · +28.2%
- By 2075
- 1,439,189 · +50.7%
- By 2100
- 1,533,429 · +60.5%
Race, ethnicity, and origin ACS 2023
- Neighborhood character
- Predominantly Hispanic (85%)
- Race & ethnicity
- Hispanic / Latino 85% Two or more races 47% White 12% Asian 2%
- Hispanic origin (detail)
- Mexican 80%
- Common ancestry
- Slovak 1% Portuguese 0%
- Foreign-born
- 28% · Canada, South Korea
- Languages at home
- 22% English-only · Spanish 76%
Political lean MEDSL · Hidalgo
- 2024 margin
- Toss-up / Even · D 48.1% · R 51.0%
- 2008→2024 swing
- -41.6pp toward R · 2008: 38.7pp · 2024: -2.9pp
- All cycles
- 2024: R+2.9 2020: D+17.1 2016: D+40.5 2012: D+41.8 2008: D+38.7
Not yet ingested
- Civics
- —
Market trends
- HPI YoY
- ▼ -62.35%
- Current HPI
- 209.3573
- Rent YoY
- ▲ 0.93%
- Metro
- McAllen-Edinburg-Mission, TX
- State GDP YoY
- ▲ 3.95%
- F500 in state
- 110
Industry mix (Fortune 500 HQ in TX)
| Industry | F500 HQs | Revenue |
|---|---|---|
| Energy | 16 | $1,198B |
|
||
| Technology | 5 | $198B |
|
||
| Engineering / Construction | 4 | $72B |
|
||
| Energy Services | 3 | $60B |
|
||
| Utilities | 3 | $41B |
|
||
| Healthcare | 2 | $330B |
|
||
Price history
-29.6% since first listed13 events — show timeline
- 2026-04-22 Listed $95,000 MCALLENMLS
- 2025-04-01 Price Changed $89,000 MCALLENMLS
- 2025-03-21 Price Changed $90,000 MCALLENMLS
- 2025-03-10 Sold (Public Records) — Public Records
- 2024-12-20 Listed $95,000 MCALLENMLS
- 2024-10-17 Relisted — MCALLENMLS
- 2024-08-20 Pending — MCALLENMLS
- 2024-08-09 Contingent — MCALLENMLS
- 2024-04-02 Relisted — MCALLENMLS
- 2024-03-03 Contingent — MCALLENMLS
- 2024-02-14 Price Changed $105,000 MCALLENMLS
- 2023-09-09 Listed $135,000 MCALLENMLS
- 2000-05-03 Sold (Public Records) — Public Records
Property tax history
+7.8%/yrLatest (2025): $3,198 · +7.1% YoY. Source: county tax records.
Cash-flow waterfall
monthlySold comps — $/sqft
last 12 mo · ≤1 miLoading sold comps…