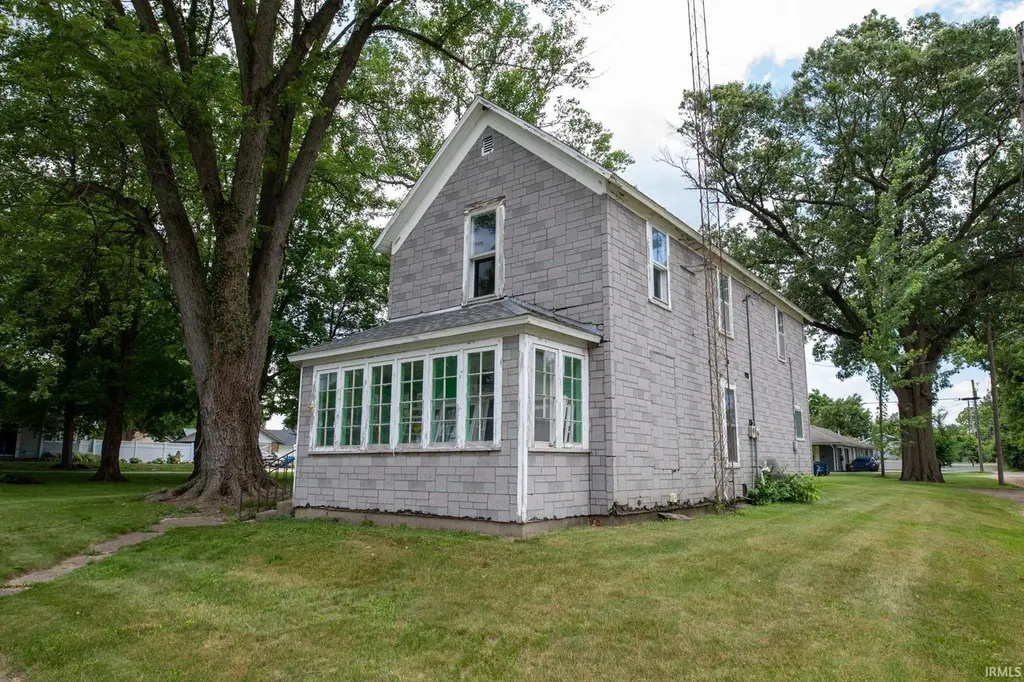
213 S Slate St · Culver, IN
Flood risk 1/10 · Minimal
- FEMA flood zone
- X (unshaded)
- Chance of flooding over 30 yrs
- 0.0%
- Est. flood insurance / yr
- $507 – $1,088
Fire risk 1/10 · Minimal
- Est. fire insurance / yr
- $717 – $1,331
Heat risk 3/10 · Minor
- Hot days now (above 100°F)
- 7 days/yr
- Hot days in 30 yrs
- 16 days/yr
Wind risk 2/10 · Minimal
- Chance of severe wind over 30 yrs
- —
Air-quality risk 3/10 · Minor
- Unhealthy air days now
- 1 days/yr
- Unhealthy air days in 30 yrs
- 3 days/yr
Risk factors via First Street. Map © Google.
Why this score? — see what drove the C- grade
The composite is a weighted blend of 9 inputs, each scored 0–100. Each bar is that input's sub-score; the figure is the points it added to the 100-point composite (weight × sub-score).
- Cash flow +16.7/30.0
- ARV discount +15.0/15.0
- DSCR +5.2/10.0
- 1% rule +4.5/10.0
- Livability +3.4/5.0
- Schools +2.6/10.0
- Rent growth +2.5/5.0
- Condition / age +2.5/5.0
- Appreciation +0.0/10.0
$150,000
🖨 Deal sheet (PDF) 📄 Offer letter ✓ Due diligence
Listing remarks MLS
2br HOME ON LARGE LOT RIGHT IN CULVER - Older 2 story home with basement. Home offers much potential. All offers must be submitted through hubzu.com auction. Please contact your agent for details.
Key facts
- Double lot
- Lake maxinkuckee
- Dream getaway
Tags
Property features AI
Exterior
- Utilities: Public water; Public sewer
- Home design: Single-family site-built home; 2 stories
- Exterior features: Lot approximately 0.34 acres; Lot dimensions about 125 x 120
Interior
- Bedrooms: Total rooms: 6
- Bathrooms: 1 full bathroom and 1 half bathroom; 2 main-level bathrooms
- Heating & cooling: Central air conditioning
- Interior features: Full basement
Neighborhood map
What this means for you Summary
Snapshot
- This is a 2-bed/1.5-bath single-family listed at $150k.
Deal economics
- At list price, monthly cash flow is $94 ($1k/yr) — positive.
- The deal already cash-flows at list — no discount required.
- To meet the 1% rule (rent ≥ 1% of price), the offer needs to be $142k (5.3% below list).
- Recommended offer: $142k (5.3% below list) — sets the bar for 1% rule.
- Cap rate 7.0% vs local median 1.9% in Culver — top-decile yield for the area; either an underpriced asset or a hidden risk that comps aren't pricing in. Stress-test before assuming the spread holds.
Location & tenants
- Location reads 67/100 on livability (#263 in IN) — a middle-class / working-renter tenant base. Strengths: crime A+, cost of living A+, health & safety B; Watch: amenities F, commute F, employment F.
- Culver Community Schools Corporation (rural): math 27% / reading 35% proficiency, ranked #236 of 301 in IN (top 78%) — families likely to look elsewhere, expect single-tenant / working-renter base with shorter leases.
- Zoned schools: Culver Elementary School (math 47% / reading 37%, grade F, #434 of 994 statewide, top 48%, 415 students, 63% FRL); Culver Community Middle/High Sch (math 18% / reading 32%, grade F, #323 of 369 statewide, top 88%, 425 students, 62% FRL) — zoned schools average 63% FRL vs 47% district-wide (15 pts higher); higher-poverty schools than district average — tighter screening recommended.
- Market conditions: 32 active listings in the ZIP; 1 comparable units currently listed for rent nearby; 147 units permitted in Marshall County in 2024 (0 in 5+ unit buildings).
Forward outlook
- Local home prices are declining (-3.0%/yr); year-one equity from $1k of loan paydown is wiped out by about $4k of value loss. Plan a longer hold.
- Marshall County population projected to shrink 9% by 2050 — rents likely to lag national; underwrite the cash flow, not the appreciation.
Negotiation context
- Only 3 days on market — expect competitive offers; lowballing is unlikely to land.
- 2 sale attempts since 11y ago with the ask held roughly flat each time — persistent listings suggest the price (not the market) is what's stuck; bring a comps-based counter.
- Current owner paid $100k; list at $150k implies a 50% gain — meaningful room to come down on a strong offer.
Risks & watch-outs
- Watch-outs: built in 1925 — expect roof / HVAC / electrical / plumbing capex.
Questions for the listing agent
- Built in 1925 — when were the roof, HVAC, electrical panel, plumbing, and water heater last replaced?
- Is there a deadline driving the sale (1031 exchange, divorce, estate, relocation)? That informs how much negotiation room exists.
- What's the average days-on-market for RENTAL listings here right now (not sales)? A rising rental-DOM trend means longer vacancies and softer asking-rent achievability than the comps imply.
- What's the recent tenant-quality profile in this submarket — average credit score on applications, eviction rate, late-payment / NSF rate, and stable-employment percentage? A property-management company in the area should have these aggregated.
- How much new for-sale + rental construction is in the pipeline within 1–3 miles? Heavy new supply typically softens prices + rents 12–24 months out; constrained supply supports both.
Investment metrics
- 1% rule
- 0.95% ✗
- Cap rate
- 7.05%
- Cash-on-cash
- 2.70%
- DSCR
- 1.12
- GRM
- 8.8
CMA / ARV
- ARV (on-the-fly)
- $271,168
- Comps found
- 10
Show comp detail 10 sales within ~0.75 mi
| Address | Dist | Beds/Ba | Sqft | Sold | Price | $/sf | Match |
|---|---|---|---|---|---|---|---|
| 422 S Main St | 0.20mi | 3/2.0 (+1) | 1,248 (+3%) | 10mo | $249,000 | $200 | 71 |
| 416 Lake St | 0.37mi | 3/1.5 (+1) | 1,232 (+1%) | 8mo | $185,000 | $150 | 69 |
| 235 Dunes Park Dr #14 | 0.36mi | 2/2.0 | 1,334 (+10%) | 0mo | $309,500 | $232 | 65 |
| 233 Dunes Park Dr #15 | 0.35mi | 2/2.0 | 1,334 (+10%) | 1mo | $299,900 | $225 | 65 |
| 223 Dunes Park Dr #20 | 0.36mi | 2/2.0 | 1,334 (+10%) | 1mo | $297,808 | $223 | 65 |
| 221 Dunes Park Dr #21 | 0.35mi | 2/2.0 | 1,334 (+10%) | 3mo | $297,500 | $223 | 63 |
| 119 W Mill St | 0.13mi | 3/1.0 (+1) | 1,042 (-14%) | 8mo | $215,000 | $206 | 57 |
| 550 W Jefferson St | 0.38mi | 2/1.0 | 1,360 (+12%) | 5mo | $235,000 | $173 | 56 |
| 606 Peru Ct | 0.41mi | 2/2.0 | 1,280 (+5%) | 17mo | $1,725,000 | $1,348 | 56 |
| 458 N Lake St | 0.43mi | 2/1.0 | 1,240 (+2%) | 23mo | $219,000 | $177 | 56 |
Match score weights: distance 35% · size 25% · config 20% · recency 20%. Top-matched comps best support the ARV.
Projected returns pro-forma
-3.0% appreciation · 3.0% rent growth · sell at horizon
- IRR
- -12.0%
- Equity multiple
- 0.56×
- Total profit
- $-18,274
- Equity at exit
- $22,365
- IRR
- -2.9%
- Equity multiple
- 0.81×
- Total profit
- $-8,102
- Equity at exit
- $12,969
Cash invested: $42,000 (down + closing). Projections, not guarantees.
Landlord ↔ Tenant lean methodology
- Overall (STATE)
- 90 Strongly Landlord-Friendly
- State Indiana
- 90 Strongly Landlord-Friendly · R+11
- County
- — inherits STATE
- City
- — inherits STATE
ZIP-level market 46511
- Home prices YoY
- -33.2%
- Active inventory
- 32
- Price-to-rent
- 8.8×
Monthly cashflow live
- Estimated rent
- $1,420 medium interval (Pro) →
- Mortgage (P&I)
- −$787
- Tax from tax record
- −$178 /mo · $2,139/yr
- Insurance
- −$62
- HOA
- −$0
- Lot rent
- −$0
- Vacancy / Maint / Mgmt
- −$298
- Net cashflow
- $94
Break-even live
Sensitivity live
| Price | -10% $179 | -5% $137 | +0% $94 | +5% $52 | +10% $10 |
|---|---|---|---|---|---|
| Rent | -10% $-18 | -5% $38 | +0% $94 | +5% $151 | +10% $207 |
| Rate | -1.0pp $170 | -0.5pp $133 | base $94 | +0.5pp $56 | +1.0pp $16 |
UW: 25.0% down · 7.5% · 30yr · 1.5% tax · 5.0% vac · 8.0% maint · 8.0% mgmt
Financing live
Cash to close
- Down payment
- $37,500
- Closing costs
- $4,500
- Reserves months
- —
- Total cash needed
- —
Loan-product check · same deal, 3 products live
Conventional
25% down · 7.5% · 30yr
- Down + closing
- —
- Monthly P&I
- —
- Monthly cashflow
- —
- DSCR
- —
- Eligible?
- —
Personal DTI + credit; lowest rate.
DSCR
20% down · 8.5% · 30yr
- Down + closing
- —
- Monthly P&I
- —
- Monthly cashflow
- —
- DSCR
- —
- Eligible?
- —
No personal income docs; deal must DSCR.
Hard money
10% down · 12.0% · 12mo
- Down + closing
- —
- Monthly P&I
- —
- Monthly cashflow
- —
- DSCR
- —
- Eligible?
- —
Short-term bridge; refi at stabilization.
Rent comps 1 comps
| Address | Beds | Baths | Sqft | Rent | $/sqft | DOM | Units | Dist |
|---|---|---|---|---|---|---|---|---|
| 201 Tampa St Culver, IN | 1.0–3.0 | 1.0–2.0 | 1031 | $1,420 | $1.38 | 16d | 1 | 0.41mi |
Listing history 3 events
-
2026-06-22days on market $150,000 Active 3 DOM
-
2026-06-21remarks 606-char remark
-
2026-06-21$150,000 Active 2 DOM
ⓘ Source: listings_history table (triggers on properties + properties_extension) + one-shot
backfill from property_details.listing_events for pre-trigger history.
Tax reassessment forecast IN · Partial reset (capped growth)
- Current annual tax
- $2,139 · $178/mo
- Projected year-2 tax
- $2,139 · $178/mo
- Expected delta
- $0/yr ($0/mo · 0.0%)
ⓘ Screening estimate from a state-policy table — verify with the county assessor before closing.
Climate risk First Street
- Flood 1/10 Low FEMA zone X (unshaded) · 0% chance over 30 yrs
- Wildfire 1/10 Low
- Heat 3/10 Moderate 7 d/yr ≥100°F today · 16 d/yr by 30 yrs out
- Wind 2/10 Low
- Air quality 3/10 Moderate 1 unhealthy d/yr today · 3 by 30 yrs out
Nearby sold comps map
Loading sold comps map…
Walkable amenities ~0.75 mi
Loading nearby amenities…
Taxation est. · year 1
- Rental income
- $17,040
- − Mortgage interest
- −$8,402
- − Property taxes
- −$2,139
- − Insurance
- −$750
- − Repairs & maintenance
- −$1,363
- − Management
- −$1,363
- − Depreciation
- −$4,364
- Taxable loss
- −$1,341
- Est. tax savings @ 24.0%
- +$322
- After-tax cash flow
- $1,455/yr
For passive investors: Depreciation is non-cash, so a rental often shows a tax loss while cash-flowing — sheltering income. Rental losses are passive: they offset passive income freely, and up to $25,000/yr can offset ordinary (W-2) income if you actively participate and your MAGI is under $100k (phasing out to $0 by $150k); unused losses carry forward. On sale, claimed depreciation is recaptured at up to 25%, and gains may owe capital-gains tax (a 1031 exchange can defer both). Figures are a year-1 estimate at your 24.0% rate — not tax advice; consult a CPA.
Schools (NCES district)
- District
- Culver Community Schools Corporation
- NCES district ID
- 1802520
- Math proficiency
- 27% ▼ -9.00%
- Reading proficiency
- 35% ▼ -5.00%
- Median HH income
- $43,718
- Composite
- 26.41/100
- National rank
- #7227
- State rank
- #236 of 301 in IN
Livability — Culver
- Score
- 67/100
- State rank
- #263
- US rank
- #11038
Category grades
Schools grade is shown separately in the Schools card above.
Census & demographics
- Census place
- Culver, IN
- Population (ZIP)
- 4,019
Population outlook (Marshall County) Hauer SSP2
- Today (2025)
- 46,402 people
- By 2030
- 45,775 · -1.4%
- By 2040
- 44,220 · -4.7%
- By 2050
- 42,329 · -8.8%
- By 2075
- 38,235 · -17.6%
- By 2100
- 33,285 · -28.3%
Race, ethnicity, and origin ACS 2023
- Neighborhood character
- Predominantly White (93%)
- Race & ethnicity
- White 93% Two or more races 4% Black 1% Hispanic / Latino 1%
- Common ancestry
- Romanian 4% Italian 4% Danish 2%
- Foreign-born
- 3% · Canada
- Languages at home
- 97% English-only · Spanish 1% German/W. Germanic 1%
Political lean MEDSL · Marshall
- 2024 margin
- Solid R (+43.4) · D 27.4% · R 70.8% · Other 1.8%
- 2008→2024 swing
- -29.8pp toward R · 2008: -13.6pp · 2024: -43.4pp
- All cycles
- 2024: R+43.4 2020: R+40.8 2016: R+41.6 2012: R+28.9 2008: R+13.6
Not yet ingested
- Civics
- —
Market trends
- HPI YoY
- ▼ -146.01%
- Current HPI
- 293.2371
- Rent YoY
- —
- Metro
- —
- State GDP YoY
- ▲ 2.90%
- F500 in state
- 18
Industry mix (Fortune 500 HQ in IN)
| Industry | F500 HQs | Revenue |
|---|---|---|
| Industrial Machinery | 2 | $37B |
|
||
| Healthcare | 1 | $177B |
|
||
| Pharmaceuticals | 1 | $45B |
|
||
| Metals / Steel | 1 | $18B |
|
||
| Agriculture | 1 | $17B |
|
||
| Packaging | 1 | $12B |
|
||
Price history
+194.8% since first listed5 events — show timeline
- 2026-06-19 Listed $150,000 IRMLS
- 2020-09-17 Sold (Public Records) $100,000 Public Records
- 2015-06-29 Sold (MLS) $51,504 IRMLS
- 2015-05-22 Sold (Public Records) $76,000 Public Records
- 2015-04-07 Listed $50,880 IRMLS
Property tax history
+7.3%/yrLatest (2025): $2,139 · +160.6% YoY. Source: county tax records.
Cash-flow waterfall
monthlySold comps — $/sqft
last 12 mo · ≤1 miLoading sold comps…