2363 Piper Dr · Richfield, MI
Flood risk 1/10 · Minimal
- FEMA flood zone
- X (unshaded)
- Chance of flooding over 30 yrs
- 0.0%
- Est. flood insurance / yr
- $473 – $860
Fire risk 6/10 · Moderate
- Est. fire insurance / yr
- $784 – $1,456
Heat risk 1/10 · Minimal
- Hot days now (above 93°F)
- 7 days/yr
- Hot days in 30 yrs
- 13 days/yr
Wind risk 1/10 · Minimal
- Chance of severe wind over 30 yrs
- —
Air-quality risk 2/10 · Minimal
- Unhealthy air days now
- 0 days/yr
- Unhealthy air days in 30 yrs
- 1 days/yr
Risk factors via First Street. Map © Google.
Why this score? — see what drove the B- grade
The composite is a weighted blend of 9 inputs, each scored 0–100. Each bar is that input's sub-score; the figure is the points it added to the 100-point composite (weight × sub-score).
- Cash flow +30.0/30.0
- DSCR +10.0/10.0
- 1% rule +9.7/10.0
- ARV discount +7.5/15.0
- Schools +3.1/10.0
- Rent growth +2.5/5.0
- Livability +2.5/5.0
- Condition / age +2.5/5.0
- Appreciation +0.0/10.0
$70,000
🖨 Deal sheet (PDF) 📄 Offer letter ✓ Due diligence
Listing remarks MLS
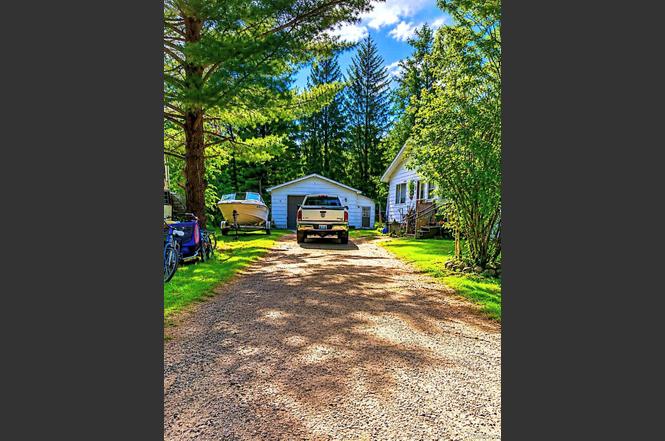
Great up north property with LOTS of potential! All appliances stay, 3 bedroom and 1 bath. Large outbuilding with a wood stove inside. Great home, or perfect for a country get away! The detached garage/barn is 41.5x 20. All information is estimated, buyer and buyers agent to verify. Within 3 minutes to Downtown St. Helens and near the St. Helens ORV Trails. 5 minutes from I-75.
Key facts
- Wood stove
- Near orv trails
- Detached garage
Tags
Neighborhood map
What this means for you Summary
Snapshot
- This is a 3-bed/1.0-bath manufactured listed at $70k.
Deal economics
- At list price, monthly cash flow is $303 ($4k/yr) — positive.
- The deal already cash-flows at list — no discount required.
- Meets the 1% rule at list price ($1k rent vs $70k).
Location & tenants
- Location reads: area grade B — affects rentability + tenant quality, not the cash-flow math above.
- Roscommon Area Public Schools (rural): math 30% / reading 44% proficiency, ranked #270 of 540 in MI (top 50%) — families likely to look elsewhere, expect single-tenant / working-renter base with shorter leases.
- Zoned schools: Roscommon Elementary School (math 34% / reading 24%, grade F, #866 of 1,397 statewide, top 65%, 266 students, 58% FRL); Roscommon Middle School (math 26% / reading 40%, grade F, #306 of 493 statewide, top 63%, 192 students, 55% FRL); Roscommon High School (math 32% / reading 57%, grade F, #214 of 713 statewide, top 36%, 363 students, 51% FRL) — zoned schools at 55% FRL track the district average.
- Market conditions: 76 active listings in the ZIP; 73 units permitted in Roscommon County in 2024 (0 in 5+ unit buildings).
Forward outlook
- Local home prices are declining (-3.0%/yr); year-one equity from $484 of loan paydown is wiped out by about $2k of value loss. Plan a longer hold.
- Roscommon County population projected at -21% by 2050 — secular population decline; favor cash flow + early exit over multi-decade hold.
- At projected returns (-3.0% appreciation + 3.0% rent growth), your $20k cash investment doubles in ~7 years — after that, you're playing with house money.
Negotiation context
- Only 10 days on market — expect competitive offers; lowballing is unlikely to land.
- 6 sale attempts since 5y ago with the ask held roughly flat each time — persistent listings suggest the price (not the market) is what's stuck; bring a comps-based counter.
- Current owner paid $35k; list at $70k implies a 100% gain — meaningful room to come down on a strong offer.
Risks & watch-outs
- Climate carrying-cost: major wildfire risk — expect insurance premiums to compound above CPI over the hold.
Questions for the listing agent
- Is there a deadline driving the sale (1031 exchange, divorce, estate, relocation)? That informs how much negotiation room exists.
- What's the average days-on-market for RENTAL listings here right now (not sales)? A rising rental-DOM trend means longer vacancies and softer asking-rent achievability than the comps imply.
- What's the recent tenant-quality profile in this submarket — average credit score on applications, eviction rate, late-payment / NSF rate, and stable-employment percentage? A property-management company in the area should have these aggregated.
- How much new for-sale + rental construction is in the pipeline within 1–3 miles? Heavy new supply typically softens prices + rents 12–24 months out; constrained supply supports both.
Investment metrics
- 1% rule
- 1.47% ✓
- Cap rate
- 11.49%
- Cash-on-cash
- 18.57%
- DSCR
- 1.83
- GRM
- 5.7
CMA / ARV
No comps found within radius.
Projected returns pro-forma
-3.0% appreciation · 3.0% rent growth · sell at horizon
- IRR
- 10.3%
- Equity multiple
- 1.41×
- Total profit
- $8,003
- Equity at exit
- $10,437
- IRR
- 19.4%
- Equity multiple
- 2.63×
- Total profit
- $31,970
- Equity at exit
- $6,052
Cash invested: $19,600 (down + closing). Projections, not guarantees.
Landlord ↔ Tenant lean methodology
- Overall (STATE)
- 62 Landlord-Friendly
- State Michigan
- 62 Landlord-Friendly · EVEN
- County
- — inherits STATE
- City
- — inherits STATE
ZIP-level market 48656
- Home prices YoY
- -8.6%
- Active inventory
- 76
- Price-to-rent
- 5.7×
Monthly cashflow live
- Estimated rent
- $1,031 medium interval (Pro) →
- Mortgage (P&I)
- −$367
- Tax from tax record
- −$115 /mo · $1,384/yr
- Insurance
- −$29
- HOA
- −$0
- Vacancy / Maint / Mgmt
- −$217
- Net cashflow
- $303
Break-even live
Sensitivity live
| Price | -10% $343 | -5% $323 | +0% $303 | +5% $283 | +10% $264 |
|---|---|---|---|---|---|
| Rent | -10% $222 | -5% $262 | +0% $303 | +5% $344 | +10% $385 |
| Rate | -1.0pp $338 | -0.5pp $321 | base $303 | +0.5pp $285 | +1.0pp $267 |
UW: 25.0% down · 7.5% · 30yr · 1.5% tax · 5.0% vac · 8.0% maint · 8.0% mgmt
Financing live
Cash to close
- Down payment
- $17,500
- Closing costs
- $2,100
- Reserves months
- —
- Total cash needed
- —
Loan-product check · same deal, 3 products live
Conventional
25% down · 7.5% · 30yr
- Down + closing
- —
- Monthly P&I
- —
- Monthly cashflow
- —
- DSCR
- —
- Eligible?
- —
Personal DTI + credit; lowest rate.
DSCR
20% down · 8.5% · 30yr
- Down + closing
- —
- Monthly P&I
- —
- Monthly cashflow
- —
- DSCR
- —
- Eligible?
- —
No personal income docs; deal must DSCR.
Hard money
10% down · 12.0% · 12mo
- Down + closing
- —
- Monthly P&I
- —
- Monthly cashflow
- —
- DSCR
- —
- Eligible?
- —
Short-term bridge; refi at stabilization.
Listing history 10 events
-
2026-06-22days on market $70,000 Active 10 DOM
-
2026-06-21days on market $70,000 Active 9 DOM
-
2026-06-21pricedays on market $70,000 Active 8 DOM
-
2026-06-18days on market $75,000 Active 6 DOM
-
2026-06-17days on market $75,000 Active 5 DOM
-
2026-06-16days on market $75,000 Active 4 DOM
-
2026-06-15days on market $75,000 Active 3 DOM
-
2026-06-12price $75,000 Active 1 DOM
-
2026-06-09remarks 635-char remark
-
2026-06-09$69,000 Active 1 DOM
ⓘ Source: listings_history table (triggers on properties + properties_extension) + one-shot
backfill from property_details.listing_events for pre-trigger history.
Tax reassessment forecast MI · Partial reset (capped growth)
- Current annual tax
- $1,384 · $115/mo
- Projected year-2 tax
- $1,384 · $115/mo
- Expected delta
- $0/yr ($0/mo · 0.0%)
ⓘ Screening estimate from a state-policy table — verify with the county assessor before closing.
Climate risk First Street
- Flood 1/10 Low FEMA zone X (unshaded) · 0% chance over 30 yrs
- Wildfire 6/10 Major
- Heat 1/10 Low 7 d/yr ≥93°F today · 13 d/yr by 30 yrs out
- Wind 1/10 Low
- Air quality 2/10 Low 0 unhealthy d/yr today · 1 by 30 yrs out
Nearby sold comps map
Loading sold comps map…
Walkable amenities ~0.75 mi
Loading nearby amenities…
Taxation est. · year 1
- Rental income
- $12,377
- − Mortgage interest
- −$3,921
- − Property taxes
- −$1,384
- − Insurance
- −$350
- − Repairs & maintenance
- −$990
- − Management
- −$990
- − Depreciation
- −$2,036
- Taxable income
- $2,705
- Est. tax owed @ 24.0%
- −$649
- After-tax cash flow
- $2,990/yr
For passive investors: Depreciation is non-cash, so a rental often shows a tax loss while cash-flowing — sheltering income. Rental losses are passive: they offset passive income freely, and up to $25,000/yr can offset ordinary (W-2) income if you actively participate and your MAGI is under $100k (phasing out to $0 by $150k); unused losses carry forward. On sale, claimed depreciation is recaptured at up to 25%, and gains may owe capital-gains tax (a 1031 exchange can defer both). Figures are a year-1 estimate at your 24.0% rate — not tax advice; consult a CPA.
Schools (NCES district)
- District
- Roscommon Area Public Schools
- NCES district ID
- 2615830
- Math proficiency
- 30% ▼ -11.00%
- Reading proficiency
- 44% ▼ -2.00%
- Median HH income
- $36,914
- Composite
- 30.7/100
- National rank
- #6172
- State rank
- #270 of 540 in MI
Livability — Richfield
No livability data for this city. (Only ~50 U.S. cities are tracked.)
Census & demographics
- Census place
- St. Helen, MI
- Population (ZIP)
- 3,872
Population outlook (Roscommon County) Hauer SSP2
- Today (2025)
- 22,249 people
- By 2030
- 21,206 · -4.7%
- By 2040
- 19,070 · -14.3%
- By 2050
- 17,564 · -21.1%
- By 2075
- 15,420 · -30.7%
- By 2100
- 13,168 · -40.8%
Race, ethnicity, and origin ACS 2023
- Neighborhood character
- Predominantly White (91%)
- Race & ethnicity
- White 91% Two or more races 4% Hispanic / Latino 2% Black 1% Asian 1%
- Common ancestry
- Lithuanian 7% Romanian 7% Slovak 3%
- Foreign-born
- 2% · China
- Languages at home
- 97% English-only · Spanish 1% Chinese 1% German/W. Germanic 1%
Political lean MEDSL · Roscommon
- 2024 margin
- Solid R (+32.9) · D 32.9% · R 65.9% · Other 1.2%
- 2008→2024 swing
- -35.5pp toward R · 2008: 2.5pp · 2024: -32.9pp
- All cycles
- 2024: R+32.9 2020: R+30.0 2016: R+29.6 2012: R+3.9 2008: D+2.5
Not yet ingested
- Civics
- —
Market trends
- HPI YoY
- ▼ -29.98%
- Current HPI
- 319.603
- Rent YoY
- —
- Metro
- —
- State GDP YoY
- ▲ 1.37%
- F500 in state
- 28
Industry mix (Fortune 500 HQ in MI)
| Industry | F500 HQs | Revenue |
|---|---|---|
| Automotive Parts | 3 | $48B |
|
||
| Automotive | 2 | $372B |
|
||
| Chemicals | 1 | $45B |
|
||
| Automotive Retail | 1 | $29B |
|
||
| Healthcare / Medical Devices | 1 | $23B |
|
||
| Automotive Technology | 1 | $20B |
|
||
Price history
+103.5% since first listed12 events — show timeline
- 2026-06-10 Listed $69,000 FSBO.com
- 2022-01-27 Sold (MLS) $35,000 REALCOMP
- 2022-01-27 Sold (MLS) $35,000 MiRealSource-MiMLS
- 2022-01-27 Sold (MLS) $35,000 SW Michigan MLS
- 2022-01-27 Sold (MLS) $35,000 AAMLS
- 2022-01-27 Sold (MLS) $35,000 MiRealSource-MiMLS
- 2021-11-17 Listed $42,900 REALCOMP
- 2021-11-17 Listed $42,900 MiRealSource-MiMLS
- 2021-11-17 Listed $42,900 SW Michigan MLS
- 2021-11-17 Listed $42,900 AAMLS
- 2021-11-17 Listed $42,900 MiRealSource-MiMLS
- 2005-08-19 Sold (Public Records) $33,900 Public Records
Property tax history
+8.0%/yrLatest (2025): $1,384 · +1.8% YoY. Source: county tax records.
Cash-flow waterfall
monthlySold comps — $/sqft
last 12 mo · ≤1 miLoading sold comps…