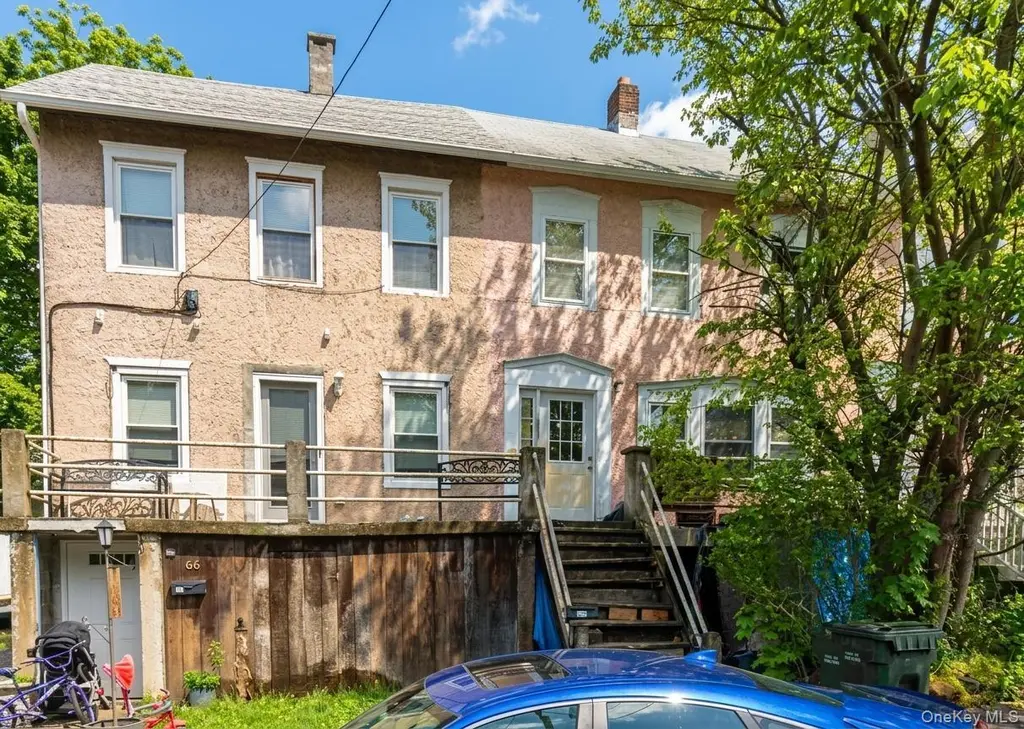
64 Schneider Ave · Highland Falls, NY
Flood risk 1/10 · Minimal
- FEMA flood zone
- X (unshaded)
- Chance of flooding over 30 yrs
- 0.0%
- Est. flood insurance / yr
- $473 – $860
Fire risk 4/10 · Minor
- Est. fire insurance / yr
- $691 – $1,283
Heat risk 5/10 · Moderate
- Hot days now (above 100°F)
- 7 days/yr
- Hot days in 30 yrs
- 17 days/yr
Wind risk 4/10 · Minor
- Chance of severe wind over 30 yrs
- 17.0%
Air-quality risk 3/10 · Minor
- Unhealthy air days now
- 2 days/yr
- Unhealthy air days in 30 yrs
- 3 days/yr
Risk factors via First Street. Map © Google.
Why this score? — see what drove the B+ grade
The composite is a weighted blend of 9 inputs, each scored 0–100. Each bar is that input's sub-score; the figure is the points it added to the 100-point composite (weight × sub-score).
- Cash flow +28.8/30.0
- DSCR +10.0/10.0
- Appreciation +9.8/10.0
- 1% rule +9.6/10.0
- ARV discount +7.5/15.0
- Schools +4.6/10.0
- Livability +3.7/5.0
- Rent growth +2.5/5.0
- Condition / age +2.5/5.0
$159,000
🖨 Deal sheet 📄 Offer letter ✓ Due diligence
Listing remarks
Located within the Highland Falls-Fort Montgomery Central School District, this property presents an opportunity to renovate and customize a home in a location surrounded by history, scenery, and convenience. Enjoy close proximity to Bear Mountain State Park, Storm King State Park, the Hudson River waterfront, and the historic United States Military Academy. Conveniently located near Route 9W, Route 218, the Palisades Interstate Parkway, the Bear Mountain Bridge, and Metro-North stations in Peekskill and Garrison for access throughout the Hudson Valley and into NYC. Being sold as-is, this property offers an exciting opportunity for investors, renovators, or buyers looking to create a person
Key facts
- 2,000 sq ft lot
- Built 1860
- Listed 20 days
Property features AI
Exterior
- Parking: Driveway; Off-street parking; Private unpaved parking
- Utilities: Public sewer; Electric service by Orange & Rockland; Natural gas connected; Water connected
- Home design: Townhouse; Single-family residence; Living area per public records
- Construction: Stucco exterior
- Exterior features: Near public transit; Near schools; Near shops; Partially fenced
Interior
- Kitchen: Appliances: Other
- Bedrooms: 5 total rooms (bedrooms count not specified)
- Bathrooms: 1 full bathroom
- Heating & cooling: Hot water heating; Natural gas heating; Steam heating; No central cooling
- Interior features: Other interior features; Full basement; Crawl attic
- Laundry & utility: Utilities connected: Electricity, Natural Gas, Water, Sewer; Trash collection public; Cable connected
Neighborhood map
What this means for you Summary
Snapshot
- This is a 3-bed/1.0-bath single-family listed at $159k.
Deal economics
- At list price, monthly cash flow is $533 ($6k/yr) — positive.
- The deal already cash-flows at list — no discount required.
- Meets the 1% rule at list price ($2k rent vs $159k).
- Recommended offer: $157k (1.5% below list) — sets the bar for market timing.
Location & tenants
- Location reads 73/100 on livability (#335 in NY) — a middle-class / working-renter tenant base. Strengths: employment A+, housing A+, health & safety A+; Watch: cost of living D, amenities F, commute F.
- Highland Falls Central School District (rural): math 53% / reading 47% proficiency, ranked #328 of 590 in NY (top 56%) — acceptable for families but not a draw, mixed tenant base, ~2y average lease.
- Zoned schools: Fort Montgomery Elementary School (201 students, 52% FRL); Highland Falls Intermediate School (math 32% / reading 47%, grade F, #418 of 729 statewide, top 59%, 324 students, 56% FRL); James I O'Neill High School (math 87% / reading 70%, grade A-, #568 of 1,100 statewide, top 52%, 424 students, 30% FRL).
- Market conditions: 18 active listings in the ZIP; 8 comparable units currently listed for rent nearby; rentals at typical pace (median 23d on market — plan ~3-4 weeks tenant-placement turnaround); 1,746 units permitted in Orange County in 2024 (1,265 in 5+ unit buildings).
Forward outlook
- In year one you build about $17k of equity ($1k loan paydown + $15k appreciation (9.7% local appreciation)).
- At projected returns (9.7% appreciation + 3.0% rent growth), your $45k cash investment doubles in ~2 years — after that, you're playing with house money.
- By year 3, paydown + projected appreciation supports a ~$42k cash-out refi (75% LTV) — recoverable capital for the next deal without selling this one.
Negotiation context
- It's been on market 20 days — a 2% lower offer ($157k) is reasonable based on typical stale-listing flexibility.
- Current owner paid $13k; list at $159k implies a 1125% gain — meaningful room to come down on a strong offer.
Risks & watch-outs
- Watch-outs: property tax is 3.1% of price; built in 1860 — expect roof / HVAC / electrical / plumbing capex.
- Climate carrying-cost: extreme-heat days projected 7→17/yr by 2055 (HVAC capex compounding) — expect insurance premiums to compound above CPI over the hold.
Questions for the listing agent
- Built in 1860 — when were the roof, HVAC, electrical panel, plumbing, and water heater last replaced?
- Property tax is high relative to price — has the assessment been appealed recently, and will the sale trigger a re-assessment?
- Is there a deadline driving the sale (1031 exchange, divorce, estate, relocation)? That informs how much negotiation room exists.
- What's the average days-on-market for RENTAL listings here right now (not sales)? A rising rental-DOM trend means longer vacancies and softer asking-rent achievability than the comps imply.
- What's the recent tenant-quality profile in this submarket — average credit score on applications, eviction rate, late-payment / NSF rate, and stable-employment percentage? A property-management company in the area should have these aggregated.
- How much new for-sale + rental construction is in the pipeline within 1–3 miles? Heavy new supply typically softens prices + rents 12–24 months out; constrained supply supports both.
Investment metrics
- 1% rule
- 1.46% ✓
- Cap rate
- 10.32%
- Cash-on-cash
- 14.38%
- DSCR
- 1.64
- GRM
- 5.7
CMA / ARV
- ARV (on-the-fly)
- $326,560
- Comps found
- 12
Show comp detail 12 sales within ~0.75 mi
| Address | Dist | Beds/Ba | Sqft | Sold | Price | $/sf | Match |
|---|---|---|---|---|---|---|---|
| 60 Schneider Ave | 0.01mi | 2/1.0 (-1) | 1,040 (0%) | 4mo | $130,000 | $125 | 91 |
| 94 Center St | 0.13mi | 3/1.0 | 1,108 (+6%) | 1mo | $275,000 | $248 | 82 |
| 138 Mountain Ave | 0.33mi | 3/1.0 | 1,036 (-0%) | 11mo | $340,500 | $329 | 75 |
| 17 Schneider Ave | 0.17mi | 3/1.0 | 1,163 (+12%) | 4mo | $325,000 | $279 | 69 |
| 17 Tobins Ln | 0.19mi | 2/1.0 (-1) | 996 (-4%) | 13mo | $257,500 | $259 | 68 |
| 4 Chestnut St | 0.19mi | 3/1.0 | 1,140 (+10%) | 12mo | $340,000 | $298 | 65 |
| 22 South St | 0.21mi | 3/1.5 | 1,178 (+13%) | 8mo | $330,000 | $280 | 60 |
| 28 Fort Putnam St | 0.23mi | 2/1.0 (-1) | 900 (-14%) | 6mo | $327,500 | $364 | 57 |
| 32 West St | 0.12mi | 2/1.0 (-1) | 1,178 (+13%) | 15mo | $370,000 | $314 | 55 |
| 106 Mearns Ave | 0.44mi | 2/1.0 (-1) | 1,102 (+6%) | 16mo | $425,000 | $386 | 52 |
| 4 Oak Ave | 0.29mi | 3/1.0 | 1,196 (+15%) | 12mo | $400,000 | $334 | 52 |
| 8 Laurel Ln | 0.58mi | 3/1.0 | 1,110 (+7%) | 14mo | $403,000 | $363 | 51 |
Match score weights: distance 35% · size 25% · config 20% · recency 20%. Top-matched comps best support the ARV.
Projected returns pro-forma
9.7% appreciation · 3.0% rent growth · sell at horizon
- IRR
- 34.4%
- Equity multiple
- 3.64×
- Total profit
- $117,429
- Equity at exit
- $139,727
- IRR
- 29.8%
- Equity multiple
- 8.16×
- Total profit
- $318,575
- Equity at exit
- $297,664
Cash invested: $44,520 (down + closing). Projections, not guarantees.
Landlord ↔ Tenant lean methodology
- Overall (STATE)
- 15 Strongly Tenant-Friendly
- State New York
- 15 Strongly Tenant-Friendly · D+10
- County
- — inherits STATE
- City
- — inherits STATE
ZIP-level market 10928
- Home prices YoY
- 3.5%
- Active inventory
- 18
- Price-to-rent
- 5.7×
Monthly cashflow live
- Estimated rent
- $2,327 high interval (Pro) →
- Mortgage (P&I)
- −$834
- Tax from tax record
- −$405 /mo · $4,859/yr
- Insurance
- −$66
- HOA
- −$0
- Vacancy / Maint / Mgmt
- −$489
- Net cashflow
- $533
Break-even live
UW: 25.0% down · 7.5% · 30yr · 1.5% tax · 5.0% vac · 8.0% maint · 8.0% mgmt
Financing live
Cash to close
- Down payment
- $39,750
- Closing costs
- $4,770
- Reserves months
- —
- Total cash needed
- —
Loan-product check · same deal, 3 products live
Conventional
25% down · 7.5% · 30yr
- Down + closing
- —
- Monthly P&I
- —
- Monthly cashflow
- —
- DSCR
- —
- Eligible?
- —
Personal DTI + credit; lowest rate.
DSCR
20% down · 8.5% · 30yr
- Down + closing
- —
- Monthly P&I
- —
- Monthly cashflow
- —
- DSCR
- —
- Eligible?
- —
No personal income docs; deal must DSCR.
Hard money
10% down · 12.0% · 12mo
- Down + closing
- —
- Monthly P&I
- —
- Monthly cashflow
- —
- DSCR
- —
- Eligible?
- —
Short-term bridge; refi at stabilization.
Rent comps 8 comps
| Address | Beds | Baths | Sqft | Rent | $/sqft | DOM | Units | Dist |
|---|---|---|---|---|---|---|---|---|
| 51 Schneider Ave Unit 2A Highland Falls, NY | 3.0 | 1.0 | 900 | $2,795 | $3.11 | 13d | 1 | 0.03mi |
| 30 Center St Highlands, NY | 2.0 | 1.0 | 800 | $2,300 | $2.88 | 13d | 1 | 0.14mi |
| 44 Center St Unit 1 Highland Falls, NY | 3.0 | 1.0 | 975 | $2,050 | $2.10 | 13d | 1 | 0.15mi |
| 29 Tobins Ln #1 Highland Falls, NY | 3.0 | 1.0 | 1000 | $2,850 | $2.85 | 23d | 1 | 0.15mi |
| 29 Tobins Ln Unit 2 Highland Falls, NY | 3.0 | 1.0 | 840 | $2,550 | $3.04 | 43d | 1 | 0.15mi |
| 16 Schneider Ave #1 Highland Falls, NY | 2.0 | 1.0 | 800 | $1,750 | $2.19 | 23d | 1 | 0.16mi |
| 11 Center St Unit 1 Highland Falls, NY | 2.0 | 1.0 | 1150 | $1,800 | $1.57 | 13d | 1 | 0.16mi |
| 12 Mountain Ave Highland Falls, NY | 2.0 | 1.0 | 700 | $2,000 | $2.86 | 43d | 1 | 0.21mi |
Listing history 3 events
-
2026-06-18days on market $159,000 Active 20 DOM
-
2026-06-17remarks 699-char remark
-
2026-06-17$159,000 Active 19 DOM
ⓘ Source: listings_history table (triggers on properties + properties_extension) + one-shot
backfill from property_details.listing_events for pre-trigger history.
Tax reassessment forecast NY · Partial reset (capped growth)
- Current annual tax
- $4,859 · $405/mo
- Projected year-2 tax
- $4,859 · $405/mo
- Expected delta
- $0/yr ($0/mo · 0.0%)
ⓘ Screening estimate from a state-policy table — verify with the county assessor before closing.
Climate risk First Street
- Flood 1/10 Low FEMA zone X (unshaded) · 0% chance over 30 yrs
- Wildfire 4/10 Moderate
- Heat 5/10 Major 7 d/yr ≥100°F today · 17 d/yr by 30 yrs out
- Wind 4/10 Moderate 17% chance of damaging wind over 30 yrs
- Air quality 3/10 Moderate 2 unhealthy d/yr today · 3 by 30 yrs out
Nearby sold comps map
Loading sold comps map…
Walkable amenities ~0.75 mi
Loading nearby amenities…
Taxation est. · year 1
- Rental income
- $27,925
- − Mortgage interest
- −$8,906
- − Property taxes
- −$4,859
- − Insurance
- −$795
- − Repairs & maintenance
- −$2,234
- − Management
- −$2,234
- − Depreciation
- −$4,625
- Taxable income
- $4,271
- Est. tax owed @ 24.0%
- −$1,025
- After-tax cash flow
- $5,376/yr
For passive investors: Depreciation is non-cash, so a rental often shows a tax loss while cash-flowing — sheltering income. Rental losses are passive: they offset passive income freely, and up to $25,000/yr can offset ordinary (W-2) income if you actively participate and your MAGI is under $100k (phasing out to $0 by $150k); unused losses carry forward. On sale, claimed depreciation is recaptured at up to 25%, and gains may owe capital-gains tax (a 1031 exchange can defer both). Figures are a year-1 estimate at your 24.0% rate — not tax advice; consult a CPA.
Schools (NCES district)
- District
- Highland Falls Central School District
- NCES district ID
- 3614430
- Math proficiency
- 53% ▼ -2.00%
- Reading proficiency
- 47% ▼ -6.00%
- Median HH income
- $79,944
- Composite
- 45.68/100
- National rank
- #2577
- State rank
- #328 of 590 in NY
Livability — Highland Falls
- Score
- 73/100
- State rank
- #335
- US rank
- #5653
Category grades
Schools grade is shown separately in the Schools card above.
Census & demographics
- Census place
- Highland Falls, NY
- Population (ZIP)
- 5,273
Population outlook (Orange County) Hauer SSP2
- Today (2025)
- 379,830 people
- By 2030
- 378,955 · -0.2%
- By 2040
- 375,444 · -1.2%
- By 2050
- 369,311 · -2.8%
- By 2075
- 354,233 · -6.7%
- By 2100
- 318,150 · -16.2%
Race, ethnicity, and origin ACS 2023
- Neighborhood character
- Diverse neighborhood (Simpson 0.69)
- Race & ethnicity
- White 44% Hispanic / Latino 30% Two or more races 21% Black 16% Asian 5%
- Hispanic origin (detail)
- Puerto Rican 13% Cuban 1% Dominican 12%
- Common ancestry
- Hispanic 6% Romanian 3% Scotch-Irish 3%
- Foreign-born
- 19% · Canada, China
- Languages at home
- 72% English-only · Spanish 16% French/Haitian/Cajun 6% Chinese 2%
Political lean MEDSL · Orange
- 2024 margin
- Lean R (+8.4) · D 45.8% · R 54.2%
- 2008→2024 swing
- -12.5pp toward R · 2008: 4.1pp · 2024: -8.4pp
- All cycles
- 2024: R+8.4 2020: R+0.2 2016: R+6.5 2012: D+5.2 2008: D+4.1
Not yet ingested
- Civics
- —
Market trends
- HPI YoY
- ▲ 9.70%
- Current HPI
- 284.3368
- Rent YoY
- —
- Metro
- —
- State GDP YoY
- ▲ 2.60%
- F500 in state
- 92
Industry mix (Fortune 500 HQ in NY)
| Industry | F500 HQs | Revenue |
|---|---|---|
| Financial Services | 10 | $950B |
|
||
| Consumer Goods | 9 | $162B |
|
||
| Insurance | 4 | $225B |
|
||
| Telecommunications | 2 | $144B |
|
||
| Pharmaceuticals | 2 | $112B |
|
||
| Media / Entertainment | 2 | $69B |
|
||
Price history
+1666.7% since first listed3 events — show timeline
- 2026-05-28 Listed $159,000 OneKey® MLS as Distributed by MLS Grid
- 1995-10-11 Sold (Public Records) $12,981 Public Records
- 1989-05-01 Sold (Public Records) $9,000 Public Records
Property tax history
+1.3%/yrLatest (2025): $4,859 · +40.4% YoY. Source: county tax records.
Cash-flow waterfall
monthlySold comps — $/sqft
last 12 mo · ≤1 miLoading sold comps…