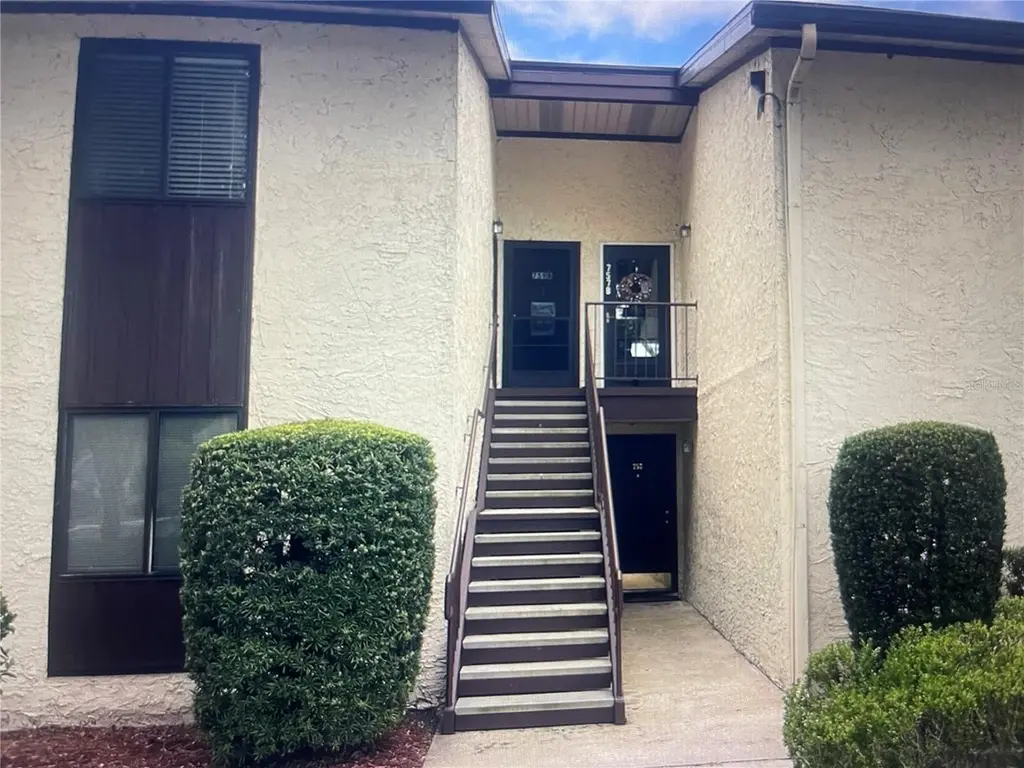
757 Midway Dr Unit B · Silver Springs Shores, FL
Flood risk 1/10 · Minimal
- FEMA flood zone
- X (unshaded)
- Chance of flooding over 30 yrs
- 0.0%
- Est. flood insurance / yr
- $507 – $1,088
Fire risk 5/10 · Moderate
- Est. fire insurance / yr
- $947 – $1,759
Heat risk 8/10 · Major
- Hot days now (above 108°F)
- 7 days/yr
- Hot days in 30 yrs
- 22 days/yr
Wind risk 9/10 · Severe
- Chance of severe wind over 30 yrs
- 99.0%
Air-quality risk 3/10 · Minor
- Unhealthy air days now
- 3 days/yr
- Unhealthy air days in 30 yrs
- 4 days/yr
Risk factors via First Street. Map © Google.
Why this score? — see what drove the C+ grade
The composite is a weighted blend of 9 inputs, each scored 0–100. Each bar is that input's sub-score; the figure is the points it added to the 100-point composite (weight × sub-score).
- Cash flow +21.1/30.0
- ARV discount +8.8/15.0
- 1% rule +8.0/10.0
- Appreciation +8.0/10.0
- DSCR +6.7/10.0
- Schools +3.6/10.0
- Livability +3.4/5.0
- Rent growth +2.5/5.0
- Condition / age +2.5/5.0
$99,900
🖨 Deal sheet (PDF) 📄 Offer letter ✓ Due diligence
Listing remarks MLS
Fabulous 55+ Upstairs FURNISHED TURNKEY condo with great views on the country Club of Silver Springs Golf Course!!! 1 Bedroom 1 bath. Beautiful neutral colors. You feel right at home the moment you enter. Living room has luxury vinyl flooring, sliding glass doors to the lanai with so much natural sunlight! Living room and dining room combination give plenty of space to entertain family and friends. Roof 2024, new Microwave, Washer and Dryer, Dishwasher. You can enjoy all the views from open concept from the kitchen as well. Enjoy a peaceful day in this wonderful retirement community. Community is surrounded by golf course and waterways. You also can join the Silver Springs Community Center. You will pay just $5 for a badge and enjoy year round fun. 3 Pools and a Jacuzzi, community center for get togethers, small fitness center, Pickle Ball, Basketball and right on a lake. Plenty of Grocery stores, restaurants, and medical facilities. 6 miles to the Silver Springs State Park, 5 miles to Santos trailhead and campground, and only 17 miles to the World Equestrian Center. .. .Call today and schedule your private tour!
Key facts
- Open concept
- Sliding glass doors
- 3 pools
Tags
Neighborhood map
What this means for you Summary
Snapshot
- This is a 1-bed/1.0-bath condo listed at $100k.
Deal economics
- At list price, monthly cash flow is $143 ($2k/yr) — positive.
- The deal already cash-flows at list — no discount required.
- Meets the 1% rule at list price ($1k rent vs $100k).
- Recommended offer: $91k (9.0% below list) — sets the bar for market timing.
- Cap rate 8.0% vs local median 4.7% in Silver Springs Shores — top-decile yield for the area; either an underpriced asset or a hidden risk that comps aren't pricing in. Stress-test before assuming the spread holds.
Location & tenants
- Location reads 68/100 on livability (#527 in FL) — a middle-class / working-renter tenant base. Strengths: cost of living A+, housing A+, health & safety A-; Watch: crime C-, employment D, amenities F.
- Marion (rural): math 42% / reading 43% proficiency, ranked #61 of 73 in FL (top 84%) — families likely to look elsewhere, expect single-tenant / working-renter base with shorter leases; 61% free/reduced lunch — lower-income household profile, screen leases tightly.
- Zoned schools: Greenway Elementary School (math 33% / reading 35%, grade F, #1,744 of 2,144 statewide, top 82%, 736 students, 67% FRL); Lake Weir Middle School (math 37% / reading 33%, grade F, #416 of 571 statewide, top 74%, 1,207 students, 76% FRL); Lake Weir High School (math 23% / reading 34%, grade F, #458 of 667 statewide, top 69%, 1,483 students, 68% FRL).
- Market conditions: Rents flat; 682 active listings in the ZIP; 22 comparable units currently listed for rent nearby; rentals at typical pace (median 23d on market — plan ~3-4 weeks tenant-placement turnaround); 7,071 units permitted in Marion County in 2024 (534 in 5+ unit buildings).
Forward outlook
- In year one you build about $7k of equity ($691 loan paydown + $6k appreciation (5.9% local appreciation)).
- Marion County population projected at +13% by 2050 — modest demand growth; plan on rents tracking national, not racing it.
- At projected returns (5.9% appreciation + 0.2% rent growth), your $28k cash investment doubles in ~4 years — after that, you're playing with house money.
- By year 6, paydown + projected appreciation supports a ~$36k cash-out refi (75% LTV) — recoverable capital for the next deal without selling this one.
Negotiation context
- It's been on market 99 days — a 9% lower offer ($91k) is reasonable based on typical stale-listing flexibility.
- 19 sale attempts since 17y ago with the ask held roughly flat each time — persistent listings suggest the price (not the market) is what's stuck; bring a comps-based counter.
- Current owner paid $50k; list at $100k implies a 100% gain — meaningful room to come down on a strong offer.
Risks & watch-outs
- Climate carrying-cost: severe wind risk, 99% chance of damaging wind over 30y; moderate wildfire risk; extreme-heat days projected 7→22/yr by 2055 (HVAC capex compounding) — expect insurance premiums to compound above CPI over the hold.
Questions for the listing agent
- It's been on market 99 days. Have you received any prior offers? Is the seller open to a 9% concession, seller financing, or rate buy-down credit?
- Built in 1975 — when were the roof, HVAC, electrical panel, plumbing, and water heater last replaced?
- What does the HOA fee cover, when was the last increase, and are there any pending special assessments or reserve-fund shortfalls?
- Any open or pending special assessments — roof, HVAC, plumbing, elevator, façade? What's the per-unit balance and payoff schedule, and is the seller paying it off at close or rolling it to the buyer?
- Why hasn't it sold? Are there any deal-killer items the seller is aware of (foundation, flood, title, zoning, code violations)?
- Is there a deadline driving the sale (1031 exchange, divorce, estate, relocation)? That informs how much negotiation room exists.
- Schools are F-rated, which usually means shorter tenancies and higher turnover. Who's the typical renter profile here, and what's been the actual vacancy rate?
- What's the average days-on-market for RENTAL listings here right now (not sales)? A rising rental-DOM trend means longer vacancies and softer asking-rent achievability than the comps imply.
- What's the recent tenant-quality profile in this submarket — average credit score on applications, eviction rate, late-payment / NSF rate, and stable-employment percentage? A property-management company in the area should have these aggregated.
- How much new apartment / multifamily construction is in the pipeline within 1–3 miles? Heavy new supply (>2% of stock underway) typically softens rents 12–24 months out; light construction supports rent growth.
Investment metrics
- 1% rule
- 1.30% ✓
- Cap rate
- 8.01%
- Cash-on-cash
- 6.13%
- DSCR
- 1.27
- GRM
- 6.4
CMA / ARV
- ARV (median comp)
- $102,754
- List price
- $99,900
- Delta
- -2.78%
- Verdict
- FAIR
- Comps
- 20 within 1.0 mi
Projected returns pro-forma
5.93% appreciation · 0.17% rent growth · sell at horizon
- IRR
- 18.6%
- Equity multiple
- 2.22×
- Total profit
- $34,080
- Equity at exit
- $62,376
- IRR
- 16.9%
- Equity multiple
- 4.11×
- Total profit
- $86,976
- Equity at exit
- $112,750
Cash invested: $27,972 (down + closing). Projections, not guarantees.
Landlord ↔ Tenant lean methodology
- Overall (STATE)
- 87 Strongly Landlord-Friendly
- State Florida
- 87 Strongly Landlord-Friendly · R+3
- County
- — inherits STATE
- City
- — inherits STATE
ZIP-level market 34472
- Home prices YoY
- 2.4%
- Rents YoY
- 0.2%
- Active inventory
- 682
- Price-to-rent
- 6.4×
Monthly cashflow live
- Estimated rent
- $1,304 high interval (Pro) →
- Mortgage (P&I)
- −$524
- Tax from tax record
- −$85 /mo · $1,024/yr
- Insurance
- −$42
- HOA
- −$236
- Vacancy / Maint / Mgmt
- −$274
- Net cashflow
- $143
Break-even live
Sensitivity live
| Price | -10% $200 | -5% $171 | +0% $143 | +5% $115 | +10% $86 |
|---|---|---|---|---|---|
| Rent | -10% $40 | -5% $91 | +0% $143 | +5% $194 | +10% $246 |
| Rate | -1.0pp $193 | -0.5pp $168 | base $143 | +0.5pp $117 | +1.0pp $91 |
UW: 25.0% down · 7.5% · 30yr · 1.5% tax · 5.0% vac · 8.0% maint · 8.0% mgmt
Financing live
Cash to close
- Down payment
- $24,975
- Closing costs
- $2,997
- Reserves months
- —
- Total cash needed
- —
Loan-product check · same deal, 3 products live
Conventional
25% down · 7.5% · 30yr
- Down + closing
- —
- Monthly P&I
- —
- Monthly cashflow
- —
- DSCR
- —
- Eligible?
- —
Personal DTI + credit; lowest rate.
DSCR
20% down · 8.5% · 30yr
- Down + closing
- —
- Monthly P&I
- —
- Monthly cashflow
- —
- DSCR
- —
- Eligible?
- —
No personal income docs; deal must DSCR.
Hard money
10% down · 12.0% · 12mo
- Down + closing
- —
- Monthly P&I
- —
- Monthly cashflow
- —
- DSCR
- —
- Eligible?
- —
Short-term bridge; refi at stabilization.
Rent comps 22 comps
| Address | Beds | Baths | Sqft | Rent | $/sqft | DOM | Units | Dist |
|---|---|---|---|---|---|---|---|---|
| 7817 Midway Drive Ter Unit A103 Ocala, FL | 1.0 | 1.0 | 729 | $1,300 | $1.78 | 22d | 1 | 0.08mi |
| 681 Midway Dr Unit A Ocala, FL | 2.0 | 2.0 | 1000 | $1,250 | $1.25 | 15d | 1 | 0.17mi |
| 681 Midway Dr Unit A Ocala, FL | 2.0 | 2.0 | 1000 | $1,250 | $1.25 | 22d | 1 | 0.17mi |
| 608 Midway Dr Unit A Ocala, FL | 2.0 | 1.5 | 1054 | $1,500 | $1.42 | 15d | 1 | 0.32mi |
| 633 Silver Pass Unit B Ocala, FL | 2.0 | 2.0 | 1072 | $1,500 | $1.40 | 22d | 1 | 0.39mi |
| 593 Fairways Cir Unit A Ocala, FL | 2.0 | 1.5 | 1031 | $1,200 | $1.16 | 22d | 1 | 0.40mi |
| 561 Fairways Cir Unit A Ocala, FL | 2.0 | 1.5 | 1031 | $1,250 | $1.21 | 22d | 1 | 0.43mi |
| 549 Fairways Dr Unit A Ocala, FL | 2.0 | 2.0 | 1072 | $1,200 | $1.12 | 22d | 1 | 0.47mi |
| 520 Fairways Cir Unit A Ocala, FL | 2.0 | 1.5 | 1027 | $1,100 | $1.07 | 22d | 1 | 0.50mi |
| 548 Fairways Cir Unit C102 Ocala, FL | 2.0 | 2.0 | 850 | $1,400 | $1.65 | 22d | 1 | 0.52mi |
| 510 Fairways Cir Unit A Ocala, FL | 2.0 | 2.0 | 1000 | $1,299 | $1.30 | 22d | 1 | 0.52mi |
| 532 Bahia Cir Unit A Ocala, FL | 2.0 | 1.5 | 1027 | $1,300 | $1.27 | 22d | 1 | 0.54mi |
| 454 Fairways Cir Ocala, FL | 2.0 | 2.0 | 837 | $1,200 | $1.43 | 22d | 1 | 0.57mi |
| 454 Fairways Cir Unit B203 Ocala, FL | 2.0 | 2.0 | 850 | $1,375 | $1.62 | 22d | 1 | 0.57mi |
| 454 Fairways Cir Unit B204 Ocala, FL | 2.0 | 2.0 | 837 | $1,289 | $1.54 | 22d | 1 | 0.57mi |
| 576 Fairways Ln Unit M104 Ocala, FL | 2.0 | 2.0 | 837 | $1,250 | $1.49 | 22d | 1 | 0.63mi |
| 544 Silver Crse Ocala, FL | 2.0 | 1.0 | 904 | $1,395 | $1.54 | 15d | 1 | 0.70mi |
| 58 Pine Trak Unit 104D Ocala, FL | 2.0 | 2.0 | 832 | $1,050 | $1.26 | 22d | 1 | 0.71mi |
| 54 Pine Trak Unit 104F Ocala, FL | 2.0 | 2.0 | 832 | $1,300 | $1.56 | 22d | 1 | 0.71mi |
| 62 Pine Trak Ocala, FL | 2.0 | 2.0 | 832 | $1,250 | $1.50 | 22d | 1 | 0.73mi |
| 12 Spring Loop Ocala, FL | 2.0 | 1.0 | 900 | $1,350 | $1.50 | 15d | 1 | 1.14mi |
| 162 Bahia Terrace Dr Ocala, FL | 2.0 | 2.0 | 984 | $1,375 | $1.40 | 22d | 1 | 1.43mi |
HOA detail condo
- Monthly dues
- $236 · $2,832/yr
- Likely covers
- waterpoolgym
- Assessments
- None detected in remarks — confirm with the listing agent.
Listing history 50 events
-
2026-06-21days on market $99,900 Active 99 DOM
-
2026-06-18days on market $99,900 Active 96 DOM
-
2026-06-17days on market $99,900 Active 95 DOM
-
2026-06-16days on market $99,900 Active 94 DOM
-
2026-06-15days on market $99,900 Active 93 DOM
-
2026-06-14days on market $99,900 Active 91 DOM
-
2026-06-13days on market $99,900 Active 90 DOM
-
2026-06-10days on market $99,900 Active 88 DOM
-
2026-06-09days on market $99,900 Active 87 DOM
-
2026-06-08days on market $99,900 Active 86 DOM
-
2026-06-07days on market $99,900 Active 85 DOM
-
2026-06-03days on market $99,900 Active 81 DOM
-
2026-06-02days on market $99,900 Active 80 DOM
-
2026-06-01days on market $99,900 Active 79 DOM
-
2026-05-31days on market $99,900 Active 78 DOM
-
2026-05-30days on market $99,900 Active 77 DOM
-
2026-03-14$99,900 Active 1130-char remark
Show marketing remark (1130 chars)
Fabulous 55+ Upstairs FURNISHED TURNKEY condo with great views on the country Club of Silver Springs Golf Course!!! 1 Bedroom 1 bath. Beautiful neutral colors. You feel right at home the moment you enter. Living room has luxury vinyl flooring, sliding glass doors to the lanai with so much natural sunlight! Living room and dining room combination give plenty of space to entertain family and friends. Roof 2024, new Microwave, Washer and Dryer, Dishwasher. You can enjoy all the views from open concept from the kitchen as well. Enjoy a peaceful day in this wonderful retirement community. Community is surrounded by golf course and waterways. You also can join the Silver Springs Community Center. You will pay just $5 for a badge and enjoy year round fun. 3 Pools and a Jacuzzi, community center for get togethers, small fitness center, Pickle Ball, Basketball and right on a lake. Plenty of Grocery stores, restaurants, and medical facilities. 6 miles to the Silver Springs State Park, 5 miles to Santos trailhead and campground, and only 17 miles to the World Equestrian Center. .. .Call today and schedule your private tour!
-
2026-01-16historical
-
2025-08-12status Active
-
2025-08-11status Pending
-
2025-07-18price $99,000
-
2025-07-13$95,000 Active
-
2025-01-14status Active
-
2025-01-14historical
-
2024-11-18status Pending
-
2024-10-16$94,000 Active
-
2024-08-20status Pending
-
2024-08-19historical
-
2024-07-15status Active
-
2024-07-01status Active
-
2024-06-27status Pending
-
2024-05-07status Active
-
2024-05-02$90,000 Active
-
2024-04-22status Active
-
2024-04-22historical
-
2024-04-10status Pending
-
2024-04-08status Active
-
2024-04-08historical
-
2024-03-29status Pending
-
2024-03-22price $95,000
-
2024-02-06$105,000 Active
-
2023-11-04status Pending
-
2023-10-31price $85,000
-
2023-10-26price $90,000
-
2023-09-21price $94,900
-
2023-09-18price $99,900
-
2023-09-06$115,000 Active
-
2023-05-22status Pending
-
2023-05-03price $109,900
-
2023-05-03historical
ⓘ Source: listings_history table (triggers on properties + properties_extension) + one-shot
backfill from property_details.listing_events for pre-trigger history.
Tax reassessment forecast FL · Resets to sale price
- Current annual tax
- $1,024 · $85/mo
- Projected year-2 tax
- $1,024 · $85/mo
- Expected delta
- $0/yr ($0/mo · 0.0%)
ⓘ Screening estimate from a state-policy table — verify with the county assessor before closing.
Climate risk First Street
- Flood 1/10 Low FEMA zone X (unshaded) · 0% chance over 30 yrs
- Wildfire 5/10 Major
- Heat 8/10 Severe 7 d/yr ≥108°F today · 22 d/yr by 30 yrs out
- Wind 9/10 Extreme 99% chance of damaging wind over 30 yrs
- Air quality 3/10 Moderate 3 unhealthy d/yr today · 4 by 30 yrs out
Nearby sold comps map
Loading sold comps map…
Walkable amenities ~0.75 mi
Loading nearby amenities…
Taxation est. · year 1
- Rental income
- $15,643
- − Mortgage interest
- −$5,596
- − Property taxes
- −$1,024
- − Insurance
- −$500
- − Repairs & maintenance
- −$1,251
- − Management
- −$1,251
- − HOA
- −$2,832
- − Depreciation
- −$2,906
- Taxable income
- $282
- Est. tax owed @ 24.0%
- −$68
- After-tax cash flow
- $1,648/yr
For passive investors: Depreciation is non-cash, so a rental often shows a tax loss while cash-flowing — sheltering income. Rental losses are passive: they offset passive income freely, and up to $25,000/yr can offset ordinary (W-2) income if you actively participate and your MAGI is under $100k (phasing out to $0 by $150k); unused losses carry forward. On sale, claimed depreciation is recaptured at up to 25%, and gains may owe capital-gains tax (a 1031 exchange can defer both). Figures are a year-1 estimate at your 24.0% rate — not tax advice; consult a CPA.
Schools (NCES district)
- District
- Marion
- NCES district ID
- 1201260
- Math proficiency
- 42% ▼ -7.00%
- Reading proficiency
- 43% ▼ -4.00%
- Median HH income
- $40,015
- Composite
- 35.61/100
- National rank
- #4890
- State rank
- #61 of 73 in FL
Livability — Silver Springs Shores
- Score
- 68/100
- State rank
- #527
- US rank
- #9854
Category grades
Schools grade is shown separately in the Schools card above.
Census & demographics
- Census place
- Silver Springs Shores, FL
- County
- Marion County · 315,796 people
- City population
- 34,665
- Metro
- Ocala, FL
- Population (ZIP)
- 35,851
- Household income
- $64,208
- Rent vs Own
- Severe rent burden
- 655.0
Population outlook (Marion County) Hauer SSP2
- Today (2025)
- 365,905 people
- By 2030
- 376,768 · +3.0%
- By 2040
- 396,555 · +8.4%
- By 2050
- 412,723 · +12.8%
- By 2075
- 446,090 · +21.9%
- By 2100
- 436,193 · +19.2%
Race, ethnicity, and origin ACS 2023
- Neighborhood character
- Diverse neighborhood (Simpson 0.65)
- Race & ethnicity
- White 50% Hispanic / Latino 25% Black 21% Two or more races 18% Asian 2%
- Hispanic origin (detail)
- Mexican 2% Puerto Rican 14% Cuban 3%
- Common ancestry
- Romanian 2% Iranian 1% Lithuanian 1%
- Foreign-born
- 11% · Canada, Jamaica, China
- Languages at home
- 78% English-only · Spanish 19% Other Indo-European 1%
Political lean MEDSL · Marion
- 2024 margin
- Solid R (+31.6) · D 33.8% · R 65.5%
- 2008→2024 swing
- -20.0pp toward R · 2008: -11.6pp · 2024: -31.6pp
- All cycles
- 2024: R+31.6 2020: R+25.9 2016: R+26.2 2012: R+16.2 2008: R+11.6
Not yet ingested
- Civics
- —
Market trends
- HPI YoY
- ▲ 5.93%
- Current HPI
- 255.0714
- Rent YoY
- ▲ 0.17%
- Metro
- Ocala, FL
- State GDP YoY
- ▲ 3.28%
- F500 in state
- 36
Industry mix (Fortune 500 HQ in FL)
| Industry | F500 HQs | Revenue |
|---|---|---|
| Industrial Technology | 2 | $29B |
|
||
| Insurance | 2 | $17B |
|
||
| Retail | 1 | $60B |
|
||
| Technology Distribution | 1 | $58B |
|
||
| Homebuilding | 1 | $35B |
|
||
| Technology Manufacturing | 1 | $35B |
|
||
Price history
+244.5% since first listed49 events — show timeline
- 2026-03-14 Listed $99,900 Stellar MLS as Distributed by MLS Grid
- 2026-01-16 Listing Removed — Stellar MLS as Distributed by MLS Grid
- 2025-08-12 Relisted — Stellar MLS as Distributed by MLS Grid
- 2025-08-11 Pending — Stellar MLS as Distributed by MLS Grid
- 2025-07-18 Price Changed $99,000 Stellar MLS as Distributed by MLS Grid
- 2025-07-13 Listed $95,000 Stellar MLS as Distributed by MLS Grid
- 2025-01-14 Relisted — Stellar MLS as Distributed by MLS Grid
- 2025-01-14 Listing Removed — Stellar MLS as Distributed by MLS Grid
- 2024-11-18 Pending — Stellar MLS as Distributed by MLS Grid
- 2024-10-16 Listed $94,000 Stellar MLS as Distributed by MLS Grid
- 2024-08-20 Pending — Stellar MLS as Distributed by MLS Grid
- 2024-08-19 Listing Removed — Stellar MLS as Distributed by MLS Grid
- 2024-07-15 Relisted — Stellar MLS as Distributed by MLS Grid
- 2024-07-01 Relisted — Stellar MLS as Distributed by MLS Grid
- 2024-06-27 Pending — Stellar MLS as Distributed by MLS Grid
- 2024-05-07 Relisted — Stellar MLS as Distributed by MLS Grid
- 2024-05-02 Listed $90,000 Stellar MLS as Distributed by MLS Grid
- 2024-04-22 Relisted — Stellar MLS as Distributed by MLS Grid
- 2024-04-22 Listing Removed — Stellar MLS as Distributed by MLS Grid
- 2024-04-10 Pending — Stellar MLS as Distributed by MLS Grid
- 2024-04-08 Relisted — Stellar MLS as Distributed by MLS Grid
- 2024-04-08 Listing Removed — Stellar MLS as Distributed by MLS Grid
- 2024-03-29 Pending — Stellar MLS as Distributed by MLS Grid
- 2024-03-22 Price Changed $95,000 Stellar MLS as Distributed by MLS Grid
- 2024-02-06 Listed $105,000 Stellar MLS as Distributed by MLS Grid
- 2023-11-04 Pending — Stellar MLS as Distributed by MLS Grid
- 2023-10-31 Price Changed $85,000 Stellar MLS as Distributed by MLS Grid
- 2023-10-26 Price Changed $90,000 Stellar MLS as Distributed by MLS Grid
- 2023-09-21 Price Changed $94,900 Stellar MLS as Distributed by MLS Grid
- 2023-09-18 Price Changed $99,900 Stellar MLS as Distributed by MLS Grid
- 2023-09-06 Listed $115,000 Stellar MLS as Distributed by MLS Grid
- 2023-05-22 Pending — Stellar MLS as Distributed by MLS Grid
- 2023-05-03 Listing Removed — Stellar MLS as Distributed by MLS Grid
- 2023-05-03 Price Changed $109,900 Stellar MLS as Distributed by MLS Grid
- 2023-03-31 Price Changed $104,900 Stellar MLS as Distributed by MLS Grid
- 2023-03-08 Listed $109,900 Stellar MLS as Distributed by MLS Grid
- 2023-01-07 Listing Removed — Stellar MLS as Distributed by MLS Grid
- 2022-12-18 Listed $110,000 Stellar MLS as Distributed by MLS Grid
- 2021-09-17 Pending — Stellar MLS as Distributed by MLS Grid
- 2021-06-30 Relisted — Stellar MLS as Distributed by MLS Grid
- 2021-06-21 Pending — Stellar MLS as Distributed by MLS Grid
- 2021-06-11 Listed $67,500 Stellar MLS as Distributed by MLS Grid
- 2020-07-07 Sold (Public Records) $50,000 Public Records
- 2020-07-06 Sold (MLS) $50,000 Stellar MLS as Distributed by MLS Grid
- 2020-05-15 Listed $52,000 Stellar MLS as Distributed by MLS Grid
- 2017-03-31 Sold (Public Records) $22,000 Public Records
- 2010-04-30 Listing Removed — Stellar MLS as Distributed by MLS Grid
- 2009-09-25 Listed $34,750 Stellar MLS as Distributed by MLS Grid
- 1978-09-01 Sold (Public Records) $29,000 Public Records
Property tax history
+3.7%/yrLatest (2025): $1,024 · +26.6% YoY. Source: county tax records.
Cash-flow waterfall
monthlySold comps — $/sqft
last 12 mo · ≤1 miLoading sold comps…