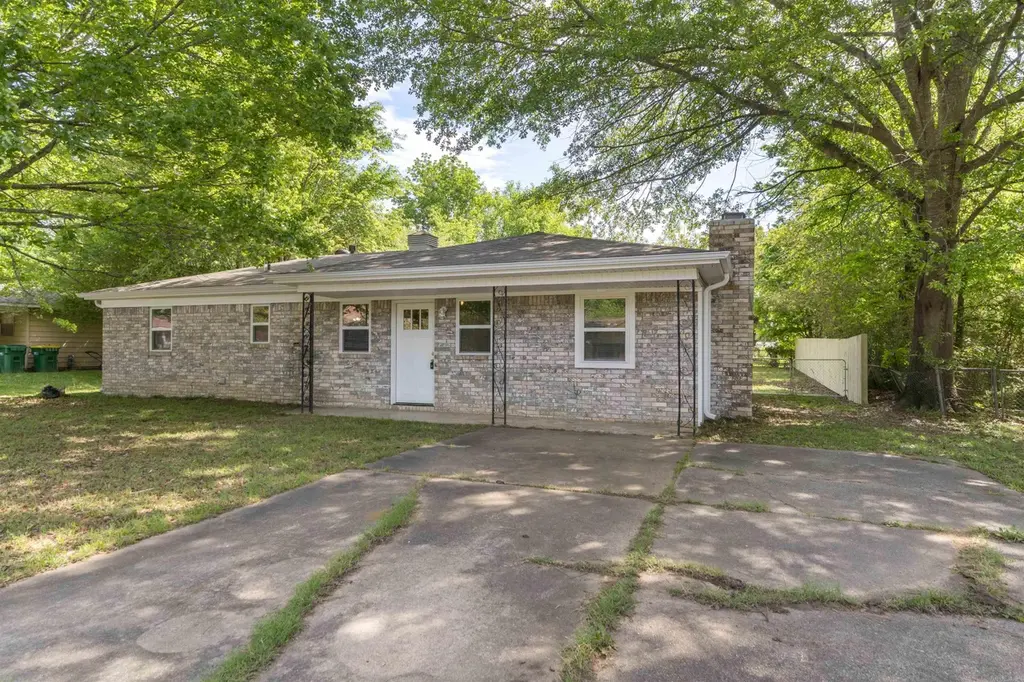
6 Waterfront Dr · Gibson, AR
Flood risk 1/10 · Minimal
- FEMA flood zone
- X (unshaded)
- Chance of flooding over 30 yrs
- 0.0%
- Est. flood insurance / yr
- $507 – $1,088
Fire risk 4/10 · Minor
- Est. fire insurance / yr
- $1,499 – $2,785
Heat risk 7/10 · Major
- Hot days now (above 111°F)
- 7 days/yr
- Hot days in 30 yrs
- 18 days/yr
Wind risk 4/10 · Minor
- Chance of severe wind over 30 yrs
- 9.0%
Air-quality risk 2/10 · Minimal
- Unhealthy air days now
- 2 days/yr
- Unhealthy air days in 30 yrs
- 2 days/yr
Risk factors via First Street. Map © Google.
Why this score? — see what drove the D grade
The composite is a weighted blend of 9 inputs, each scored 0–100. Each bar is that input's sub-score; the figure is the points it added to the 100-point composite (weight × sub-score).
- Cash flow +18.5/30.0
- DSCR +5.8/10.0
- 1% rule +4.1/10.0
- Rent growth +3.7/5.0
- Livability +3.2/5.0
- ARV discount +2.9/15.0
- Schools +2.6/10.0
- Condition / age +2.5/5.0
- Appreciation +0.0/10.0
$145,000
🖨 Deal sheet (PDF) 📄 Offer letter ✓ Due diligence
Listing remarks
Tired of driving your kids to school. This home is close to middle school and around corner from elementary. Newly remodeled with new windows, doors, siding, flooring, fixtures, electric fireplace. Roof is 2 years old, fully fenced, 10 x 20 patio.
Key facts
- New doors
- New siding
- Newly remodeled
Tags
Property features AI
Finance
- Other: Termite service by Bug Master
Exterior
- Parking: Parking pads for 2 cars
- Utilities: Public sewer; Public water; Electric (Co-Op); Natural gas; Cable TV; Insulated windows and doors; Attic turbo vent
- Home design: Brick and frame exterior with metal/vinyl siding; .24 acre lot; Level lot in a subdivision
- Construction: Architectural shingle roof; Slab foundation
- Exterior features: Patio; Fully fenced yard; Outside storage area; Guttering; Paved road access
Interior
- Kitchen: Free-standing stove; Gas range; Microwave; Dishwasher; Refrigerator stays
- Flooring: Laminate
- Bathrooms: 1 full bathroom
- Heating & cooling: Central heat (gas); Central cooling (electric)
- Interior features: Laminate floors; Den / family room
Neighborhood map
What this means for you Summary
Snapshot
- This is a 3-bed/1.0-bath single-family listed at $145k.
Deal economics
- At list price, monthly cash flow is $138 ($2k/yr) — positive.
- The deal already cash-flows at list — no discount required.
- To meet the 1% rule (rent ≥ 1% of price), the offer needs to be $132k (8.8% below list).
- Recommended offer: $132k (8.8% below list) — sets the bar for 1% rule.
Location & tenants
- Location reads 64/100 on livability (#165 in AR) — a middle-class / working-renter tenant base. Strengths: cost of living A+, housing A+, employment B; Watch: amenities F, commute F, health & safety F.
- Pulaski County Spec. School District (rural): math 27% / reading 31% proficiency, ranked #150 of 238 in AR (top 63%) — low school quality limits family demand, transient renter base, plan for 1-2y turnover.
- Zoned schools: Cato Elementary School (math 42% / reading 32%, grade F, #229 of 454 statewide, top 54%, 296 students, 97% FRL); Sylvan Hills Middle School (math 26% / reading 30%, grade F, #150 of 201 statewide, top 76%, 1,122 students, 52% FRL); Sylvan Hills High School (math 16% / reading 29%, grade F, #211 of 292 statewide, top 73%, 1,017 students, 38% FRL).
- Market conditions: Rents rising fast (+4.8%/yr); 249 active listings in the ZIP; 10 comparable units currently listed for rent nearby; rentals at typical pace (median 25d on market — plan ~3-4 weeks tenant-placement turnaround); solid renter incomes; 1,006 units permitted in Pulaski County in 2024 (0 in 5+ unit buildings).
Forward outlook
- Local home prices are declining (-3.0%/yr); year-one equity from $1k of loan paydown is wiped out by about $4k of value loss. Plan a longer hold.
- Pulaski County population projected at +6% by 2050 — modest demand growth; plan on rents tracking national, not racing it.
Negotiation context
- Only 12 days on market — expect competitive offers; lowballing is unlikely to land.
- 2 sale attempts with the ask held roughly flat each time — persistent listings suggest the price (not the market) is what's stuck; bring a comps-based counter.
Risks & watch-outs
- Climate carrying-cost: extreme-heat days projected 7→18/yr by 2055 (HVAC capex compounding) — expect insurance premiums to compound above CPI over the hold.
Questions for the listing agent
- Built in 1971 — when were the roof, HVAC, electrical panel, plumbing, and water heater last replaced?
- Is there a deadline driving the sale (1031 exchange, divorce, estate, relocation)? That informs how much negotiation room exists.
- Schools are F-rated, which usually means shorter tenancies and higher turnover. Who's the typical renter profile here, and what's been the actual vacancy rate?
- The area grade is low — what's the realistic commute time and amenity access for the typical tenant pool here? Any planned neighborhood developments (good or bad) we should know about?
- What's the average days-on-market for RENTAL listings here right now (not sales)? A rising rental-DOM trend means longer vacancies and softer asking-rent achievability than the comps imply.
- What's the recent tenant-quality profile in this submarket — average credit score on applications, eviction rate, late-payment / NSF rate, and stable-employment percentage? A property-management company in the area should have these aggregated.
- How much new for-sale + rental construction is in the pipeline within 1–3 miles? Heavy new supply typically softens prices + rents 12–24 months out; constrained supply supports both.
Investment metrics
- 1% rule
- 0.91% ✗
- Cap rate
- 7.43%
- Cash-on-cash
- 4.07%
- DSCR
- 1.18
- GRM
- 9.1
CMA / ARV
- ARV (median comp)
- $131,526
- List price
- $145,000
- Delta
- 10.24%
- Verdict
- OVERPRICED
- Comps
- 20 within 1.0 mi
Show comp detail 12 sales within ~0.75 mi
| Address | Dist | Beds/Ba | Sqft | Sold | Price | $/sf | Match |
|---|---|---|---|---|---|---|---|
| 6 Waterfront Dr | 0.00mi | 3/1.0 | 1,261 (-1%) | 0mo | $145,000 | $115 | 99 |
| 66 Aloha Cir | 0.22mi | 3/2.0 | 1,224 (-4%) | 6mo | $30,000 | $25 | 75 |
| 38 Compass Point St | 0.21mi | 3/2.0 | 1,167 (-8%) | 4mo | $110,000 | $94 | 70 |
| 16 Cinnamon Dr | 0.30mi | 2/2.5 (-1) | 1,310 (+3%) | 10mo | $135,100 | $103 | 62 |
| 61 Cinnamon Dr | 0.54mi | 3/2.0 | 1,228 (-3%) | 5mo | $185,000 | $151 | 61 |
| 38 Sheila Dr | 0.64mi | 3/2.0 | 1,314 (+4%) | 3mo | $195,000 | $148 | 58 |
| 3 Luau Dr | 0.10mi | 4/2.0 (+1) | 1,432 (+13%) | 8mo | $142,000 | $99 | 58 |
| 29 Frostwood Dr | 0.63mi | 3/1.5 | 1,337 (+5%) | 6mo | $165,900 | $124 | 54 |
| 29 Sheila Dr | 0.55mi | 3/2.0 | 1,389 (+10%) | 4mo | $210,000 | $151 | 51 |
| 2720 Koko Dr | 0.55mi | 3/2.0 | 1,136 (-10%) | 10mo | $162,000 | $143 | 45 |
| 77 Cinnamon Dr | 0.63mi | 3/2.0 | 1,408 (+11%) | 5mo | $189,900 | $135 | 44 |
| 2740 Koko Dr | 0.61mi | 4/1.5 (+1) | 1,382 (+9%) | 9mo | $171,000 | $124 | 42 |
Match score weights: distance 35% · size 25% · config 20% · recency 20%. Top-matched comps best support the ARV.
Projected returns pro-forma
-3.0% appreciation · 4.81% rent growth · sell at horizon
- IRR
- -8.1%
- Equity multiple
- 0.70×
- Total profit
- $-12,310
- Equity at exit
- $21,620
- IRR
- 3.4%
- Equity multiple
- 1.27×
- Total profit
- $10,860
- Equity at exit
- $12,537
Cash invested: $40,600 (down + closing). Projections, not guarantees.
Landlord ↔ Tenant lean methodology
- Overall (STATE)
- 92 Strongly Landlord-Friendly
- State Arkansas
- 92 Strongly Landlord-Friendly · R+14
- County
- — inherits STATE
- City
- — inherits STATE
ZIP-level market 72120
- Rents YoY
- 4.8%
- Active inventory
- 249
- Price-to-rent
- 9.1×
Monthly cashflow live
- Estimated rent
- $1,322 high interval (Pro) →
- Mortgage (P&I)
- −$760
- Tax from tax record
- −$86 /mo · $1,032/yr
- Insurance
- −$60
- HOA
- −$0
- Vacancy / Maint / Mgmt
- −$278
- Net cashflow
- $138
Break-even live
Sensitivity live
| Price | -10% $220 | -5% $179 | +0% $138 | +5% $97 | +10% $56 |
|---|---|---|---|---|---|
| Rent | -10% $33 | -5% $86 | +0% $138 | +5% $190 | +10% $242 |
| Rate | -1.0pp $211 | -0.5pp $175 | base $138 | +0.5pp $100 | +1.0pp $62 |
UW: 25.0% down · 7.5% · 30yr · 1.5% tax · 5.0% vac · 8.0% maint · 8.0% mgmt
Financing live
Cash to close
- Down payment
- $36,250
- Closing costs
- $4,350
- Reserves months
- —
- Total cash needed
- —
Loan-product check · same deal, 3 products live
Conventional
25% down · 7.5% · 30yr
- Down + closing
- —
- Monthly P&I
- —
- Monthly cashflow
- —
- DSCR
- —
- Eligible?
- —
Personal DTI + credit; lowest rate.
DSCR
20% down · 8.5% · 30yr
- Down + closing
- —
- Monthly P&I
- —
- Monthly cashflow
- —
- DSCR
- —
- Eligible?
- —
No personal income docs; deal must DSCR.
Hard money
10% down · 12.0% · 12mo
- Down + closing
- —
- Monthly P&I
- —
- Monthly cashflow
- —
- DSCR
- —
- Eligible?
- —
Short-term bridge; refi at stabilization.
Rent comps 10 comps
| Address | Beds | Baths | Sqft | Rent | $/sqft | DOM | Units | Dist |
|---|---|---|---|---|---|---|---|---|
| 38 Compass Point St Sherwood, AR | 3.0 | 2.0 | 1167 | $1,050 | $0.90 | 25d | 1 | 0.21mi |
| 67 Aloha Cir Unit A Sherwood, AR | 2.0 | 1.0 | 900 | $995 | $1.11 | 25d | 1 | 0.23mi |
| 59 Aloha Cir Sherwood, AR | 4.0 | 2.0 | 1200 | $1,195 | $1.00 | 21d | 1 | 0.25mi |
| 21 Brookway Ln Sherwood, AR | 3.0 | 1.5 | 1024 | $1,195 | $1.17 | 45d | 1 | 1.07mi |
| 16 Brookway Ln Sherwood, AR | 3.0 | 2.0 | 1206 | $1,295 | $1.07 | 25d | 1 | 1.11mi |
| 8 Brookway Ln Sherwood, AR | 3.0 | 2.0 | 1170 | $1,300 | $1.11 | 45d | 1 | 1.15mi |
| 8061 Nora Ln Sherwood, AR | 3.0 | 2.5 | 1700 | $3,069 | $1.81 | 25d | 1 | 1.30mi |
| 1717 Hatcher Rd Unit 16 Sherwood, AR | 3.0 | 2.0 | 1280 | $800 | $0.62 | 16d | 1 | 1.34mi |
| 1717 Hatcher Rd Unit 23 Sherwood, AR | 3.0 | 2.0 | 1280 | $750 | $0.59 | 16d | 1 | 1.44mi |
| 20 Single Oaks Dr Sherwood, AR | 3.0 | 2.0 | 1858 | $1,881 | $1.01 | 16d | 1 | 1.47mi |
Listing history 5 events
-
2026-05-13status Under Contract 247-char remark
-
2026-05-04historical Take Backups 247-char remark
-
2026-05-01$145,000 New Listing 247-char remark
-
2026-03-26historical $1,250
-
2026-01-20$1,250
ⓘ Source: listings_history table (triggers on properties + properties_extension) + one-shot
backfill from property_details.listing_events for pre-trigger history.
Tax reassessment forecast AR · Resets to sale price
- Current annual tax
- $1,032 · $86/mo
- Projected year-2 tax
- $1,032 · $86/mo
- Expected delta
- $0/yr ($0/mo · 0.0%)
ⓘ Screening estimate from a state-policy table — verify with the county assessor before closing.
Climate risk First Street
- Flood 1/10 Low FEMA zone X (unshaded) · 0% chance over 30 yrs
- Wildfire 4/10 Moderate
- Heat 7/10 Severe 7 d/yr ≥111°F today · 18 d/yr by 30 yrs out
- Wind 4/10 Moderate 9% chance of damaging wind over 30 yrs
- Air quality 2/10 Low 2 unhealthy d/yr today · 2 by 30 yrs out
Nearby sold comps map
Loading sold comps map…
Walkable amenities ~0.75 mi
Loading nearby amenities…
Taxation est. · year 1
- Rental income
- $15,866
- − Mortgage interest
- −$8,122
- − Property taxes
- −$1,032
- − Insurance
- −$725
- − Repairs & maintenance
- −$1,269
- − Management
- −$1,269
- − Depreciation
- −$4,218
- Taxable loss
- −$769
- Est. tax savings @ 24.0%
- +$185
- After-tax cash flow
- $1,838/yr
For passive investors: Depreciation is non-cash, so a rental often shows a tax loss while cash-flowing — sheltering income. Rental losses are passive: they offset passive income freely, and up to $25,000/yr can offset ordinary (W-2) income if you actively participate and your MAGI is under $100k (phasing out to $0 by $150k); unused losses carry forward. On sale, claimed depreciation is recaptured at up to 25%, and gains may owe capital-gains tax (a 1031 exchange can defer both). Figures are a year-1 estimate at your 24.0% rate — not tax advice; consult a CPA.
Schools (NCES district)
- District
- Pulaski County Spec. School District
- NCES district ID
- 0511850
- Math proficiency
- 27% ▼ -13.00%
- Reading proficiency
- 31% ▼ -10.00%
- Median HH income
- $53,218
- Composite
- 25.67/100
- National rank
- #7394
- State rank
- #150 of 238 in AR
Livability — Gibson
- Score
- 64/100
- State rank
- #165
- US rank
- #13982
Category grades
Schools grade is shown separately in the Schools card above.
Census & demographics
- Census place
- Gibson, AR
- County
- Pulaski County · 372,764 people
- City population
- 33,393
- Metro
- Little Rock-North Little Rock-Conway, AR
- Population (ZIP)
- 34,365
- Household income
- $76,598
- Rent vs Own
- Severe rent burden
- 774.0
Population outlook (Pulaski County) Hauer SSP2
- Today (2025)
- 415,378 people
- By 2030
- 423,720 · +2.0%
- By 2040
- 435,182 · +4.8%
- By 2050
- 440,904 · +6.1%
- By 2075
- 445,521 · +7.3%
- By 2100
- 419,173 · +0.9%
Race, ethnicity, and origin ACS 2023
- Neighborhood character
- Predominantly White (65%)
- Race & ethnicity
- White 65% Black 26% Two or more races 5% Hispanic / Latino 4% Asian 1%
- Common ancestry
- Lithuanian 2% Slovak 1% Italian 1%
- Foreign-born
- 2% · Canada, South Korea
- Languages at home
- 96% English-only · Spanish 2% Korean 1%
Political lean MEDSL · Pulaski
- 2024 margin
- Strong D (+22.1) · D 59.8% · R 37.7% · Other 2.5%
- 2008→2024 swing
- +10.6pp toward D · 2008: 11.6pp · 2024: 22.1pp
- All cycles
- 2024: D+22.1 2020: D+22.5 2016: D+17.9 2012: D+11.4 2008: D+11.6
Not yet ingested
- Civics
- —
Market trends
- HPI YoY
- ▼ -134.93%
- Current HPI
- 198.9456
- Rent YoY
- ▲ 4.81%
- Metro
- Little Rock-North Little Rock-Conway, AR
- State GDP YoY
- ▲ 3.80%
- F500 in state
- 10
Industry mix (Fortune 500 HQ in AR)
| Industry | F500 HQs | Revenue |
|---|---|---|
| Retail | 1 | $681B |
|
||
| Food / Agriculture | 1 | $53B |
|
||
| Retail / Energy | 1 | $22B |
|
||
| Transportation / Logistics | 1 | $12B |
|
||
| Energy | 1 | $4B |
|
||
Price history
+11500.0% since first listed6 events — show timeline
- 2026-06-12 Sold (MLS) $145,000 CARMLS
- 2026-05-13 Pending — CARMLS
- 2026-05-04 Contingent — CARMLS
- 2026-05-01 Listed $145,000 CARMLS
- 2026-03-26 Rental Removed $1,250 APPFOLIO
- 2026-01-20 Listed for Rent $1,250 APPFOLIO
Property tax history
+4.0%/yrLatest (2025): $1,032 · +3.1% YoY. Source: county tax records.
Cash-flow waterfall
monthlySold comps — $/sqft
last 12 mo · ≤1 miLoading sold comps…