376 Kingston Dr E · Tice, FL
Flood risk 1/10 · Minimal
- FEMA flood zone
- X (unshaded)
- Chance of flooding over 30 yrs
- 0.0%
- Est. flood insurance / yr
- $507 – $1,088
Fire risk 4/10 · Minor
- Est. fire insurance / yr
- $947 – $1,759
Heat risk 10/10 · Severe
- Hot days now (above 107°F)
- 7 days/yr
- Hot days in 30 yrs
- 30 days/yr
Wind risk 10/10 · Severe
- Chance of severe wind over 30 yrs
- 99.0%
Air-quality risk 2/10 · Minimal
- Unhealthy air days now
- 1 days/yr
- Unhealthy air days in 30 yrs
- 1 days/yr
Risk factors via First Street. Map © Google.
Why this score? — see what drove the B grade
The composite is a weighted blend of 9 inputs, each scored 0–100. Each bar is that input's sub-score; the figure is the points it added to the 100-point composite (weight × sub-score).
- Cash flow +28.7/30.0
- ARV discount +15.0/15.0
- DSCR +10.0/10.0
- 1% rule +7.7/10.0
- Schools +4.1/10.0
- Livability +3.4/5.0
- Condition / age +2.5/5.0
- Rent growth +1.8/5.0
- Appreciation +0.0/10.0
$129,900
🖨 Deal sheet (PDF) 📄 Offer letter ✓ Due diligence
Listing remarks
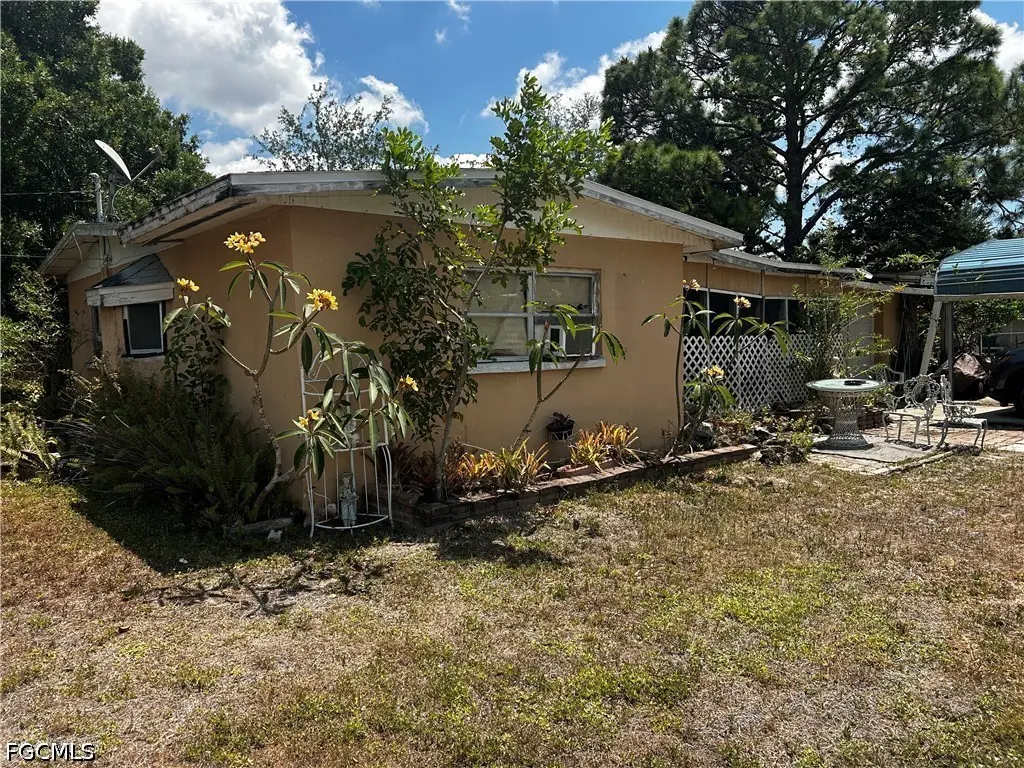
1963 concrete block house in need of some love. Endless potential . .. .. .. several brand new homes being built within feet of this one. Was occupied up to a few months ago. .. .. .Oversized garage 16x28. Long corner lot 155X55 Agents see remarks
Key facts
- 8,276 sq ft lot
- Garage
- Built 1963
Property features AI
Finance
- Financial info: Pets allowed
- HOA & community: Non-gated community; No association fee
Exterior
- Parking: Attached garage (1 space); Detached carport (1 space); 2 covered parking spaces
- Utilities: Public water; Public sewer; Cable available
- Home design: Single-story; Resale property; Faces west; Zoned RS-1
- Construction: Block, concrete and stucco construction; Shingle roof; Built on a single story
- Exterior features: Corner lot; Irregular lot; East exposure; No additional exterior features listed
Interior
- Bedrooms: Unfurnished
- Flooring: Terrazzo flooring; Tile flooring
- Bathrooms: 1 full bathroom
- Heating & cooling: Central heating (electric); Central air conditioning (electric); Window AC unit(s)
- Interior features: Jalousie windows; Family/Dining room; Living/Dining room; Tub with shower
Neighborhood map
What this means for you Summary
Snapshot
- This is a 2-bed/1.0-bath single-family listed at $130k.
Deal economics
- At list price, monthly cash flow is $434 ($5k/yr) — positive.
- The deal already cash-flows at list — no discount required.
- Meets the 1% rule at list price ($2k rent vs $130k).
- Recommended offer: $126k (3.0% below list) — sets the bar for market timing.
Location & tenants
- Location reads 67/100 on livability (#552 in FL) — a middle-class / working-renter tenant base. Strengths: cost of living A+, housing A+, health & safety A; Watch: amenities F, commute F, employment F.
- Lee (suburban): math 47% / reading 50% proficiency, ranked #42 of 73 in FL (top 58%) — families likely to look elsewhere, expect single-tenant / working-renter base with shorter leases.
- Zoned schools: Sunshine Elementary School (math 38% / reading 42%, grade F, #1,491 of 2,144 statewide, top 70%, 1,301 students, 74% FRL); Oak Hammock Middle School (math 43% / reading 41%, grade D-, #340 of 571 statewide, top 61%, 1,563 students, 56% FRL); Lehigh Senior High School (math 23% / reading 45%, grade F, #394 of 667 statewide, top 60%, 2,476 students, 57% FRL).
- Market conditions: Rents soft (-3.0%/yr); 768 active listings in the ZIP; 18 comparable units currently listed for rent nearby; rentals at typical pace (median 25d on market — plan ~3-4 weeks tenant-placement turnaround); 15,411 units permitted in Lee County in 2024 (4,686 in 5+ unit buildings).
Forward outlook
- Local home prices are declining (-3.0%/yr); year-one equity from $898 of loan paydown is wiped out by about $4k of value loss. Plan a longer hold.
- Lee County population projected at +44% by 2050 — long-run rental-demand tailwind backs the buy-and-hold thesis.
Negotiation context
- It's been on market 40 days — a 3% lower offer ($126k) is reasonable based on typical stale-listing flexibility.
- Current owner paid $33k; list at $130k implies a 294% gain — meaningful room to come down on a strong offer.
Risks & watch-outs
- Climate carrying-cost: severe wind risk, 99% chance of damaging wind over 30y; extreme-heat days projected 7→30/yr by 2055 (HVAC capex compounding) — expect insurance premiums to compound above CPI over the hold.
Questions for the listing agent
- It's been on market 40 days. Have you received any prior offers? Is the seller open to a 3% concession, seller financing, or rate buy-down credit?
- Built in 1963 — when were the roof, HVAC, electrical panel, plumbing, and water heater last replaced?
- Is there a deadline driving the sale (1031 exchange, divorce, estate, relocation)? That informs how much negotiation room exists.
- Schools are F-rated, which usually means shorter tenancies and higher turnover. Who's the typical renter profile here, and what's been the actual vacancy rate?
- What's the average days-on-market for RENTAL listings here right now (not sales)? A rising rental-DOM trend means longer vacancies and softer asking-rent achievability than the comps imply.
- What's the recent tenant-quality profile in this submarket — average credit score on applications, eviction rate, late-payment / NSF rate, and stable-employment percentage? A property-management company in the area should have these aggregated.
- How much new for-sale + rental construction is in the pipeline within 1–3 miles? Heavy new supply typically softens prices + rents 12–24 months out; constrained supply supports both.
Investment metrics
- 1% rule
- 1.27% ✓
- Cap rate
- 10.30%
- Cash-on-cash
- 14.32%
- DSCR
- 1.64
- GRM
- 6.6
CMA / ARV
- ARV (on-the-fly)
- $170,730
- Comps found
- 2
Show comp detail 2 sales within ~0.75 mi
| Address | Dist | Beds/Ba | Sqft | Sold | Price | $/sf | Match |
|---|---|---|---|---|---|---|---|
| 5194 Atlanta Ave | 0.03mi | 2/1.0 | 720 (-11%) | 15mo | $113,000 | $157 | 68 |
| 262 Palmacea Rd | 0.45mi | 3/2.0 (+1) | 926 (+14%) | 8mo | $194,000 | $210 | 40 |
Match score weights: distance 35% · size 25% · config 20% · recency 20%. Top-matched comps best support the ARV.
Projected returns pro-forma
-3.0% appreciation · 0.0% rent growth · sell at horizon
- IRR
- 1.3%
- Equity multiple
- 1.05×
- Total profit
- $1,780
- Equity at exit
- $19,369
- IRR
- 7.8%
- Equity multiple
- 1.51×
- Total profit
- $18,518
- Equity at exit
- $11,231
Cash invested: $36,372 (down + closing). Projections, not guarantees.
Landlord ↔ Tenant lean methodology
- Overall (STATE)
- 87 Strongly Landlord-Friendly
- State Florida
- 87 Strongly Landlord-Friendly · R+3
- County
- — inherits STATE
- City
- — inherits STATE
ZIP-level market 33905
- Home prices YoY
- -31.4%
- Rents YoY
- -3.0%
- Active inventory
- 768
- Price-to-rent
- 6.6×
Monthly cashflow live
- Estimated rent
- $1,648 high interval (Pro) →
- Mortgage (P&I)
- −$681
- Tax from tax record
- −$133 /mo · $1,590/yr
- Insurance
- −$54
- HOA
- −$0
- Vacancy / Maint / Mgmt
- −$346
- Net cashflow
- $434
Break-even live
Sensitivity live
| Price | -10% $508 | -5% $471 | +0% $434 | +5% $397 | +10% $361 |
|---|---|---|---|---|---|
| Rent | -10% $304 | -5% $369 | +0% $434 | +5% $499 | +10% $564 |
| Rate | -1.0pp $500 | -0.5pp $467 | base $434 | +0.5pp $401 | +1.0pp $366 |
UW: 25.0% down · 7.5% · 30yr · 1.5% tax · 5.0% vac · 8.0% maint · 8.0% mgmt
Financing live
Cash to close
- Down payment
- $32,475
- Closing costs
- $3,897
- Reserves months
- —
- Total cash needed
- —
Loan-product check · same deal, 3 products live
Conventional
25% down · 7.5% · 30yr
- Down + closing
- —
- Monthly P&I
- —
- Monthly cashflow
- —
- DSCR
- —
- Eligible?
- —
Personal DTI + credit; lowest rate.
DSCR
20% down · 8.5% · 30yr
- Down + closing
- —
- Monthly P&I
- —
- Monthly cashflow
- —
- DSCR
- —
- Eligible?
- —
No personal income docs; deal must DSCR.
Hard money
10% down · 12.0% · 12mo
- Down + closing
- —
- Monthly P&I
- —
- Monthly cashflow
- —
- DSCR
- —
- Eligible?
- —
Short-term bridge; refi at stabilization.
Rent comps 18 comps
| Address | Beds | Baths | Sqft | Rent | $/sqft | DOM | Units | Dist |
|---|---|---|---|---|---|---|---|---|
| 9540 Green Cypress Ln #11 Fort Myers, FL | 2.0 | 2.0 | 988 | $2,500 | $2.53 | 25d | 1 | 0.46mi |
| 9570 Green Cypress Ln #13 Fort Myers, FL | 2.0 | 2.0 | 985 | $2,800 | $2.84 | 25d | 1 | 0.47mi |
| 4681 Lakeside Club Blvd #11 Fort Myers, FL | 2.0 | 2.0 | 964 | $1,300 | $1.35 | 25d | 1 | 0.54mi |
| 9950 Sailview Ct #2 Fort Myers, FL | 2.0 | 2.0 | 964 | $1,500 | $1.56 | 25d | 1 | 0.60mi |
| 9970 Sailview Ct #9 Fort Myers, FL | 2.0 | 2.0 | 988 | $1,100 | $1.11 | 4d | 1 | 0.64mi |
| 9970 Sailview Ct #9 Fort Myers, FL | 2.0 | 2.0 | 988 | $1,150 | $1.16 | 25d | 1 | 0.64mi |
| 215 Delray Ave Fort Myers, FL | 2.0 | 1.0 | 740 | $1,450 | $1.96 | 15d | 1 | 0.64mi |
| 141 Schneider Dr Fort Myers, FL | 3.0 | 2.0 | 1048 | $2,500 | $2.39 | 25d | 1 | 0.67mi |
| 328 Bellair Rd Fort Myers, FL | 2.0 | 1.0 | 900 | $1,500 | $1.67 | 25d | 1 | 0.69mi |
| 326 Chattanooga Dr Fort Myers, FL | 2.0 | 1.0 | 895 | $1,475 | $1.65 | 22d | 1 | 0.82mi |
| 4900 Tice St Unit 5 Fort Myers, FL | 2.0 | 1.0 | 700 | $800 | $1.14 | 25d | 1 | 0.85mi |
| 4724 Tice St Fort Myers, FL | 2.0 | 1.0 | 890 | $1,100 | $1.24 | 17d | 1 | 1.03mi |
| 464 Carolina Ave Fort Myers, FL | 2.0 | 1.0 | 750 | $975 | $1.30 | 21d | 1 | 1.04mi |
| 464 Carolina Ave Unit A Fort Myers, FL | 2.0 | 1.0 | 714 | $1,150 | $1.61 | 4d | 1 | 1.04mi |
| 243 Tangerine Dr Fort Myers, FL | 2.0 | 1.5 | 720 | $1,425 | $1.98 | 25d | 1 | 1.11mi |
| 319 Montgomery Ave Fort Myers, FL | 3.0 | 1.0 | 978 | $1,300 | $1.33 | 16d | 1 | 1.14mi |
| 580 Thomas Ave Fort Myers, FL | 2.0 | 1.0 | 900 | $1,200 | $1.33 | 25d | 1 | 1.18mi |
| 9145 Flying Eagle DR Tice, FL | 1.0–3.0 | 1.0–2.5 | 1072 | $2,174 | $2.03 | 4d | 14 | 1.35mi |
Listing history 15 events
-
2026-06-22days on market $129,900 Active 40 DOM
-
2026-06-17days on market $129,900 Active 36 DOM
-
2026-06-16days on market $129,900 Active 35 DOM
-
2026-06-15days on market $129,900 Active 34 DOM
-
2026-06-13days on market $129,900 Active 32 DOM
-
2026-06-10days on market $129,900 Active 29 DOM
-
2026-06-09days on market $129,900 Active 28 DOM
-
2026-06-08days on market $129,900 Active 27 DOM
-
2026-06-07days on market $129,900 Active 26 DOM
-
2026-06-03days on market $129,900 Active 22 DOM
-
2026-06-02days on market $129,900 Active 21 DOM
-
2026-06-01days on market $129,900 Active 20 DOM
-
2026-05-31days on market $129,900 Active 19 DOM
-
2026-05-12$129,900 Active
-
1984-05-01soldstatus $33,000
ⓘ Source: listings_history table (triggers on properties + properties_extension) + one-shot
backfill from property_details.listing_events for pre-trigger history.
Tax reassessment forecast FL · Resets to sale price
- Current annual tax
- $1,590 · $133/mo
- Projected year-2 tax
- $1,590 · $133/mo
- Expected delta
- $0/yr ($0/mo · 0.0%)
ⓘ Screening estimate from a state-policy table — verify with the county assessor before closing.
Climate risk First Street
- Flood 1/10 Low FEMA zone X (unshaded) · 0% chance over 30 yrs
- Wildfire 4/10 Moderate
- Heat 10/10 Extreme 7 d/yr ≥107°F today · 30 d/yr by 30 yrs out
- Wind 10/10 Extreme 99% chance of damaging wind over 30 yrs
- Air quality 2/10 Low 1 unhealthy d/yr today · 1 by 30 yrs out
Nearby sold comps map
Loading sold comps map…
Walkable amenities ~0.75 mi
Loading nearby amenities…
Taxation est. · year 1
- Rental income
- $19,778
- − Mortgage interest
- −$7,276
- − Property taxes
- −$1,590
- − Insurance
- −$650
- − Repairs & maintenance
- −$1,582
- − Management
- −$1,582
- − Depreciation
- −$3,779
- Taxable income
- $3,318
- Est. tax owed @ 24.0%
- −$796
- After-tax cash flow
- $4,414/yr
For passive investors: Depreciation is non-cash, so a rental often shows a tax loss while cash-flowing — sheltering income. Rental losses are passive: they offset passive income freely, and up to $25,000/yr can offset ordinary (W-2) income if you actively participate and your MAGI is under $100k (phasing out to $0 by $150k); unused losses carry forward. On sale, claimed depreciation is recaptured at up to 25%, and gains may owe capital-gains tax (a 1031 exchange can defer both). Figures are a year-1 estimate at your 24.0% rate — not tax advice; consult a CPA.
Schools (NCES district)
- District
- Lee
- NCES district ID
- 1201080
- Math proficiency
- 47% ▼ -11.00%
- Reading proficiency
- 50% ▼ -4.00%
- Median HH income
- $49,518
- Composite
- 41.49/100
- National rank
- #3458
- State rank
- #42 of 73 in FL
Livability — Tice
- Score
- 67/100
- State rank
- #552
- US rank
- #10424
Category grades
Schools grade is shown separately in the Schools card above.
Census & demographics
- County
- Lee County · 788,662 people
- Metro
- Cape Coral-Fort Myers, FL
- Population (ZIP)
- 41,381
- Household income
- $71,987
- Rent vs Own
- Severe rent burden
- 1358.0
Population outlook (Lee County) Hauer SSP2
- Today (2025)
- 871,946 people
- By 2030
- 955,468 · +9.6%
- By 2040
- 1,113,587 · +27.7%
- By 2050
- 1,256,891 · +44.1%
- By 2075
- 1,560,270 · +78.9%
- By 2100
- 1,726,848 · +98.0%
Race, ethnicity, and origin ACS 2023
- Neighborhood character
- Diverse neighborhood (Simpson 0.59)
- Race & ethnicity
- White 53% Hispanic / Latino 34% Two or more races 17% Black 9% Native American 4% Asian 2%
- Hispanic origin (detail)
- Mexican 11% Puerto Rican 5% Cuban 2%
- Common ancestry
- Romanian 2% Slovak 2% Lithuanian 2%
- Foreign-born
- 20% · Canada, Jamaica
- Languages at home
- 68% English-only · Spanish 29% Other Indo-European 1% German/W. Germanic 1%
Political lean MEDSL · Lee
- 2024 margin
- Strong R (+28.4) · D 35.5% · R 63.9%
- 2008→2024 swing
- -18.0pp toward R · 2008: -10.4pp · 2024: -28.4pp
- All cycles
- 2024: R+28.4 2020: R+19.2 2016: R+20.4 2012: R+16.6 2008: R+10.4
Not yet ingested
- Civics
- —
Market trends
- HPI YoY
- ▼ -122.89%
- Current HPI
- 268.4598
- Rent YoY
- ▼ -2.97%
- Metro
- Cape Coral-Fort Myers, FL
- State GDP YoY
- ▲ 3.28%
- F500 in state
- 36
Industry mix (Fortune 500 HQ in FL)
| Industry | F500 HQs | Revenue |
|---|---|---|
| Industrial Technology | 2 | $29B |
|
||
| Insurance | 2 | $17B |
|
||
| Retail | 1 | $60B |
|
||
| Technology Distribution | 1 | $58B |
|
||
| Homebuilding | 1 | $35B |
|
||
| Technology Manufacturing | 1 | $35B |
|
||
Price history
+293.6% since first listed2 events — show timeline
- 2026-05-12 Listed $129,900 FORTMLS
- 1984-05-01 Sold (Public Records) $33,000 Public Records
Property tax history
+19.5%/yrLatest (2025): $1,590 · -21.5% YoY. Source: county tax records.
Cash-flow waterfall
monthlySold comps — $/sqft
last 12 mo · ≤1 miLoading sold comps…