4500 E Martin Way #88 · Olympia, WA
Flood risk 3/10 · Minor
- FEMA flood zone
- X (unshaded)
- Chance of flooding over 30 yrs
- 0.2%
- Est. flood insurance / yr
- $507 – $1,088
Fire risk 3/10 · Minor
- Est. fire insurance / yr
- $604 – $1,122
Heat risk 3/10 · Minor
- Hot days now (above 88°F)
- 7 days/yr
- Hot days in 30 yrs
- 14 days/yr
Wind risk 1/10 · Minimal
- Chance of severe wind over 30 yrs
- —
Air-quality risk 6/10 · Moderate
- Unhealthy air days now
- 7 days/yr
- Unhealthy air days in 30 yrs
- 8 days/yr
Risk factors via First Street. Map © Google.
Why this score? — see what drove the B grade
The composite is a weighted blend of 9 inputs, each scored 0–100. Each bar is that input's sub-score; the figure is the points it added to the 100-point composite (weight × sub-score).
- Cash flow +30.0/30.0
- 1% rule +10.0/10.0
- DSCR +10.0/10.0
- ARV discount +7.5/15.0
- Schools +5.1/10.0
- Livability +4.2/5.0
- Rent growth +3.4/5.0
- Condition / age +2.5/5.0
- Appreciation +0.0/10.0
$99,950
🖨 Deal sheet 📄 Offer letter ✓ Due diligence
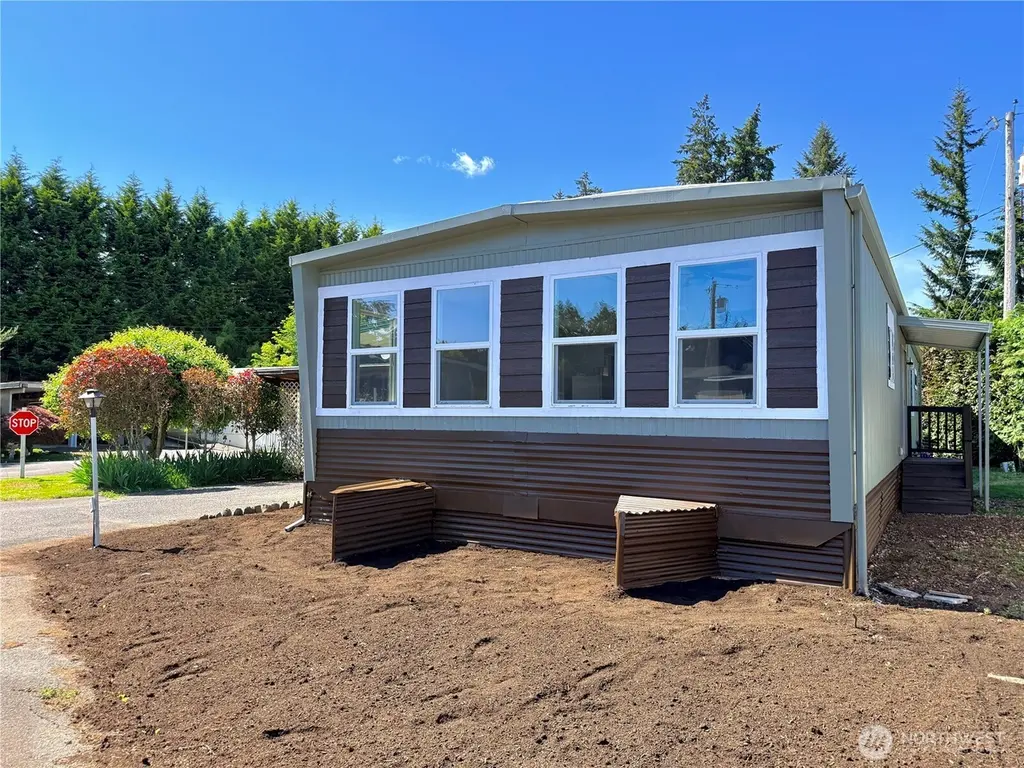
Listing remarks
Why rent when you can own? Welcome to this well-maintained 2-bedroom, 2-bath manufactured home in Candlewood Park. Located in an all-ages community, this home offers an affordable path to homeownership with space rent under $500 per month. The inviting layout provides comfortable living spaces, generous bedrooms, and a private primary suite. Pet lovers will appreciate the per-friendly community, while everyone will enjoy the convenient location close to local amenities. Affordable, comfortable, and ready for its next owner! Hablo espanol.
Key facts
- Convenient location
- Built 1968
- Listed 15 days
Tags
Property features AI
Finance
- Other: Estimated annual tax: $197 (2025)
- Financial info: Accepts Cash and Conventional financing
- HOA & community: Land lease of $500/month
Exterior
- Parking: Carport
- Home design: Manufactured double-wide home; Single-story; Residential property
- Construction: Manufactured house (double wide)
- Exterior features: Located in the Candlewood park; Follow GPS for directions
Interior
- Bedrooms: 2 bedrooms
- Bathrooms: 2 full bathrooms
- Interior features: Located in a manufactured home park approved for sale; One-level living
Neighborhood map
What this means for you Summary
Snapshot
- This is a 2-bed/2.0-bath manufactured listed at $100k.
Deal economics
- At list price, monthly cash flow is $1k ($12k/yr) — positive.
- The deal already cash-flows at list — no discount required.
- Meets the 1% rule at list price ($2k rent vs $100k).
- Recommended offer: $98k (1.5% below list) — sets the bar for market timing.
- Cap rate 18.6% vs local median 2.4% in Olympia — top-decile yield for the area; either an underpriced asset or a hidden risk that comps aren't pricing in. Stress-test before assuming the spread holds.
Location & tenants
- Location reads 83/100 on livability (#58 in WA, #1,036 nationally) — a professional / high-income tenant draw. Strengths: amenities A+, commute A+, health & safety A+; Watch: crime F, cost of living D-.
- North Thurston Public Schools (suburban): math 51% / reading 62% proficiency, ranked #80 of 291 in WA (top 28%) — acceptable for families but not a draw, mixed tenant base, ~2y average lease.
- Market conditions: Rents rising (+3.8%/yr); 218 active listings in the ZIP; 29 comparable units currently listed for rent nearby; rentals at typical pace (median 21d on market — plan ~3-4 weeks tenant-placement turnaround); solid renter incomes; 1,222 units permitted in Thurston County in 2024 (508 in 5+ unit buildings).
Forward outlook
- Local home prices are declining (-3.0%/yr); year-one equity from $692 of loan paydown is wiped out by about $3k of value loss. Plan a longer hold.
- Thurston County population projected at +27% by 2050 — long-run rental-demand tailwind backs the buy-and-hold thesis.
- At projected returns (-3.0% appreciation + 3.8% rent growth), your $28k cash investment doubles in ~3 years — after that, you're playing with house money.
Negotiation context
- It's been on market 15 days — a 2% lower offer ($98k) is reasonable based on typical stale-listing flexibility.
Questions for the listing agent
- Built in 1968 — when were the roof, HVAC, electrical panel, plumbing, and water heater last replaced?
- Is there a deadline driving the sale (1031 exchange, divorce, estate, relocation)? That informs how much negotiation room exists.
- Schools are A-rated — typically a magnet for longer-tenancy family renters. What's the average tenant stay here, and is there a school-zone premium baked into asking?
- Crime grade is F in this area — have there been break-ins, vandalism, or insurance claims at this property in the last 3 years? What carrier currently insures it and at what premium?
- What's the average days-on-market for RENTAL listings here right now (not sales)? A rising rental-DOM trend means longer vacancies and softer asking-rent achievability than the comps imply.
- What's the recent tenant-quality profile in this submarket — average credit score on applications, eviction rate, late-payment / NSF rate, and stable-employment percentage? A property-management company in the area should have these aggregated.
- How much new for-sale + rental construction is in the pipeline within 1–3 miles? Heavy new supply typically softens prices + rents 12–24 months out; constrained supply supports both.
Investment metrics
- 1% rule
- 2.04% ✓
- Cap rate
- 18.63%
- Cash-on-cash
- 44.07%
- DSCR
- 2.96
- GRM
- 4.1
CMA / ARV
- ARV (on-the-fly)
- $58,240
- Comps found
- 7
Show comp detail 7 sales within ~0.75 mi
| Address | Dist | Beds/Ba | Sqft | Sold | Price | $/sf | Match |
|---|---|---|---|---|---|---|---|
| 1350 Alonda Ln NE | 0.63mi | 2/2.0 | 1,152 (+3%) | 7mo | $50,000 | $43 | 60 |
| 1519 Alonda Ln NE | 0.65mi | 2/2.0 | 1,152 (+3%) | 8mo | $60,000 | $52 | 58 |
| 1507 Alonda Ln NE | 0.71mi | 2/2.0 | 1,248 (+11%) | 1mo | $35,000 | $28 | 47 |
| 1414 Alonda Ln NE | 0.69mi | 2/2.0 | 1,247 (+11%) | 17mo | $60,000 | $48 | 34 |
| 4611 17th Ln NE #17 | 0.73mi | 2/1.0 | 1,056 (-6%) | 22mo | $142,500 | $135 | 34 |
| 1417 Alonda Ln NE | 0.67mi | 2/1.5 | 960 (-14%) | 13mo | $65,000 | $68 | 32 |
| 2005 Alonda Ln NE | 0.70mi | 2/1.0 | 960 (-14%) | 23mo | $49,500 | $52 | 21 |
Match score weights: distance 35% · size 25% · config 20% · recency 20%. Top-matched comps best support the ARV.
Projected returns pro-forma
-3.0% appreciation · 3.75% rent growth · sell at horizon
- IRR
- 41.8%
- Equity multiple
- 2.81×
- Total profit
- $50,780
- Equity at exit
- $14,903
- IRR
- 48.3%
- Equity multiple
- 5.82×
- Total profit
- $134,840
- Equity at exit
- $8,642
Cash invested: $27,986 (down + closing). Projections, not guarantees.
Landlord ↔ Tenant lean methodology
- Overall (STATE)
- 28 Tenant-Leaning
- State Washington
- 28 Tenant-Leaning · D+8
- County
- — inherits STATE
- City
- — inherits STATE
ZIP-level market 98516
- Rents YoY
- 3.8%
- Active inventory
- 218
- Price-to-rent
- 4.1×
Monthly cashflow live
- Estimated rent
- $2,043 high interval (Pro) →
- Mortgage (P&I)
- −$524
- Tax from tax record
- −$21 /mo · $249/yr
- Insurance
- −$42
- HOA
- −$0
- Vacancy / Maint / Mgmt
- −$429
- Net cashflow
- $1,028
Break-even live
UW: 25.0% down · 7.5% · 30yr · 1.5% tax · 5.0% vac · 8.0% maint · 8.0% mgmt
Financing live
Cash to close
- Down payment
- $24,988
- Closing costs
- $2,998
- Reserves months
- —
- Total cash needed
- —
Loan-product check · same deal, 3 products live
Conventional
25% down · 7.5% · 30yr
- Down + closing
- —
- Monthly P&I
- —
- Monthly cashflow
- —
- DSCR
- —
- Eligible?
- —
Personal DTI + credit; lowest rate.
DSCR
20% down · 8.5% · 30yr
- Down + closing
- —
- Monthly P&I
- —
- Monthly cashflow
- —
- DSCR
- —
- Eligible?
- —
No personal income docs; deal must DSCR.
Hard money
10% down · 12.0% · 12mo
- Down + closing
- —
- Monthly P&I
- —
- Monthly cashflow
- —
- DSCR
- —
- Eligible?
- —
Short-term bridge; refi at stabilization.
Rent comps 29 comps
| Address | Beds | Baths | Sqft | Rent | $/sqft | DOM | Units | Dist |
|---|---|---|---|---|---|---|---|---|
| 4410 6th Ave SE Lacey, WA | 1.0–3.0 | 1.0–2.0 | 980 | $2,010 | $2.05 | 13d | 14 | 0.42mi |
| 925 Bradley St NE Olympia, WA | 3.0 | 2.0 | 1403 | $2,650 | $1.89 | 43d | 1 | 0.50mi |
| 927 College Ln NE Unit A Lacey, WA | 3.0 | 2.5 | 1390 | $2,300 | $1.65 | 43d | 1 | 0.51mi |
| 3724 Ensign Rd NE Olympia, WA | 2.0 | 1.0–2.0 | 920 | $1,849 | $2.01 | 13d | 5 | 0.63mi |
| 606 Lilly Rd NE Olympia, WA | 1.0–2.0 | 1.0–2.0 | 966 | $2,725 | $2.82 | 13d | 7 | 0.70mi |
| 522 Lilly Rd NE Olympia, WA | 1.0–2.0 | 1.0 | 781 | $1,550 | $1.98 | 13d | 6 | 0.70mi |
| 122 Lilly Rd NE Unit 507 Olympia, WA | 3.0 | 1.0 | 800 | $1,900 | $2.38 | 21d | 1 | 0.71mi |
| 122 Lilly Rd NE Unit 104 Olympia, WA | 2.0 | 1.0 | 750 | $1,700 | $2.27 | 21d | 1 | 0.71mi |
| 1212 Willow St SE Unit 1212-I Olympia, WA | 2.0 | 1.0 | 871 | $1,595 | $1.83 | 21d | 1 | 0.91mi |
| 5224 15th Ave NE Olympia, WA | 1.0–3.0 | 1.0–2.0 | 881 | $2,165 | $2.46 | 13d | 258 | 0.92mi |
| 3806 12th Ave SE Lacey, WA | 1.0–2.0 | 1.0 | 800 | $1,775 | $2.22 | 13d | 3 | 0.93mi |
| 5499 15th Ave NE Lacey, WA | 1.0–3.0 | 1.0–2.0 | 904 | $2,106 | $2.33 | 13d | 26 | 0.93mi |
| 1224 Willow St SE Lacey, WA | 2.0 | 1.0 | 1000 | $2,000 | $2.00 | 21d | 1 | 0.93mi |
| 1848 Mapleview Ct NE Olympia, WA | 3.0 | 2.0 | 1489 | $3,000 | $2.01 | 43d | 1 | 0.93mi |
| 501 Franz Anderson Rd SE Olympia, WA | 1.0 | 1.0 | 720 | $1,598 | $2.22 | 13d | 3 | 1.01mi |
| 1219 East St SE Apt 3 Lacey, WA | 2.0 | 1.0 | 850 | $1,615 | $1.90 | 43d | 1 | 1.03mi |
| 801 Lilly Rd NE Apt 123 Olympia, WA | 1.0 | 1.0 | 762 | $1,700 | $2.23 | 43d | 1 | 1.05mi |
| 4314 14th Way SE Lacey, WA | 2.0 | 1.0 | 938 | $2,500 | $2.67 | 43d | 1 | 1.14mi |
| 1330 Fones Rd SE Olympia, WA | 2.0 | 2.5 | 1406 | $2,250 | $1.60 | 21d | 4 | 1.25mi |
| 6103 Carmel Ln SE Lacey, WA | 3.0 | 2.5 | 1500 | $2,350 | $1.57 | 21d | 1 | 1.31mi |
| 1420 Fones Rd SE Olympia, WA | 2.0 | 2.0 | 1040 | $2,062 | $1.98 | 13d | 2 | 1.34mi |
| 1400 Fones Rd SE Olympia, WA | 1.0–2.0 | 1.0–2.0 | 813 | $1,900 | $2.34 | 13d | 6 | 1.34mi |
| 660 Malibu Dr SE Lacey, WA | 1.0 | 1.0 | 824 | $1,900 | $2.31 | 43d | 1 | 1.36mi |
| 1617 Elizabeth St SE Olympia, WA | 3.0 | 2.0 | 1014 | $2,350 | $2.32 | 13d | 1 | 1.39mi |
| 5805 13th Ave SE Unit C Lacey, WA | 2.0 | 1.0 | 882 | $1,600 | $1.81 | 43d | 1 | 1.47mi |
| 1405 Clearbrook Dr SE Lacey, WA | 1.0–2.0 | 1.0–2.0 | 737 | $1,976 | $2.68 | 43d | 3 | 1.47mi |
| 6110 Pacific Ave SE Lacey, WA | 1.0–2.0 | 1.0 | 632 | $1,459 | $2.31 | 21d | 9 | 1.48mi |
| 6102 Glen Mary Ln SE Unit A Lacey, WA | 2.0 | 1.5 | 1200 | $1,830 | $1.52 | 13d | 1 | 1.48mi |
| 325 Pattison St NE Unit 4 Olympia, WA | 2.0 | 1.5 | 1140 | $1,565 | $1.37 | 21d | 1 | 1.49mi |
Listing history 11 events
-
2026-06-18days on market $99,950 Active 15 DOM
-
2026-06-17days on market $99,950 Active 14 DOM
-
2026-06-16days on market $99,950 Active 13 DOM
-
2026-06-15days on market $99,950 Active 12 DOM
-
2026-06-14days on market $99,950 Active 10 DOM
-
2026-06-13days on market $99,950 Active 9 DOM
-
2026-06-10days on market $99,950 Active 7 DOM
-
2026-06-09days on market $99,950 Active 6 DOM
-
2026-06-08days on market $99,950 Active 5 DOM
-
2026-06-07remarks 544-char remark
-
2026-06-07$99,950 Active 4 DOM
ⓘ Source: listings_history table (triggers on properties + properties_extension) + one-shot
backfill from property_details.listing_events for pre-trigger history.
Tax reassessment forecast WA · Resets to sale price
- Current annual tax
- $249 · $21/mo
- Projected year-2 tax
- $980 · $82/mo
- Expected delta
- +$731/yr (+$61/mo · 293.4%)
ⓘ Screening estimate from a state-policy table — verify with the county assessor before closing.
Climate risk First Street
- Flood 3/10 Moderate FEMA zone X (unshaded) · 20% chance over 30 yrs
- Wildfire 3/10 Moderate
- Heat 3/10 Moderate 7 d/yr ≥88°F today · 14 d/yr by 30 yrs out
- Wind 1/10 Low
- Air quality 6/10 Major 7 unhealthy d/yr today · 8 by 30 yrs out
Nearby sold comps map
Loading sold comps map…
Walkable amenities ~0.75 mi
Loading nearby amenities…
Taxation est. · year 1
- Rental income
- $24,520
- − Mortgage interest
- −$5,599
- − Property taxes
- −$249
- − Insurance
- −$500
- − Repairs & maintenance
- −$1,962
- − Management
- −$1,962
- − Depreciation
- −$2,908
- Taxable income
- $11,342
- Est. tax owed @ 24.0%
- −$2,722
- After-tax cash flow
- $9,610/yr
For passive investors: Depreciation is non-cash, so a rental often shows a tax loss while cash-flowing — sheltering income. Rental losses are passive: they offset passive income freely, and up to $25,000/yr can offset ordinary (W-2) income if you actively participate and your MAGI is under $100k (phasing out to $0 by $150k); unused losses carry forward. On sale, claimed depreciation is recaptured at up to 25%, and gains may owe capital-gains tax (a 1031 exchange can defer both). Figures are a year-1 estimate at your 24.0% rate — not tax advice; consult a CPA.
Schools (NCES district)
- District
- North Thurston Public Schools
- NCES district ID
- 5305850
- Math proficiency
- 51% ▬ 0.00%
- Reading proficiency
- 62% ▬ 0.00%
- Median HH income
- $62,338
- Composite
- 51.09/100
- National rank
- #3798
- State rank
- #80 of 291 in WA
Livability — Olympia
- Score
- 83/100
- State rank
- #58
- US rank
- #1036
Category grades
Schools grade is shown separately in the Schools card above.
Census & demographics
- Census place
- Olympia, WA
- County
- Thurston County · 269,345 people
- City population
- 98,428
- Metro
- Olympia-Lacey-Tumwater, WA
- Population (ZIP)
- 29,177
- Household income
- $98,892
- Rent vs Own
- Severe rent burden
- 1202.0
Population outlook (Thurston County) Hauer SSP2
- Today (2025)
- 308,239 people
- By 2030
- 326,483 · +5.9%
- By 2040
- 359,890 · +16.8%
- By 2050
- 391,800 · +27.1%
- By 2075
- 468,024 · +51.8%
- By 2100
- 519,890 · +68.7%
Race, ethnicity, and origin ACS 2023
- Neighborhood character
- Diverse neighborhood (Simpson 0.58)
- Race & ethnicity
- White 62% Two or more races 14% Asian 11% Hispanic / Latino 10% Black 4% Pacific Islander 1%
- Hispanic origin (detail)
- Mexican 6%
- Common ancestry
- Portuguese 3% Lithuanian 2% Iranian 2%
- Foreign-born
- 14% · Canada, Vietnam, South Korea
- Languages at home
- 81% English-only · Spanish 7% Other Asian/Pacific 3% Tagalog/Filipino 2%
Political lean MEDSL · Thurston
- 2024 margin
- Strong D (+20.4) · D 58.5% · R 38.1% · Other 3.5%
- 2008→2024 swing
- -1.3pp toward R · 2008: 21.7pp · 2024: 20.4pp
- All cycles
- 2024: D+20.4 2020: D+18.6 2016: D+15.4 2012: D+19.0 2008: D+21.7
Not yet ingested
- Civics
- —
Market trends
- HPI YoY
- ▼ -203.16%
- Current HPI
- 323.7121
- Rent YoY
- ▲ 3.75%
- Metro
- Olympia-Lacey-Tumwater, WA
- State GDP YoY
- ▲ 4.65%
- F500 in state
- 22
Industry mix (Fortune 500 HQ in WA)
| Industry | F500 HQs | Revenue |
|---|---|---|
| Retail | 2 | $269B |
|
||
| Technology / Retail | 1 | $638B |
|
||
| Technology | 1 | $245B |
|
||
| Telecommunications | 1 | $38B |
|
||
| Food / Beverage | 1 | $36B |
|
||
| Automotive / Trucks | 1 | $34B |
|
||
Price history
1 event — show timeline
- 2026-06-02 Listed $99,950 NWMLS as Distributed by MLS Grid
Property tax history
+7.6%/yrLatest (2026): $249 · +26.6% YoY. Source: county tax records.
Cash-flow waterfall
monthlySold comps — $/sqft
last 12 mo · ≤1 miLoading sold comps…