 Duplex
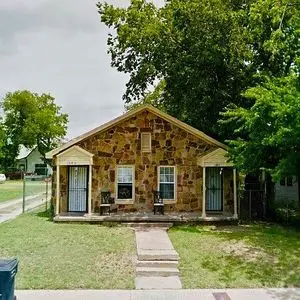
1605 E Hattie St · Fort Worth, TX
Flood risk 1/10 · Minimal
- FEMA flood zone
- X (unshaded)
- Chance of flooding over 30 yrs
- 0.0%
- Est. flood insurance / yr
- $507 – $1,088
Fire risk 1/10 · Minimal
- Est. fire insurance / yr
- $1,222 – $2,270
Heat risk 8/10 · Major
- Hot days now (above 109°F)
- 7 days/yr
- Hot days in 30 yrs
- 23 days/yr
Wind risk 4/10 · Minor
- Chance of severe wind over 30 yrs
- 24.0%
Air-quality risk 3/10 · Minor
- Unhealthy air days now
- 3 days/yr
- Unhealthy air days in 30 yrs
- 4 days/yr
Risk factors via First Street. Map © Google.
Why this score? — see what drove the C grade
The composite is a weighted blend of 9 inputs, each scored 0–100. Each bar is that input's sub-score; the figure is the points it added to the 100-point composite (weight × sub-score).
- Cash flow +26.2/30.0
- DSCR +8.8/10.0
- ARV discount +7.5/15.0
- 1% rule +6.3/10.0
- Livability +4.0/5.0
- Rent growth +2.5/5.0
- Condition / age +2.5/5.0
- Schools +2.0/10.0
- Appreciation +0.0/10.0
$225,000
🖨 Deal sheet (PDF) 📄 Offer letter ✓ Due diligence
Multi-family units
County records classify this as Multi-Family (2-4 Unit). Listing-text estimate: 2 units. confirmed
Listing remarks
Fully renovated duplex in Fort Worth with strong rental potential. Each unit offers 1 bed and 1 bath, making it ideal for investors or owner-occupants looking to generate income. Property was recently updated in 2023 and will be delivered vacant at closing, allowing immediate leasing at market rates. Large lot with potential for future expansion or value-add opportunities. Located in a growing area with strong rental demand and convenient access to major roads, shopping, and employment centers.
Key facts
- Future expansion
- Recently updated
- Large lot
Tags
Property features AI
Exterior
- Home design: Built in 1965
- Construction: Originally constructed in 1965
- Exterior features: Located in the Historic Southside subdivision
Neighborhood map
What this means for you Summary
Snapshot
- This is a 2 × 1-bed/1.0-bath units multifamily listed at $225k.
Deal economics
- At list price, monthly cash flow is $572 ($7k/yr) — positive. Per door: $286/mo.
- The deal already cash-flows at list — no discount required.
- Meets the 1% rule at list price ($3k rent vs $225k).
- Recommended offer: $218k (3.0% below list) — sets the bar for market timing.
- Cap rate 9.3% vs local median 3.9% in Fort Worth — top-decile yield for the area; either an underpriced asset or a hidden risk that comps aren't pricing in. Stress-test before assuming the spread holds.
Location & tenants
- Location reads 80/100 on livability (#49 in TX, #1,954 nationally) — a professional / high-income tenant draw. Strengths: amenities A+, cost of living A+, housing A+; Watch: schools D+, crime F.
- Fort Worth ISD (urban): math 18% / reading 28% proficiency, ranked #742 of 826 in TX (top 90%) — low school quality limits family demand, transient renter base, plan for 1-2y turnover; 73% free/reduced lunch — lower-income household profile, screen leases tightly.
- Market conditions: Rents flat; 176 active listings in the ZIP; 9 comparable units currently listed for rent nearby; rentals at typical pace (median 27d on market — plan ~3-4 weeks tenant-placement turnaround); 44% of comp listings sitting > 30 days — soft ceiling on asking rent; 18,938 units permitted in Tarrant County in 2024 (8,336 in 5+ unit buildings).
- At $2,551/mo this rent would consume 50% of the median local household income ($62k/yr) (locally 1060% of renters already pay >50% of income on rent) — very limited rent-growth headroom before tenants either downsize or default.
Forward outlook
- Local home prices are declining (-3.0%/yr); year-one equity from $2k of loan paydown is wiped out by about $7k of value loss. Plan a longer hold.
- Tarrant County population projected at +41% by 2050 — long-run rental-demand tailwind backs the buy-and-hold thesis.
Negotiation context
- It's been on market 41 days — a 3% lower offer ($218k) is reasonable based on typical stale-listing flexibility.
- 2 sale attempts since 2y ago with the ask held roughly flat each time — persistent listings suggest the price (not the market) is what's stuck; bring a comps-based counter.
Risks & watch-outs
- Climate carrying-cost: extreme-heat days projected 7→23/yr by 2055 (HVAC capex compounding) — expect insurance premiums to compound above CPI over the hold.
Questions for the listing agent
- It's been on market 41 days. Have you received any prior offers? Is the seller open to a 3% concession, seller financing, or rate buy-down credit?
- Can we see the unit-by-unit rent roll, current vacancy, and any below-market leases? What's the average tenancy length?
- What capital expenditures (roof, boiler, parking lot, exteriors) have been made in the last 5 years, and what's planned in the next 2?
- Built in 1965 — when were the roof, HVAC, electrical panel, plumbing, and water heater last replaced?
- Is there a deadline driving the sale (1031 exchange, divorce, estate, relocation)? That informs how much negotiation room exists.
- Schools are D-rated, which usually means shorter tenancies and higher turnover. Who's the typical renter profile here, and what's been the actual vacancy rate?
- Crime grade is F in this area — have there been break-ins, vandalism, or insurance claims at this property in the last 3 years? What carrier currently insures it and at what premium?
- What's the average days-on-market for RENTAL listings here right now (not sales)? A rising rental-DOM trend means longer vacancies and softer asking-rent achievability than the comps imply.
- What's the recent tenant-quality profile in this submarket — average credit score on applications, eviction rate, late-payment / NSF rate, and stable-employment percentage? A property-management company in the area should have these aggregated.
- How much new apartment / multifamily construction is in the pipeline within 1–3 miles? Heavy new supply (>2% of stock underway) typically softens rents 12–24 months out; light construction supports rent growth.
Investment metrics
- 1% rule
- 1.13% ✓
- Cap rate
- 9.34%
- Cash-on-cash
- 10.89%
- DSCR
- 1.48
- GRM
- 7.4
CMA / ARV
No comps found within radius.
Projected returns pro-forma
-3.0% appreciation · 0.05% rent growth · sell at horizon
- IRR
- -3.2%
- Equity multiple
- 0.88×
- Total profit
- $-7,416
- Equity at exit
- $33,548
- IRR
- 3.0%
- Equity multiple
- 1.19×
- Total profit
- $11,875
- Equity at exit
- $19,454
Cash invested: $63,000 (down + closing). Projections, not guarantees.
Landlord ↔ Tenant lean methodology
- Overall (STATE)
- 87 Strongly Landlord-Friendly
- State Texas
- 87 Strongly Landlord-Friendly · R+5
- County
- — inherits STATE
- City
- — inherits STATE
ZIP-level market 76104
- Home prices YoY
- -11.6%
- Rents YoY
- 0.1%
- Active inventory
- 176
- Price-to-rent
- 14.7×
Monthly cashflow live
- Estimated rent
- $2,551 high interval (Pro) →
- Mortgage (P&I)
- −$1,180
- Tax from tax record
- −$170 /mo · $2,036/yr
- Insurance
- −$94
- HOA
- −$0
- Lot rent
- −$0
- Vacancy / Maint / Mgmt
- −$536
- Net cashflow
- $572
Break-even live
Sensitivity live
| Price | -10% $699 | -5% $636 | +0% $572 | +5% $508 | +10% $445 |
|---|---|---|---|---|---|
| Rent | -10% $370 | -5% $471 | +0% $572 | +5% $673 | +10% $773 |
| Rate | -1.0pp $685 | -0.5pp $629 | base $572 | +0.5pp $514 | +1.0pp $454 |
2-unit breakdown (identical units grouped — click to expand)
| Units | Beds | Baths | Est. rent |
|---|---|---|---|
| 2× units | 1 | 1 | $2,552 |
| #1 | 1 | 1 | $1,276 |
| #2 | 1 | 1 | $1,276 |
| Total (2 units) | $2,551 | ||
UW: 25.0% down · 7.5% · 30yr · 1.5% tax · 5.0% vac · 8.0% maint · 8.0% mgmt
Financing live
Cash to close
- Down payment
- $56,250
- Closing costs
- $6,750
- Reserves months
- —
- Total cash needed
- —
Loan-product check · same deal, 3 products live
Conventional
25% down · 7.5% · 30yr
- Down + closing
- —
- Monthly P&I
- —
- Monthly cashflow
- —
- DSCR
- —
- Eligible?
- —
Personal DTI + credit; lowest rate.
DSCR
20% down · 8.5% · 30yr
- Down + closing
- —
- Monthly P&I
- —
- Monthly cashflow
- —
- DSCR
- —
- Eligible?
- —
No personal income docs; deal must DSCR.
Hard money
10% down · 12.0% · 12mo
- Down + closing
- —
- Monthly P&I
- —
- Monthly cashflow
- —
- DSCR
- —
- Eligible?
- —
Short-term bridge; refi at stabilization.
Rent comps 9 comps
| Address | Beds | Baths | Sqft | Rent | $/sqft | DOM | Units | Dist |
|---|---|---|---|---|---|---|---|---|
| 1601 E Leuda St Fort Worth, TX | 3.0 | 2.0 | 1197 | $1,750 | $1.46 | 46d | 1 | 0.09mi |
| 1228 E Leuda St Fort Worth, TX | 3.0 | 2.0 | 1388 | $2,100 | $1.51 | 46d | 1 | 0.25mi |
| 1605 E Morphy St Fort Worth, TX | 3.0 | 2.0 | 1090 | $1,425 | $1.31 | 4d | 1 | 0.64mi |
| 1516 E Maddox Ave Fort Worth, TX | 3.0 | 2.0 | 1485 | $1,895 | $1.28 | 24d | 1 | 0.79mi |
| 1327 E Baltimore Ave Fort Worth, TX | 3.0 | 2.0 | 1426 | $1,650 | $1.16 | 26d | 1 | 1.04mi |
| 2104 Daniel St Fort Worth, TX | 3.0 | 2.0 | 1440 | $1,675 | $1.16 | 46d | 1 | 1.13mi |
| 1015 S Jennings Ave Unit 1048 Fort Worth, TX | 3.0 | 2.0 | 1238 | $1,699 | $1.37 | 46d | 1 | 1.31mi |
| 1015 S Jennings Ave Unit 612 Fort Worth, TX | 3.0 | 2.0 | 1238 | $1,699 | $1.37 | 0d | 1 | 1.31mi |
| 1015 S Jennings Ave Unit 3121 Fort Worth, TX | 3.0 | 2.0 | 1238 | $1,656 | $1.34 | 22d | 1 | 1.31mi |
Listing history 30 events
-
2026-06-22days on market $225,000 Active 41 DOM
-
2026-06-21days on market $225,000 Active 40 DOM
-
2026-06-18days on market $225,000 Active 37 DOM
-
2026-06-17pricedays on market $225,000 Active 36 DOM
-
2026-06-16days on market $229,000 Active 35 DOM
-
2026-06-15days on market $229,000 Active 34 DOM
-
2026-06-13days on market $229,000 Active 32 DOM
-
2026-06-09days on market $229,000 Active 28 DOM
-
2026-06-08days on market $229,000 Active 27 DOM
-
2026-06-07days on market $229,000 Active 26 DOM
-
2026-06-04days on market $229,000 Active 23 DOM
-
2026-06-03days on market $229,000 Active 22 DOM
-
2026-06-02days on market $229,000 Active 21 DOM
-
2026-06-02days on market $229,000 Active 20 DOM
-
2026-05-31days on market $229,000 Active 19 DOM
-
2026-05-12$229,000 Active 499-char remark
-
2024-09-24soldstatus
-
2024-08-16historical
-
2024-06-05price $190,000
-
2024-05-17$210,000 Active
-
2023-06-30soldstatus
-
2019-06-18soldstatus
-
2019-04-29soldstatus
-
2019-04-26soldstatus
-
2019-04-24soldstatus
-
1998-11-18soldstatus
-
1998-11-18soldstatus
-
1997-06-06soldstatus
-
1997-06-06soldstatus
-
1996-02-12soldstatus
ⓘ Source: listings_history table (triggers on properties + properties_extension) + one-shot
backfill from property_details.listing_events for pre-trigger history.
Tax reassessment forecast TX · Resets to sale price
- Current annual tax
- $2,036 · $170/mo
- Projected year-2 tax
- $4,118 · $343/mo
- Expected delta
- +$2,082/yr (+$173/mo · 102.3%)
ⓘ Screening estimate from a state-policy table — verify with the county assessor before closing.
Climate risk First Street
- Flood 1/10 Low FEMA zone X (unshaded) · 0% chance over 30 yrs
- Wildfire 1/10 Low
- Heat 8/10 Severe 7 d/yr ≥109°F today · 23 d/yr by 30 yrs out
- Wind 4/10 Moderate 24% chance of damaging wind over 30 yrs
- Air quality 3/10 Moderate 3 unhealthy d/yr today · 4 by 30 yrs out
Nearby sold comps map
Loading sold comps map…
Walkable amenities ~0.75 mi
Loading nearby amenities…
Taxation est. · year 1
- Rental income
- $30,612
- − Mortgage interest
- −$12,603
- − Property taxes
- −$2,036
- − Insurance
- −$1,125
- − Repairs & maintenance
- −$2,449
- − Management
- −$2,449
- − Depreciation
- −$6,545
- Taxable income
- $3,404
- Est. tax owed @ 24.0%
- −$817
- After-tax cash flow
- $6,047/yr
For passive investors: Depreciation is non-cash, so a rental often shows a tax loss while cash-flowing — sheltering income. Rental losses are passive: they offset passive income freely, and up to $25,000/yr can offset ordinary (W-2) income if you actively participate and your MAGI is under $100k (phasing out to $0 by $150k); unused losses carry forward. On sale, claimed depreciation is recaptured at up to 25%, and gains may owe capital-gains tax (a 1031 exchange can defer both). Figures are a year-1 estimate at your 24.0% rate — not tax advice; consult a CPA.
Schools (NCES district)
- District
- Fort Worth ISD
- NCES district ID
- 4819700
- Math proficiency
- 18% ▼ -16.00%
- Reading proficiency
- 28% ▼ -6.00%
- Median HH income
- $42,109
- Composite
- 19.61/100
- National rank
- #8753
- State rank
- #742 of 826 in TX
Livability — Fort Worth
- Score
- 80/100
- State rank
- #49
- US rank
- #1954
Category grades
Schools grade is shown separately in the Schools card above.
Census & demographics
- Census place
- Fort Worth, TX
- County
- Tarrant County · 2,033,669 people
- City population
- 911,619
- Metro
- Dallas-Fort Worth-Arlington, TX
- Population (ZIP)
- 20,443
- Household income
- $61,658
- Rent vs Own
- Severe rent burden
- 1060.0
Population outlook (Tarrant County) Hauer SSP2
- Today (2025)
- 2,380,417 people
- By 2030
- 2,578,900 · +8.3%
- By 2040
- 2,974,995 · +25.0%
- By 2050
- 3,350,489 · +40.8%
- By 2075
- 4,216,909 · +77.2%
- By 2100
- 4,741,527 · +99.2%
Race, ethnicity, and origin ACS 2023
- Neighborhood character
- Diverse neighborhood (Simpson 0.67)
- Race & ethnicity
- Hispanic / Latino 45% Black 28% White 21% Two or more races 17% Asian 2%
- Hispanic origin (detail)
- Mexican 41% Cuban 1%
- Common ancestry
- Lithuanian 1% Italian 1% Arab 1%
- Foreign-born
- 21% · Canada, Vietnam, Philippines
- Languages at home
- 58% English-only · Spanish 37% Arabic 1% Other Indo-European 1%
Political lean MEDSL · Tarrant
- 2024 margin
- Lean R (+5.1) · D 46.7% · R 51.9% · Other 1.4%
- 2008→2024 swing
- +6.6pp toward D · 2008: -11.7pp · 2024: -5.1pp
- All cycles
- 2024: R+5.1 2020: D+0.2 2016: R+8.7 2012: R+15.7 2008: R+11.7
Not yet ingested
- Civics
- —
Market trends
- HPI YoY
- ▼ -36.10%
- Current HPI
- 276.383
- Rent YoY
- ▬ 0.05%
- Metro
- Dallas-Fort Worth-Arlington, TX
- State GDP YoY
- ▲ 3.95%
- F500 in state
- 110
Industry mix (Fortune 500 HQ in TX)
| Industry | F500 HQs | Revenue |
|---|---|---|
| Energy | 16 | $1,198B |
|
||
| Technology | 5 | $198B |
|
||
| Engineering / Construction | 4 | $72B |
|
||
| Energy Services | 3 | $60B |
|
||
| Utilities | 3 | $41B |
|
||
| Healthcare | 2 | $330B |
|
||
Price history
+7.1% since first listed16 events — show timeline
- 2026-06-16 Price Changed $225,000 FSBO.com
- 2026-05-12 Listed $229,000 FSBO.com
- 2024-09-24 Sold (Public Records) — Public Records
- 2024-08-16 Listing Removed — NTREIS
- 2024-06-05 Price Changed $190,000 NTREIS
- 2024-05-17 Listed $210,000 NTREIS
- 2023-06-30 Sold (Public Records) — Public Records
- 2019-06-18 Sold (Public Records) — Public Records
- 2019-04-29 Sold (Public Records) — Public Records
- 2019-04-26 Sold (Public Records) — Public Records
- 2019-04-24 Sold (Public Records) — Public Records
- 1998-11-18 Sold (Public Records) — Public Records
- 1998-11-18 Sold (Public Records) — Public Records
- 1997-06-06 Sold (Public Records) — Public Records
- 1997-06-06 Sold (Public Records) — Public Records
- 1996-02-12 Sold (Public Records) — Public Records
Property tax history
+1.7%/yrLatest (2025): $2,036 · -2.4% YoY. Source: county tax records.
Cash-flow waterfall
monthlySold comps — $/sqft
last 12 mo · ≤1 miLoading sold comps…