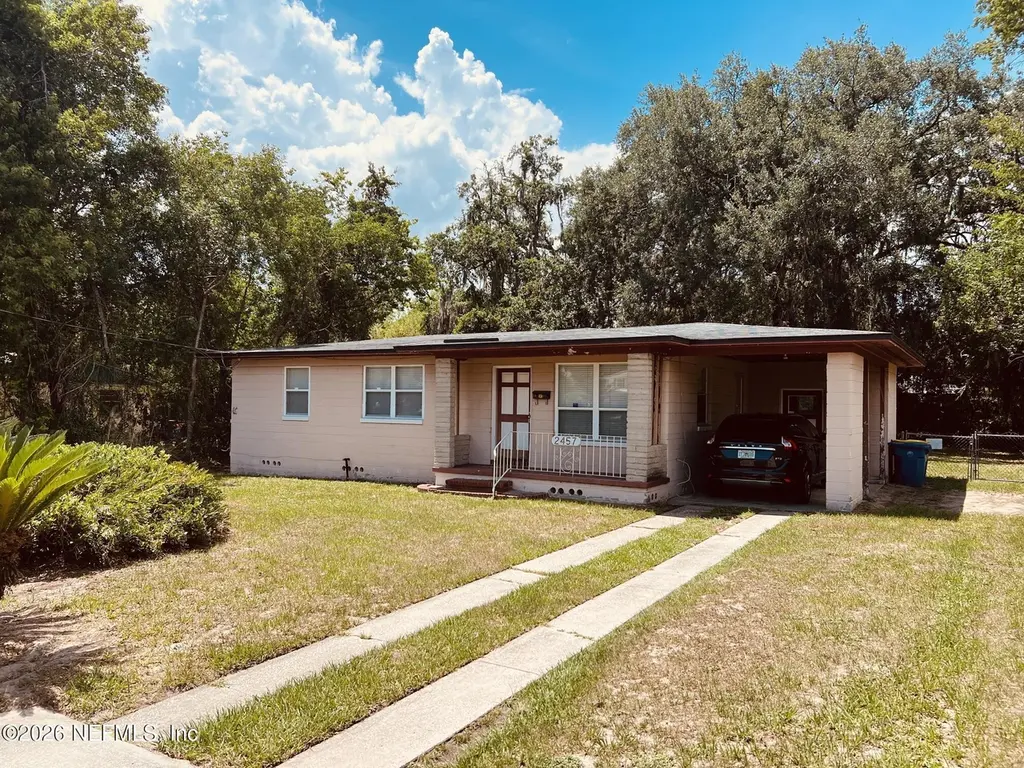
2457 Broward Rd · Jacksonville, FL
Flood risk 7/10 · Major
- FEMA flood zone
- X (unshaded)
- Chance of flooding over 30 yrs
- 0.74%
- Est. flood insurance / yr
- $507 – $1,088
Fire risk 4/10 · Minor
- Est. fire insurance / yr
- $947 – $1,759
Heat risk 9/10 · Severe
- Hot days now (above 107°F)
- 7 days/yr
- Hot days in 30 yrs
- 20 days/yr
Wind risk 9/10 · Severe
- Chance of severe wind over 30 yrs
- 99.0%
Air-quality risk 4/10 · Minor
- Unhealthy air days now
- 6 days/yr
- Unhealthy air days in 30 yrs
- 6 days/yr
Risk factors via First Street. Map © Google.
Why this score? — see what drove the D grade
The composite is a weighted blend of 9 inputs, each scored 0–100. Each bar is that input's sub-score; the figure is the points it added to the 100-point composite (weight × sub-score).
- Cash flow +14.8/30.0
- ARV discount +5.6/15.0
- DSCR +4.5/10.0
- Livability +4.2/5.0
- 1% rule +3.9/10.0
- Schools +3.9/10.0
- Condition / age +2.5/5.0
- Rent growth +2.4/5.0
- Appreciation +0.0/10.0
$190,000
🖨 Deal sheet 📄 Offer letter ✓ Due diligence
Listing remarks
This cozy charmer boasts hardwood floors, large backyard, a new AC and partial river views across the street, accompanied with a river breeze. This prime location offers a convenient lifestyle with easy access to local essentials and major surrounding areas. Schedule your showing today!
Key facts
- Easy access
- Large backyard
- Partial river views
Tags
Property features AI
Exterior
- Parking: Covered carport (1 space)
- Security: Leased security system
- Utilities: Public sewer; Electricity connected
- Home design: Single-family residence; Residential use
- Construction: Block construction; Shingle roof
- Exterior features: Chain-link fencing around backyard; Shed(s) on the property; City street frontage
Interior
- Kitchen: Electric range; Refrigerator
- Bedrooms: 3 bedrooms
- Flooring: Wood flooring
- Bathrooms: 1 full bathroom
- Heating & cooling: Central heating; Electric heating; Heat pump; Central air conditioning
- Interior features: Security system (leased)
- Laundry & utility: Washer hookup; Electric dryer hookup (in carport)
Neighborhood map
What this means for you Summary
Snapshot
- This is a 3-bed/1.0-bath single-family listed at $190k.
Deal economics
- At list price, monthly cash flow is $-14 ($-169/yr) — negative.
- To cash-flow at today's rent, offer at most $188k (1.3% below list).
- To meet the 1% rule (rent ≥ 1% of price), the offer needs to be $169k (11.2% below list).
- Recommended offer: $169k (11.2% below list) — sets the bar for 1% rule.
- Cap rate 6.6% vs local median 4.0% in Jacksonville — top-decile yield for the area; either an underpriced asset or a hidden risk that comps aren't pricing in. Stress-test before assuming the spread holds.
Location & tenants
- Location reads 83/100 on livability (#50 in FL, #911 nationally) — a professional / high-income tenant draw. Strengths: amenities A+, commute A+, housing A+.
- Duval (urban): math 46% / reading 45% proficiency, ranked #48 of 73 in FL (top 66%) — families likely to look elsewhere, expect single-tenant / working-renter base with shorter leases.
- Market conditions: Rents soft (-0.4%/yr); 728 active listings in the ZIP; 38 comparable units currently listed for rent nearby; rentals at typical pace (median 17d on market — plan ~3-4 weeks tenant-placement turnaround); 6,503 units permitted in Duval County in 2024 (1,131 in 5+ unit buildings).
Forward outlook
- Local home prices are declining (-3.0%/yr); year-one equity from $1k of loan paydown is wiped out by about $6k of value loss. Plan a longer hold.
- Duval County population projected at +19% by 2050 — long-run rental-demand tailwind backs the buy-and-hold thesis.
Negotiation context
- Only 7 days on market — expect competitive offers; lowballing is unlikely to land.
- Current owner paid $70k; list at $190k implies a 171% gain — meaningful room to come down on a strong offer.
Risks & watch-outs
- Watch-outs: flood insurance adds $66/mo; built in 1954 — expect roof / HVAC / electrical / plumbing capex.
- Climate carrying-cost: major flood risk; severe wind risk, 99% chance of damaging wind over 30y; extreme-heat days projected 7→20/yr by 2055 (HVAC capex compounding) — expect insurance premiums to compound above CPI over the hold.
Questions for the listing agent
- What do current leases actually rent for vs. the listed asking? Can we see a recent rent roll and the last 12 months of T-12 income?
- Built in 1954 — when were the roof, HVAC, electrical panel, plumbing, and water heater last replaced?
- What's the actual annual flood-insurance premium (NFIP or private), and is the property in a SFHA with mandatory coverage?
- Is there a deadline driving the sale (1031 exchange, divorce, estate, relocation)? That informs how much negotiation room exists.
- Schools are B-rated — typically a magnet for longer-tenancy family renters. What's the average tenant stay here, and is there a school-zone premium baked into asking?
- The area grade is low — what's the realistic commute time and amenity access for the typical tenant pool here? Any planned neighborhood developments (good or bad) we should know about?
- What's the average days-on-market for RENTAL listings here right now (not sales)? A rising rental-DOM trend means longer vacancies and softer asking-rent achievability than the comps imply.
- What's the recent tenant-quality profile in this submarket — average credit score on applications, eviction rate, late-payment / NSF rate, and stable-employment percentage? A property-management company in the area should have these aggregated.
- How much new for-sale + rental construction is in the pipeline within 1–3 miles? Heavy new supply typically softens prices + rents 12–24 months out; constrained supply supports both.
Investment metrics
- 1% rule
- 0.89% ✗
- Cap rate
- 6.62%
- Cash-on-cash
- 1.18%
- DSCR
- 1.05
- GRM
- 9.4
CMA / ARV
- ARV (on-the-fly)
- $182,364
- Comps found
- 12
Show comp detail 12 sales within ~0.75 mi
| Address | Dist | Beds/Ba | Sqft | Sold | Price | $/sf | Match |
|---|---|---|---|---|---|---|---|
| 2434 Leonid Rd | 0.41mi | 3/1.0 | 1,132 (+4%) | 2mo | $179,900 | $159 | 73 |
| 2480 Drake Ave | 0.28mi | 3/1.0 | 984 (-10%) | 7mo | $164,000 | $167 | 65 |
| 2904 Jerry Ln | 0.56mi | 2/1.0 (-1) | 1,059 (-3%) | 2mo | $200,000 | $189 | 62 |
| 10503 Rutgers Rd | 0.48mi | 3/1.0 | 1,036 (-5%) | 12mo | $195,000 | $188 | 59 |
| 2312 Leonid Rd | 0.48mi | 3/1.5 | 1,132 (+4%) | 14mo | $165,000 | $146 | 58 |
| 1821 Wofford Ave | 0.63mi | 4/1.0 (+1) | 1,080 (-1%) | 10mo | $209,900 | $194 | 56 |
| 2864 Leonid Rd | 0.53mi | 3/2.0 | 1,160 (+6%) | 9mo | $170,000 | $147 | 54 |
| 2360 Leonid Rd | 0.43mi | 3/1.0 | 1,231 (+13%) | 7mo | $175,000 | $142 | 53 |
| 2143 Newberry Rd | 0.50mi | 3/1.5 | 1,250 (+14%) | 0mo | $160,200 | $128 | 50 |
| 3040 Date St | 0.70mi | 3/2.0 | 1,040 (-5%) | 13mo | $155,000 | $149 | 45 |
| 10520 Arendal Rd | 0.63mi | 3/1.0 | 1,224 (+12%) | 12mo | $242,000 | $198 | 41 |
| 2915 Tinsley Rd | 0.63mi | 3/2.0 | 1,209 (+11%) | 15mo | $252,000 | $208 | 36 |
Match score weights: distance 35% · size 25% · config 20% · recency 20%. Top-matched comps best support the ARV.
Projected returns pro-forma
-3.0% appreciation · 0.0% rent growth · sell at horizon
- IRR
- -20.3%
- Equity multiple
- 0.31×
- Total profit
- $-36,583
- Equity at exit
- $28,330
- IRR
- -22.2%
- Equity multiple
- 0.02×
- Total profit
- $-51,936
- Equity at exit
- $16,428
Cash invested: $53,200 (down + closing). Projections, not guarantees.
Landlord ↔ Tenant lean methodology
- Overall (STATE)
- 87 Strongly Landlord-Friendly
- State Florida
- 87 Strongly Landlord-Friendly · R+3
- County
- — inherits STATE
- City
- — inherits STATE
ZIP-level market 32218
- Home prices YoY
- -25.7%
- Rents YoY
- -0.4%
- Active inventory
- 728
- Price-to-rent
- 9.4×
Monthly cashflow live
- Estimated rent
- $1,688 high interval (Pro) →
- Mortgage (P&I)
- −$996
- Tax from tax record
- −$206 /mo · $2,466/yr
- Insurance
- −$79
- Flood insurance flood zone
- −$66 /mo · $798/yr
- HOA
- −$0
- Vacancy / Maint / Mgmt
- −$354
- Net cashflow
- $-14
Break-even live
UW: 25.0% down · 7.5% · 30yr · 1.5% tax · 5.0% vac · 8.0% maint · 8.0% mgmt
Financing live
Cash to close
- Down payment
- $47,500
- Closing costs
- $5,700
- Reserves months
- —
- Total cash needed
- —
Loan-product check · same deal, 3 products live
Conventional
25% down · 7.5% · 30yr
- Down + closing
- —
- Monthly P&I
- —
- Monthly cashflow
- —
- DSCR
- —
- Eligible?
- —
Personal DTI + credit; lowest rate.
DSCR
20% down · 8.5% · 30yr
- Down + closing
- —
- Monthly P&I
- —
- Monthly cashflow
- —
- DSCR
- —
- Eligible?
- —
No personal income docs; deal must DSCR.
Hard money
10% down · 12.0% · 12mo
- Down + closing
- —
- Monthly P&I
- —
- Monthly cashflow
- —
- DSCR
- —
- Eligible?
- —
Short-term bridge; refi at stabilization.
Rent comps 38 comps
| Address | Beds | Baths | Sqft | Rent | $/sqft | DOM | Units | Dist |
|---|---|---|---|---|---|---|---|---|
| 2462 Quail Ave Jacksonville, FL | 3.0 | 1.5 | 1312 | $1,397 | $1.06 | 23d | 1 | 0.33mi |
| 2482 Quail Ave Jacksonville, FL | 3.0 | 2.0 | 1224 | $1,850 | $1.51 | 17d | 1 | 0.33mi |
| 2489 Quail Ave Jacksonville, FL | 3.0 | 2.0 | 1308 | $1,495 | $1.14 | 23d | 1 | 0.36mi |
| 2489 Quail Ave Jacksonville, FL | 3.0 | 2.0 | 1306 | $1,495 | $1.14 | 16d | 1 | 0.36mi |
| 10535 Lem Turner Rd Jacksonville, FL | 1.0–4.0 | 1.0–2.0 | 1012 | $1,562 | $1.54 | 3d | 40 | 0.45mi |
| 10735 Merida Dr #14 Jacksonville, FL | 4.0 | 2.0 | 1303 | $1,635 | $1.25 | 7d | 1 | 0.46mi |
| 2950 Bessent Rd Jacksonville, FL | 3.0 | 2.0 | 1446 | $1,779 | $1.23 | 21d | 1 | 0.55mi |
| 2978 Centerwood Dr Jacksonville, FL | 3.0 | 2.0 | 1437 | $1,805 | $1.26 | 23d | 1 | 0.57mi |
| 3029 Bessent Rd Jacksonville, FL | 3.0 | 2.0 | 1330 | $1,750 | $1.32 | 3d | 1 | 0.68mi |
| 9565 Carbondale Dr W Unit B Jacksonville, FL | 3.0 | 2.0 | 1400 | $2,000 | $1.43 | 23d | 1 | 0.82mi |
| 1601 Dunn Ave Jacksonville, FL | 1.0–3.0 | 1.0–2.0 | 852 | $1,575 | $1.85 | 3d | 12 | 0.91mi |
| 11029 Traci Lynn Dr Jacksonville, FL | 3.0 | 2.0 | 1402 | $1,550 | $1.11 | 4d | 1 | 1.03mi |
| 10529 Keuka Dr Jacksonville, FL | 4.0 | 1.0 | 1101 | $600 | $0.54 | 7d | 1 | 1.03mi |
| 11211 Margarets Landing Pl Jacksonville, FL | 3.0 | 2.0 | 1280 | $1,826 | $1.43 | 7d | 1 | 1.06mi |
| 1333 Dunn Ave Jacksonville, FL | 2.0 | 1.0 | 576 | $1,185 | $2.06 | 1d | 16 | 1.09mi |
| 9131 Jefferson Ave Jacksonville, FL | 3.0 | 1.0 | 910 | $1,350 | $1.48 | 4d | 1 | 1.09mi |
| 12802 Haverford Rd Jacksonville, FL | 1.0–3.0 | 1.0–2.0 | 1000 | $1,299 | $1.30 | 1d | 15 | 1.12mi |
| 10561 Ashby Rd Jacksonville, FL | 3.0 | 1.0 | 1034 | $1,181 | $1.14 | 23d | 1 | 1.13mi |
| 9124 Adams Ave Jacksonville, FL | 3.0 | 3.0 | 1207 | $1,800 | $1.49 | 23d | 1 | 1.15mi |
| 10310 Briarcliff Rd E Jacksonville, FL | 3.0 | 2.0 | 1285 | $1,399 | $1.09 | 14d | 1 | 1.16mi |
| 2445 Dunn Ave Jacksonville, FL | 1.0–3.0 | 1.0–2.0 | 850 | $1,815 | $2.14 | 1d | 11 | 1.16mi |
| 2389 Hilly Rd Jacksonville, FL | 3.0 | 1.0 | 908 | $1,650 | $1.82 | 23d | 1 | 1.17mi |
| 1123 Depaul Dr Jacksonville, FL | 3.0 | 1.5 | 1152 | $1,295 | $1.12 | 21d | 1 | 1.23mi |
| 9279 6th Ave Jacksonville, FL | 3.0 | 2.0 | 1150 | $1,245 | $1.08 | 4d | 1 | 1.23mi |
| 11332 Island Shore Dr W Jacksonville, FL | 3.0 | 1.5 | 1178 | $1,703 | $1.45 | 4d | 1 | 1.25mi |
| 9131 4th Ave Jacksonville, FL | 3.0 | 2.0 | 1209 | $1,496 | $1.24 | 21d | 1 | 1.28mi |
| 10964 Bacall Rd W Jacksonville, FL | 3.0 | 1.5 | 1138 | $1,550 | $1.36 | 23d | 1 | 1.28mi |
| 11386 Margarets Landing Pl Jacksonville, FL | 3.0 | 2.0 | 1280 | $1,821 | $1.42 | 21d | 1 | 1.29mi |
| 1033 Ake Ln Jacksonville, FL | 3.0 | 1.0 | 868 | $1,200 | $1.38 | 21d | 1 | 1.33mi |
| 9346 10th Ave Jacksonville, FL | 3.0 | 1.0 | 985 | $1,825 | $1.85 | 23d | 1 | 1.34mi |
| 8910 Adams Ave Jacksonville, FL | 4.0 | 2.0 | 1250 | $1,225 | $0.98 | 3d | 1 | 1.39mi |
| 3015 Lansdell Dr Jacksonville, FL | 3.0 | 1.0 | 1150 | $1,350 | $1.17 | 23d | 1 | 1.40mi |
| 2346 Blossom Ridge Dr N Jacksonville, FL | 3.0 | 2.0 | 1334 | $1,819 | $1.36 | 10d | 1 | 1.41mi |
| 9037 6th Ave Jacksonville, FL | 3.0 | 2.0 | 1156 | $1,400 | $1.21 | 23d | 1 | 1.41mi |
| 8973 4th Ave Jacksonville, FL | 3.0 | 2.0 | 1230 | $1,438 | $1.17 | 14d | 1 | 1.43mi |
| 8918 1st Ave Jacksonville, FL | 3.0 | 2.0 | 1435 | $1,321 | $0.92 | 16d | 1 | 1.43mi |
| 9017 6th Ave Jacksonville, FL | 2.0 | 1.0 | 1038 | $1,098 | $1.06 | 23d | 1 | 1.45mi |
| 9050 7th Ave Jacksonville, FL | 3.0 | 1.0 | 896 | $1,485 | $1.66 | 23d | 1 | 1.46mi |
Listing history 6 events
-
2026-06-10days on market $190,000 Active 7 DOM
-
2026-06-08days on market $190,000 Active 6 DOM
-
2026-06-07days on market $190,000 Active 5 DOM
-
2026-06-05days on market $190,000 Active 2 DOM
-
2026-06-02remarks 287-char remark
-
2026-06-02$190,000 Active 1 DOM
ⓘ Source: listings_history table (triggers on properties + properties_extension) + one-shot
backfill from property_details.listing_events for pre-trigger history.
Tax reassessment forecast FL · Resets to sale price
- Current annual tax
- $2,466 · $206/mo
- Projected year-2 tax
- $2,466 · $206/mo
- Expected delta
- $0/yr ($0/mo · 0.0%)
ⓘ Screening estimate from a state-policy table — verify with the county assessor before closing.
Climate risk First Street
- Flood 7/10 Severe FEMA zone X (unshaded) · 74% chance over 30 yrs
- Wildfire 4/10 Moderate
- Heat 9/10 Extreme 7 d/yr ≥107°F today · 20 d/yr by 30 yrs out
- Wind 9/10 Extreme 99% chance of damaging wind over 30 yrs
- Air quality 4/10 Moderate 6 unhealthy d/yr today · 6 by 30 yrs out
Nearby sold comps map
Loading sold comps map…
Walkable amenities ~0.75 mi
Loading nearby amenities…
Taxation est. · year 1
- Rental income
- $20,255
- − Mortgage interest
- −$10,643
- − Property taxes
- −$2,466
- − Insurance
- −$1,748
- − Repairs & maintenance
- −$1,620
- − Management
- −$1,620
- − Depreciation
- −$5,527
- Taxable loss
- −$3,370
- Est. tax savings @ 24.0%
- +$809
- After-tax cash flow
- $640/yr
For passive investors: Depreciation is non-cash, so a rental often shows a tax loss while cash-flowing — sheltering income. Rental losses are passive: they offset passive income freely, and up to $25,000/yr can offset ordinary (W-2) income if you actively participate and your MAGI is under $100k (phasing out to $0 by $150k); unused losses carry forward. On sale, claimed depreciation is recaptured at up to 25%, and gains may owe capital-gains tax (a 1031 exchange can defer both). Figures are a year-1 estimate at your 24.0% rate — not tax advice; consult a CPA.
Schools (NCES district)
- District
- Duval
- NCES district ID
- 1200480
- Math proficiency
- 46% ▼ -11.00%
- Reading proficiency
- 45% ▼ -4.00%
- Median HH income
- $48,987
- Composite
- 38.97/100
- National rank
- #4076
- State rank
- #48 of 73 in FL
Livability — Jacksonville
- Score
- 83/100
- State rank
- #50
- US rank
- #911
Category grades
Schools grade is shown separately in the Schools card above.
Census & demographics
- Census place
- Jacksonville, FL
- County
- Duval County · 1,015,274 people
- City population
- 979,034
- Metro
- Jacksonville, FL
- Population (ZIP)
- 72,905
- Household income
- $69,638
- Rent vs Own
- Severe rent burden
- 2289.0
Population outlook (Duval County) Hauer SSP2
- Today (2025)
- 1,013,010 people
- By 2030
- 1,059,228 · +4.6%
- By 2040
- 1,141,439 · +12.7%
- By 2050
- 1,205,258 · +19.0%
- By 2075
- 1,324,282 · +30.7%
- By 2100
- 1,319,620 · +30.3%
Race, ethnicity, and origin ACS 2023
- Neighborhood character
- Diverse neighborhood (Simpson 0.64)
- Race & ethnicity
- Black 48% White 35% Hispanic / Latino 9% Two or more races 8% Asian 2%
- Hispanic origin (detail)
- Mexican 2% Puerto Rican 4%
- Common ancestry
- Slovak 1% Lithuanian 1% Italian 1%
- Foreign-born
- 6% · Canada, Jamaica, Vietnam
- Languages at home
- 89% English-only · Spanish 6% French/Haitian/Cajun 1% Tagalog/Filipino 1%
Political lean MEDSL · Duval
- 2024 margin
- Toss-up / Even · D 48.7% · R 50.1% · Other 1.2%
- 2008→2024 swing
- +0.4pp no change · 2008: -1.9pp · 2024: -1.5pp
- All cycles
- 2024: R+1.5 2020: D+3.8 2016: R+1.5 2012: R+3.6 2008: R+1.9
Not yet ingested
- Civics
- —
Market trends
- HPI YoY
- ▼ -90.73%
- Current HPI
- 262.2329
- Rent YoY
- ▼ -0.40%
- Metro
- Jacksonville, FL
- State GDP YoY
- ▲ 3.28%
- F500 in state
- 36
Industry mix (Fortune 500 HQ in FL)
| Industry | F500 HQs | Revenue |
|---|---|---|
| Industrial Technology | 2 | $29B |
|
||
| Insurance | 2 | $17B |
|
||
| Retail | 1 | $60B |
|
||
| Technology Distribution | 1 | $58B |
|
||
| Homebuilding | 1 | $35B |
|
||
| Technology Manufacturing | 1 | $35B |
|
||
Price history
+171.4% since first listed2 events — show timeline
- 2026-05-30 Listed $190,000 realMLS
- 2005-12-20 Sold (Public Records) $70,000 Public Records
Property tax history
+8.9%/yrLatest (2025): $2,466 · +17.2% YoY. Source: county tax records.
Cash-flow waterfall
monthlySold comps — $/sqft
last 12 mo · ≤1 miLoading sold comps…