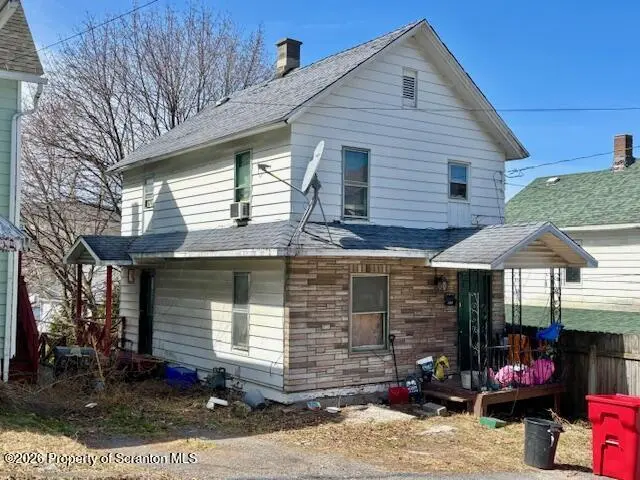
135 Terrace St · Carbondale, PA
Flood risk 5/10 · Moderate
- FEMA flood zone
- X (unshaded)
- Chance of flooding over 30 yrs
- 0.24%
- Est. flood insurance / yr
- $473 – $860
Fire risk 2/10 · Minimal
- Est. fire insurance / yr
- $511 – $949
Heat risk 3/10 · Minor
- Hot days now (above 90°F)
- 8 days/yr
- Hot days in 30 yrs
- 18 days/yr
Wind risk 2/10 · Minimal
- Chance of severe wind over 30 yrs
- 4.0%
Air-quality risk 2/10 · Minimal
- Unhealthy air days now
- 1 days/yr
- Unhealthy air days in 30 yrs
- 1 days/yr
Risk factors via First Street. Map © Google.
Why this score? — see what drove the B grade
The composite is a weighted blend of 9 inputs, each scored 0–100. Each bar is that input's sub-score; the figure is the points it added to the 100-point composite (weight × sub-score).
- Cash flow +30.0/30.0
- ARV discount +11.2/15.0
- DSCR +10.0/10.0
- 1% rule +8.5/10.0
- Livability +3.6/5.0
- Rent growth +2.5/5.0
- Condition / age +2.5/5.0
- Schools +2.0/10.0
- Appreciation +0.0/10.0
$100,000
🖨 Deal sheet 📄 Offer letter ✓ Due diligence
Listing remarks MLS
Must be sold with 72 Spring St. Carbondale MLS# SC-260272. TOTAL ASKING PRICE IS $205,000. Two single family homes. .. live in one and rent the other for income. Current tenant is M2M.
Key facts
- 1,698 sq ft lot
- Built 1920
- Listed 86 days
Neighborhood map
What this means for you Summary
Snapshot
- This is a 3-bed/1.0-bath single-family listed at $100k.
Deal economics
- At list price, monthly cash flow is $375 ($5k/yr) — positive.
- The deal already cash-flows at list — no discount required.
- Meets the 1% rule at list price ($1k rent vs $100k).
- Recommended offer: $94k (6.0% below list) — sets the bar for market timing.
- Cap rate 10.8% vs local median 4.8% in Carbondale — top-decile yield for the area; either an underpriced asset or a hidden risk that comps aren't pricing in. Stress-test before assuming the spread holds.
Location & tenants
- Location reads 72/100 on livability (#648 in PA) — a middle-class / working-renter tenant base. Strengths: crime A+, cost of living A+, housing A+; Watch: amenities D+, schools D, employment D.
- Carbondale Area SD (suburban): math 15% / reading 33% proficiency, ranked #480 of 539 in PA (top 89%) — low school quality limits family demand, transient renter base, plan for 1-2y turnover.
- Market conditions: 110 active listings in the ZIP; 11 comparable units currently listed for rent nearby; rentals leasing fast (median 14d on market — plan ~1-2 weeks tenant-placement turnaround); 251 units permitted in Lackawanna County in 2024 (0 in 5+ unit buildings).
Forward outlook
- Local home prices are declining (-3.0%/yr); year-one equity from $691 of loan paydown is wiped out by about $3k of value loss. Plan a longer hold.
- Lackawanna County population projected to shrink 4% by 2050 — rents likely to lag national; underwrite the cash flow, not the appreciation.
- At projected returns (-3.0% appreciation + 3.0% rent growth), your $28k cash investment doubles in ~8 years — after that, you're playing with house money.
Negotiation context
- It's been on market 86 days — a 6% lower offer ($94k) is reasonable based on typical stale-listing flexibility.
- Current owner paid $60k; list at $100k implies a 66% gain — meaningful room to come down on a strong offer.
Risks & watch-outs
- Watch-outs: built in 1920 — expect roof / HVAC / electrical / plumbing capex.
- Climate carrying-cost: moderate flood risk — expect insurance premiums to compound above CPI over the hold.
Questions for the listing agent
- It's been on market 86 days. Have you received any prior offers? Is the seller open to a 6% concession, seller financing, or rate buy-down credit?
- Built in 1920 — when were the roof, HVAC, electrical panel, plumbing, and water heater last replaced?
- Why hasn't it sold? Are there any deal-killer items the seller is aware of (foundation, flood, title, zoning, code violations)?
- Is there a deadline driving the sale (1031 exchange, divorce, estate, relocation)? That informs how much negotiation room exists.
- Schools are D-rated, which usually means shorter tenancies and higher turnover. Who's the typical renter profile here, and what's been the actual vacancy rate?
- What's the average days-on-market for RENTAL listings here right now (not sales)? A rising rental-DOM trend means longer vacancies and softer asking-rent achievability than the comps imply.
- What's the recent tenant-quality profile in this submarket — average credit score on applications, eviction rate, late-payment / NSF rate, and stable-employment percentage? A property-management company in the area should have these aggregated.
- How much new for-sale + rental construction is in the pipeline within 1–3 miles? Heavy new supply typically softens prices + rents 12–24 months out; constrained supply supports both.
Investment metrics
- 1% rule
- 1.35% ✓
- Cap rate
- 10.80%
- Cash-on-cash
- 16.08%
- DSCR
- 1.72
- GRM
- 6.2
CMA / ARV
- ARV (median comp)
- $108,874
- List price
- $100,000
- Delta
- -8.15%
- Verdict
- FAIR
- Comps
- 20 within 1.0 mi
Show comp detail 12 sales within ~0.75 mi
| Address | Dist | Beds/Ba | Sqft | Sold | Price | $/sf | Match |
|---|---|---|---|---|---|---|---|
| 139 Terrace St | 0.01mi | 2/1.0 (-1) | 934 (-7%) | 6mo | $85,000 | $91 | 78 |
| 42 Archbald St | 0.27mi | 3/2.0 | 950 (-5%) | 1mo | $190,000 | $200 | 75 |
| 122 1/2 Archbald St | 0.44mi | 2/1.0 (-1) | 1,000 (0%) | 1mo | $180,000 | $180 | 74 |
| 37 Washington St | 0.27mi | 3/1.0 | 1,046 (+5%) | 10mo | $182,000 | $174 | 71 |
| 63 8th Ave | 0.05mi | 2/2.0 (-1) | 1,003 (+0%) | 21mo | $90,000 | $90 | 71 |
| 83 Spring St | 0.26mi | 2/1.0 (-1) | 1,015 (+2%) | 14mo | $110,000 | $108 | 68 |
| 12 Harlem Ave | 0.33mi | 2/1.0 (-1) | 1,060 (+6%) | 21mo | $145,000 | $137 | 52 |
| 23 Archbald St | 0.22mi | 3/2.0 | 1,140 (+14%) | 18mo | $138,000 | $121 | 48 |
| 28 Rock St | 0.46mi | 2/1.0 (-1) | 870 (-13%) | 9mo | $73,500 | $84 | 44 |
| 30 Lunny Ct | 0.23mi | 2/1.0 (-1) | 1,150 (+15%) | 20mo | $190,000 | $165 | 43 |
| 94 Brook St | 0.51mi | 2/1.5 (-1) | 1,086 (+9%) | 19mo | $123,000 | $113 | 39 |
| 162 Pike St | 0.53mi | 2/1.5 (-1) | 866 (-13%) | 13mo | $127,000 | $147 | 35 |
Match score weights: distance 35% · size 25% · config 20% · recency 20%. Top-matched comps best support the ARV.
Projected returns pro-forma
-3.0% appreciation · 3.0% rent growth · sell at horizon
- IRR
- 7.1%
- Equity multiple
- 1.28×
- Total profit
- $7,715
- Equity at exit
- $14,910
- IRR
- 16.4%
- Equity multiple
- 2.34×
- Total profit
- $37,575
- Equity at exit
- $8,646
Cash invested: $28,000 (down + closing). Projections, not guarantees.
Landlord ↔ Tenant lean methodology
- Overall (STATE)
- 62 Landlord-Friendly
- State Pennsylvania
- 62 Landlord-Friendly · EVEN
- County
- — inherits STATE
- City
- — inherits STATE
ZIP-level market 18407
- Home prices YoY
- -29.8%
- Active inventory
- 110
- Price-to-rent
- 6.2×
Monthly cashflow live
- Estimated rent
- $1,350 high interval (Pro) →
- Mortgage (P&I)
- −$524
- Tax est. 1.5%
- −$125 /mo · $1,500/yr
- Insurance
- −$42
- HOA
- −$0
- Vacancy / Maint / Mgmt
- −$283
- Net cashflow
- $375
Break-even live
UW: 25.0% down · 7.5% · 30yr · 1.5% tax · 5.0% vac · 8.0% maint · 8.0% mgmt
Financing live
Cash to close
- Down payment
- $25,000
- Closing costs
- $3,000
- Reserves months
- —
- Total cash needed
- —
Loan-product check · same deal, 3 products live
Conventional
25% down · 7.5% · 30yr
- Down + closing
- —
- Monthly P&I
- —
- Monthly cashflow
- —
- DSCR
- —
- Eligible?
- —
Personal DTI + credit; lowest rate.
DSCR
20% down · 8.5% · 30yr
- Down + closing
- —
- Monthly P&I
- —
- Monthly cashflow
- —
- DSCR
- —
- Eligible?
- —
No personal income docs; deal must DSCR.
Hard money
10% down · 12.0% · 12mo
- Down + closing
- —
- Monthly P&I
- —
- Monthly cashflow
- —
- DSCR
- —
- Eligible?
- —
Short-term bridge; refi at stabilization.
Rent comps 11 comps
| Address | Beds | Baths | Sqft | Rent | $/sqft | DOM | Units | Dist |
|---|---|---|---|---|---|---|---|---|
| 151 Wyoming St Carbondale, PA | 3.0 | 1.0 | 1200 | $1,300 | $1.08 | 13d | 1 | 0.01mi |
| 18 Parish Ct Carbondale, PA | 2.0 | 1.0 | 1050 | $1,300 | $1.24 | 13d | 1 | 0.22mi |
| 109 Salem Ave Unit 1Fl Carbondale, PA | 2.0 | 1.0 | 960 | $1,300 | $1.35 | 13d | 1 | 0.25mi |
| 29 Park St Carbondale, PA | 4.0 | 1.5 | 1290 | $1,500 | $1.16 | 44d | 1 | 0.26mi |
| 83 Spring St Carbondale, PA | 2.0 | 1.0 | 1015 | $1,650 | $1.63 | 43d | 1 | 0.27mi |
| 28 Wyoming St Carbondale, PA | 2.0 | 1.0 | 1200 | $1,045 | $0.87 | 43d | 1 | 0.37mi |
| 4 Apple Ave Apt 4 Carbondale, PA | 2.0 | 1.0 | 850 | $1,114 | $1.31 | 21d | 1 | 0.63mi |
| 85 Belmont St Carbondale, PA | 2.0 | 1.0 | 1000 | $1,200 | $1.20 | 13d | 1 | 0.80mi |
| 175 Dundaff St Carbondale, PA | 3.0 | 1.0 | 1300 | $1,300 | $1.00 | 13d | 1 | 0.84mi |
| 25 Richmond St Carbondale, PA | 3.0 | 1.0 | 1500 | $1,300 | $0.87 | 13d | 1 | 0.95mi |
| 37 Green St Carbondale, PA | 3.0 | 1.0 | 707 | $1,375 | $1.94 | 13d | 1 | 0.96mi |
Listing history 19 events
-
2026-06-18days on market $100,000 Active 86 DOM
-
2026-06-17days on market $100,000 Active 85 DOM
-
2026-06-16days on market $100,000 Active 84 DOM
-
2026-06-15days on market $100,000 Active 83 DOM
-
2026-06-14days on market $100,000 Active 81 DOM
-
2026-06-13days on market $100,000 Active 80 DOM
-
2026-06-10days on market $100,000 Active 78 DOM
-
2026-06-09days on market $100,000 Active 77 DOM
-
2026-06-08days on market $100,000 Active 76 DOM
-
2026-06-07days on market $100,000 Active 75 DOM
-
2026-06-05days on market $100,000 Active 72 DOM
-
2026-06-02days on market $100,000 Active 70 DOM
-
2026-06-01days on market $100,000 Active 69 DOM
-
2026-05-31days on market $100,000 Active 68 DOM
-
2026-05-30days on market $100,000 Active 67 DOM
-
2026-03-24$100,000 Active 184-char remark
Show marketing remark (184 chars)
Must be sold with 72 Spring St. Carbondale MLS# SC-260272. TOTAL ASKING PRICE IS $205,000. Two single family homes. .. live in one and rent the other for income. Current tenant is M2M.
-
2006-11-22soldstatus $60,400
-
2004-07-30soldstatus $14,000 127-char remark
Show marketing remark (127 chars)
Starter home, close to town, great investment property. , SqFt Fin - Main: 500.00, SqFt Fin - 3rd: 0.00, SqFt Fin - 2nd: 500.00
-
2000-04-25soldstatus $34,500
ⓘ Source: listings_history table (triggers on properties + properties_extension) + one-shot
backfill from property_details.listing_events for pre-trigger history.
Climate risk First Street
- Flood 5/10 Major FEMA zone X (unshaded) · 24% chance over 30 yrs
- Wildfire 2/10 Low
- Heat 3/10 Moderate 8 d/yr ≥90°F today · 18 d/yr by 30 yrs out
- Wind 2/10 Low 4% chance of damaging wind over 30 yrs
- Air quality 2/10 Low 1 unhealthy d/yr today · 1 by 30 yrs out
Nearby sold comps map
Loading sold comps map…
Walkable amenities ~0.75 mi
Loading nearby amenities…
Taxation est. · year 1
- Rental income
- $16,197
- − Mortgage interest
- −$5,602
- − Property taxes
- −$1,500
- − Insurance
- −$500
- − Repairs & maintenance
- −$1,296
- − Management
- −$1,296
- − Depreciation
- −$2,909
- Taxable income
- $3,095
- Est. tax owed @ 24.0%
- −$743
- After-tax cash flow
- $3,760/yr
For passive investors: Depreciation is non-cash, so a rental often shows a tax loss while cash-flowing — sheltering income. Rental losses are passive: they offset passive income freely, and up to $25,000/yr can offset ordinary (W-2) income if you actively participate and your MAGI is under $100k (phasing out to $0 by $150k); unused losses carry forward. On sale, claimed depreciation is recaptured at up to 25%, and gains may owe capital-gains tax (a 1031 exchange can defer both). Figures are a year-1 estimate at your 24.0% rate — not tax advice; consult a CPA.
Schools (NCES district)
- District
- Carbondale Area SD
- NCES district ID
- 4204980
- Math proficiency
- 15% ▼ -14.00%
- Reading proficiency
- 33% ▼ -23.00%
- Median HH income
- $35,070
- Composite
- 19.73/100
- National rank
- #8714
- State rank
- #480 of 539 in PA
Livability — Carbondale
- Score
- 72/100
- State rank
- #648
- US rank
- #6298
Category grades
Schools grade is shown separately in the Schools card above.
Census & demographics
- Census place
- Carbondale, PA
- County
- Lackawanna County · 134,448 people
- City population
- 14,445
- Metro
- Scranton--Wilkes-Barre, PA
- Population (ZIP)
- 14,445
- Household income
- $59,652
- Rent vs Own
- Severe rent burden
- 430.0
Population outlook (Lackawanna County) Hauer SSP2
- Today (2025)
- 210,652 people
- By 2030
- 208,623 · -1.0%
- By 2040
- 203,980 · -3.2%
- By 2050
- 201,069 · -4.5%
- By 2075
- 205,026 · -2.7%
- By 2100
- 210,851 · +0.1%
Race, ethnicity, and origin ACS 2023
- Neighborhood character
- Predominantly White (85%)
- Race & ethnicity
- White 85% Hispanic / Latino 9% Two or more races 6% Black 1% Asian 1%
- Hispanic origin (detail)
- Mexican 2% Puerto Rican 5%
- Common ancestry
- Romanian 11% Scotch-Irish 3% Subsaharan African 1%
- Foreign-born
- 2% · Canada, Vietnam
- Languages at home
- 95% English-only · Spanish 3% Other Indo-European 1% Russian/Polish/Slavic 1%
Political lean MEDSL · Lackawanna
- 2024 margin
- Toss-up / Even · D 51.0% · R 48.3%
- 2008→2024 swing
- -23.2pp toward R · 2008: 26.0pp · 2024: 2.8pp
- All cycles
- 2024: D+2.8 2020: D+8.4 2016: D+3.4 2012: D+27.4 2008: D+26.0
Not yet ingested
- Civics
- —
Market trends
- HPI YoY
- ▼ -59.46%
- Current HPI
- 140.1227
- Rent YoY
- —
- Metro
- Scranton--Wilkes-Barre, PA
- State GDP YoY
- ▲ 1.68%
- F500 in state
- 34
Industry mix (Fortune 500 HQ in PA)
| Industry | F500 HQs | Revenue |
|---|---|---|
| Healthcare | 2 | $309B |
|
||
| Insurance | 2 | $27B |
|
||
| Telecommunications / Media | 1 | $124B |
|
||
| Industrial Distribution | 1 | $22B |
|
||
| Financial Services | 1 | $20B |
|
||
| Chemicals / Materials | 1 | $18B |
|
||
Price history
+189.9% since first listed4 events — show timeline
- 2026-03-24 Listed $100,000 GSBR as distributed by MLS GRID
- 2006-11-22 Sold (Public Records) $60,400 Public Records
- 2004-07-30 Sold (MLS) $14,000 GSBR as distributed by MLS GRID
- 2000-04-25 Sold (MLS) $34,500 GSBR as distributed by MLS GRID
Property tax history
+27.0%/yrLatest (2026): $21,771 · +1069.4% YoY. Source: county tax records.
Cash-flow waterfall
monthlySold comps — $/sqft
last 12 mo · ≤1 miLoading sold comps…