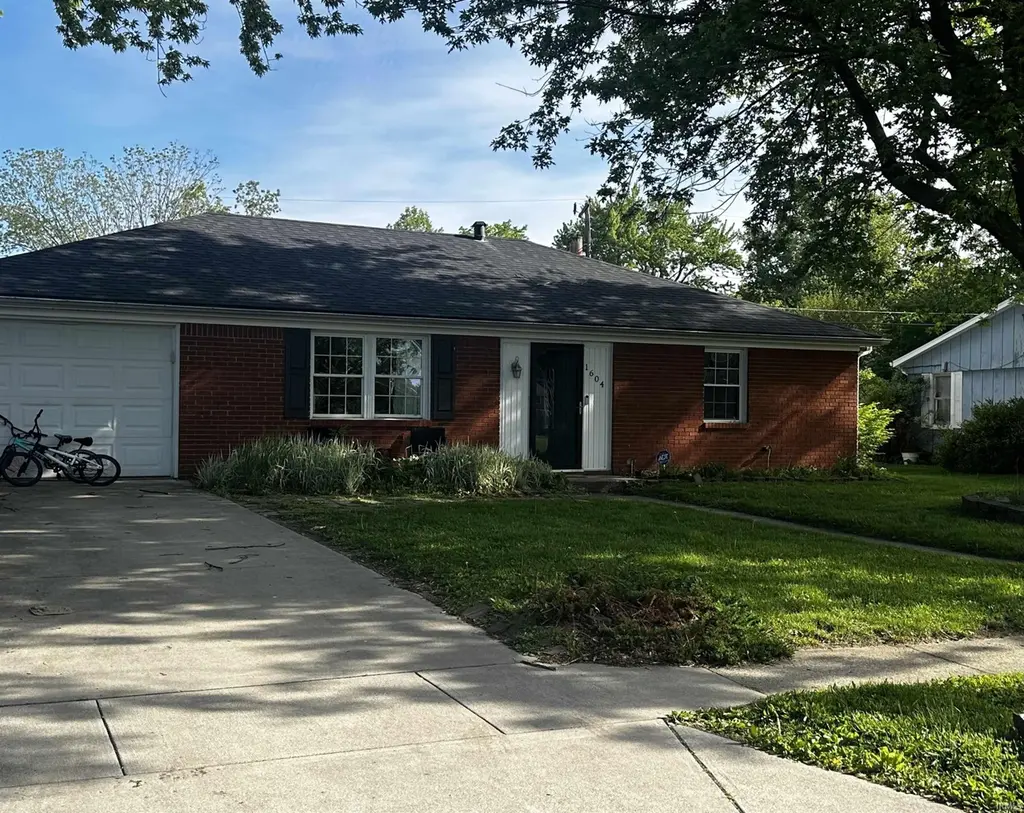
1604 Tam O Shanter Ln · Kokomo, IN
Flood risk 1/10 · Minimal
- FEMA flood zone
- X (unshaded)
- Chance of flooding over 30 yrs
- 0.0%
- Est. flood insurance / yr
- $507 – $1,088
Fire risk 1/10 · Minimal
- Est. fire insurance / yr
- $717 – $1,331
Heat risk 3/10 · Minor
- Hot days now (above 101°F)
- 7 days/yr
- Hot days in 30 yrs
- 17 days/yr
Wind risk 2/10 · Minimal
- Chance of severe wind over 30 yrs
- 0.0%
Air-quality risk 3/10 · Minor
- Unhealthy air days now
- 1 days/yr
- Unhealthy air days in 30 yrs
- 3 days/yr
Risk factors via First Street. Map © Google.
Why this score? — see what drove the D+ grade
The composite is a weighted blend of 9 inputs, each scored 0–100. Each bar is that input's sub-score; the figure is the points it added to the 100-point composite (weight × sub-score).
- Cash flow +14.5/30.0
- ARV discount +13.5/15.0
- DSCR +4.4/10.0
- Livability +3.4/5.0
- 1% rule +3.3/10.0
- Rent growth +3.0/5.0
- Condition / age +2.5/5.0
- Schools +2.1/10.0
- Appreciation +0.0/10.0
$164,900
🖨 Deal sheet (PDF) 📄 Offer letter ✓ Due diligence
Listing remarks
Spacious 3-bedroom, 1-bath home offering over 1,500 sq ft in desirable Country Club Hills! Features include a large family room with a beautiful stone fireplace, generous living space, and a functional layout perfect for everyday living. Enjoy the large back deck overlooking the fenced backyard great for entertaining or relaxing outdoors. New electric water heater recently installed. Conveniently located close to shopping, dining, schools, and other amenities.
Key facts
- Large back deck
- Large family room
- Stone fireplace
Tags
Property features AI
Finance
- HOA & community: No association amenities
Exterior
- Parking: Attached garage (1 space)
- Security: Smoke detectors
- Utilities: Public water; Public sewer; Cable available
- Home design: Single-family residence, site-built; One story
- Construction: Brick construction; Asphalt roof; Slab foundation; Built as single-story (above-grade finished area listed)
- Exterior features: Deck; Irregular lot (approx. 67 x 113, 0.18 acres)
Interior
- Kitchen: Eat-in kitchen with kitchen island; Disposal, Dishwasher, Microwave, Refrigerator
- Bedrooms: Total rooms: 6
- Bathrooms: 1 full bathroom (main level)
- Heating & cooling: Wood stove; Natural gas heating with forced air; Central air; Ceiling fans
- Interior features: Ceiling fans; Eat-in kitchen; Kitchen island; Window treatments; Disposal; Dishwasher; Microwave; Refrigerator; Wood-burning stove fireplace in family room
- Laundry & utility: Electric dryer hookup on main level
Neighborhood map
What this means for you Summary
Snapshot
- This is a 3-bed/1.0-bath single-family listed at $165k.
Deal economics
- At list price, monthly cash flow is $37 ($441/yr) — positive.
- The deal already cash-flows at list — no discount required.
- To meet the 1% rule (rent ≥ 1% of price), the offer needs to be $137k (17.0% below list).
- Recommended offer: $137k (17.0% below list) — sets the bar for 1% rule.
- Cap rate 6.6% vs local median 5.2% in Kokomo — meaningfully above typical; check what's discounted (condition, days-on-market, listing class) to confirm the premium yield is real.
Location & tenants
- Location reads 68/100 on livability (#227 in IN) — a middle-class / working-renter tenant base. Strengths: cost of living A+, housing A+, health & safety A; Watch: crime D, amenities F, commute F.
- Kokomo School Corporation (urban): math 22% / reading 30% proficiency, ranked #264 of 301 in IN (top 88%) — low school quality limits family demand, transient renter base, plan for 1-2y turnover; 62% free/reduced lunch — lower-income household profile, screen leases tightly.
- Zoned schools: Boulevard Elementary School (math 32% / reading 17%, grade F, #762 of 994 statewide, top 78%, 378 students, 57% FRL); Central Middle School (math 23% / reading 38%, grade F, #203 of 330 statewide, top 63%, 458 students, 57% FRL); Kokomo High School (math 19% / reading 48%, grade F, #289 of 369 statewide, top 78%, 1,519 students, 58% FRL) — zoned schools at 58% FRL track the district average.
- Market conditions: Rents rising (+1.8%/yr); 235 active listings in the ZIP; 194 units permitted in Howard County in 2024 (0 in 5+ unit buildings).
Forward outlook
- Local home prices are declining (-3.0%/yr); year-one equity from $1k of loan paydown is wiped out by about $5k of value loss. Plan a longer hold.
- Howard County population projected at -11% by 2050 — secular population decline; favor cash flow + early exit over multi-decade hold.
Negotiation context
- It's been on market 41 days — a 3% lower offer ($160k) is reasonable based on typical stale-listing flexibility.
- Current owner paid $72k; list at $165k implies a 127% gain — meaningful room to come down on a strong offer.
Questions for the listing agent
- It's been on market 41 days. Have you received any prior offers? Is the seller open to a 17% concession, seller financing, or rate buy-down credit?
- Built in 1965 — when were the roof, HVAC, electrical panel, plumbing, and water heater last replaced?
- Is there a deadline driving the sale (1031 exchange, divorce, estate, relocation)? That informs how much negotiation room exists.
- Schools are F-rated, which usually means shorter tenancies and higher turnover. Who's the typical renter profile here, and what's been the actual vacancy rate?
- Crime grade is D in this area — have there been break-ins, vandalism, or insurance claims at this property in the last 3 years? What carrier currently insures it and at what premium?
- The area grade is low — what's the realistic commute time and amenity access for the typical tenant pool here? Any planned neighborhood developments (good or bad) we should know about?
- What's the average days-on-market for RENTAL listings here right now (not sales)? A rising rental-DOM trend means longer vacancies and softer asking-rent achievability than the comps imply.
- What's the recent tenant-quality profile in this submarket — average credit score on applications, eviction rate, late-payment / NSF rate, and stable-employment percentage? A property-management company in the area should have these aggregated.
- How much new for-sale + rental construction is in the pipeline within 1–3 miles? Heavy new supply typically softens prices + rents 12–24 months out; constrained supply supports both.
Investment metrics
- 1% rule
- 0.83% ✗
- Cap rate
- 6.56%
- Cash-on-cash
- 0.96%
- DSCR
- 1.04
- GRM
- 10.0
CMA / ARV
- ARV (on-the-fly)
- $190,320
- Comps found
- 12
Show comp detail 12 sales within ~0.75 mi
| Address | Dist | Beds/Ba | Sqft | Sold | Price | $/sf | Match |
|---|---|---|---|---|---|---|---|
| 2505 S Park Rd | 0.38mi | 3/1.5 | 1,556 (-0%) | 6mo | $195,000 | $125 | 75 |
| 2325 Balmoral Blvd | 0.19mi | 3/2.0 | 1,386 (-11%) | 4mo | $142,500 | $103 | 65 |
| 2449 Tam O Shanter Rd | 0.21mi | 3/1.0 | 1,344 (-14%) | 4mo | $140,000 | $104 | 64 |
| 1409 Conti Ln | 0.20mi | 3/2.0 | 1,384 (-11%) | 9mo | $189,500 | $137 | 61 |
| 2214 S Indiana Ave | 0.71mi | 3/1.5 | 1,552 (-0%) | 8mo | $187,300 | $121 | 57 |
| 1212 W Boulevard St | 0.28mi | 2/2.5 (-1) | 1,364 (-13%) | 0mo | $137,000 | $100 | 55 |
| 1106 W Boulevard St | 0.33mi | 2/2.5 (-1) | 1,364 (-13%) | 1mo | $122,000 | $89 | 52 |
| 1723 N Osage Dr | 0.64mi | 3/2.0 | 1,470 (-6%) | 8mo | $225,000 | $153 | 50 |
| 806 James Dr | 0.56mi | 3/1.5 | 1,764 (+13%) | 1mo | $183,000 | $104 | 49 |
| 721 W Boulevard | 0.66mi | 2/1.0 (-1) | 1,402 (-10%) | 5mo | $184,200 | $131 | 44 |
| 1729 N Osage Dr | 0.65mi | 3/2.0 | 1,748 (+12%) | 6mo | $213,000 | $122 | 41 |
| 521 Holly Ln | 0.75mi | 4/2.0 (+1) | 1,736 (+11%) | 3mo | $215,000 | $124 | 35 |
Match score weights: distance 35% · size 25% · config 20% · recency 20%. Top-matched comps best support the ARV.
Projected returns pro-forma
-3.0% appreciation · 1.8% rent growth · sell at horizon
- IRR
- -16.1%
- Equity multiple
- 0.44×
- Total profit
- $-26,051
- Equity at exit
- $24,587
- IRR
- -9.8%
- Equity multiple
- 0.43×
- Total profit
- $-26,367
- Equity at exit
- $14,258
Cash invested: $46,172 (down + closing). Projections, not guarantees.
Landlord ↔ Tenant lean methodology
- Overall (STATE)
- 90 Strongly Landlord-Friendly
- State Indiana
- 90 Strongly Landlord-Friendly · R+11
- County
- — inherits STATE
- City
- — inherits STATE
ZIP-level market 46902
- Home prices YoY
- -20.7%
- Rents YoY
- 1.8%
- Active inventory
- 235
- Price-to-rent
- 10.0×
Monthly cashflow live
- Estimated rent
- $1,369 medium interval (Pro) →
- Mortgage (P&I)
- −$865
- Tax from tax record
- −$112 /mo · $1,340/yr
- Insurance
- −$69
- HOA
- −$0
- Vacancy / Maint / Mgmt
- −$288
- Net cashflow
- $37
Break-even live
Sensitivity live
| Price | -10% $130 | -5% $83 | +0% $37 | +5% $-10 | +10% $-57 |
|---|---|---|---|---|---|
| Rent | -10% $-71 | -5% $-17 | +0% $37 | +5% $91 | +10% $145 |
| Rate | -1.0pp $120 | -0.5pp $79 | base $37 | +0.5pp $-6 | +1.0pp $-49 |
UW: 25.0% down · 7.5% · 30yr · 1.5% tax · 5.0% vac · 8.0% maint · 8.0% mgmt
Financing live
Cash to close
- Down payment
- $41,225
- Closing costs
- $4,947
- Reserves months
- —
- Total cash needed
- —
Loan-product check · same deal, 3 products live
Conventional
25% down · 7.5% · 30yr
- Down + closing
- —
- Monthly P&I
- —
- Monthly cashflow
- —
- DSCR
- —
- Eligible?
- —
Personal DTI + credit; lowest rate.
DSCR
20% down · 8.5% · 30yr
- Down + closing
- —
- Monthly P&I
- —
- Monthly cashflow
- —
- DSCR
- —
- Eligible?
- —
No personal income docs; deal must DSCR.
Hard money
10% down · 12.0% · 12mo
- Down + closing
- —
- Monthly P&I
- —
- Monthly cashflow
- —
- DSCR
- —
- Eligible?
- —
Short-term bridge; refi at stabilization.
Listing history 19 events
-
2026-06-21days on market $164,900 Active 41 DOM
-
2026-06-19days on market $164,900 Active 39 DOM
-
2026-06-18days on market $164,900 Active 38 DOM
-
2026-06-17days on market $164,900 Active 37 DOM
-
2026-06-16days on market $164,900 Active 36 DOM
-
2026-06-15days on market $164,900 Active 35 DOM
-
2026-06-14days on market $164,900 Active 33 DOM
-
2026-06-13days on market $164,900 Active 32 DOM
-
2026-06-10days on market $164,900 Active 30 DOM
-
2026-06-09days on market $164,900 Active 29 DOM
-
2026-06-08days on market $164,900 Active 28 DOM
-
2026-06-07pricedays on market $164,900 Active 27 DOM
-
2026-06-02days on market $169,900 Active 22 DOM
-
2026-06-01days on market $169,900 Active 21 DOM
-
2026-05-31days on market $169,900 Active 20 DOM
-
2026-05-30days on market $169,900 Active 19 DOM
-
2026-05-19price $169,900
-
2026-05-11$174,900 Active
-
1998-07-16soldstatus $72,500
ⓘ Source: listings_history table (triggers on properties + properties_extension) + one-shot
backfill from property_details.listing_events for pre-trigger history.
Tax reassessment forecast IN · Partial reset (capped growth)
- Current annual tax
- $1,340 · $112/mo
- Projected year-2 tax
- $1,371 · $114/mo
- Expected delta
- +$31/yr (+$3/mo · 2.3%)
ⓘ Screening estimate from a state-policy table — verify with the county assessor before closing.
Climate risk First Street
- Flood 1/10 Low FEMA zone X (unshaded) · 0% chance over 30 yrs
- Wildfire 1/10 Low
- Heat 3/10 Moderate 7 d/yr ≥101°F today · 17 d/yr by 30 yrs out
- Wind 2/10 Low 0% chance of damaging wind over 30 yrs
- Air quality 3/10 Moderate 1 unhealthy d/yr today · 3 by 30 yrs out
Nearby sold comps map
Loading sold comps map…
Walkable amenities ~0.75 mi
Loading nearby amenities…
Taxation est. · year 1
- Rental income
- $16,434
- − Mortgage interest
- −$9,237
- − Property taxes
- −$1,340
- − Insurance
- −$824
- − Repairs & maintenance
- −$1,315
- − Management
- −$1,315
- − Depreciation
- −$4,797
- Taxable loss
- −$2,394
- Est. tax savings @ 24.0%
- +$575
- After-tax cash flow
- $1,016/yr
For passive investors: Depreciation is non-cash, so a rental often shows a tax loss while cash-flowing — sheltering income. Rental losses are passive: they offset passive income freely, and up to $25,000/yr can offset ordinary (W-2) income if you actively participate and your MAGI is under $100k (phasing out to $0 by $150k); unused losses carry forward. On sale, claimed depreciation is recaptured at up to 25%, and gains may owe capital-gains tax (a 1031 exchange can defer both). Figures are a year-1 estimate at your 24.0% rate — not tax advice; consult a CPA.
Schools (NCES district)
- District
- Kokomo School Corporation
- NCES district ID
- 1805370
- Math proficiency
- 22% ▼ -8.00%
- Reading proficiency
- 30% ▼ -5.00%
- Median HH income
- $35,804
- Composite
- 21.5/100
- National rank
- #8325
- State rank
- #264 of 301 in IN
Livability — Kokomo
- Score
- 68/100
- State rank
- #227
- US rank
- #9912
Category grades
Schools grade is shown separately in the Schools card above.
Census & demographics
- Census place
- Kokomo, IN
- County
- Howard County · 75,099 people
- City population
- 75,099
- Metro
- Kokomo, IN
- Population (ZIP)
- 37,017
- Household income
- $62,126
- Rent vs Own
- Severe rent burden
- 1262.0
Population outlook (Howard County) Hauer SSP2
- Today (2025)
- 81,522 people
- By 2030
- 80,104 · -1.7%
- By 2040
- 76,708 · -5.9%
- By 2050
- 72,880 · -10.6%
- By 2075
- 64,016 · -21.5%
- By 2100
- 51,705 · -36.6%
Race, ethnicity, and origin ACS 2023
- Neighborhood character
- Predominantly White (81%)
- Race & ethnicity
- White 81% Black 9% Two or more races 5% Hispanic / Latino 4% Asian 3%
- Common ancestry
- Italian 2% Lithuanian 1% Slovak 1%
- Foreign-born
- 3% · Canada, Vietnam, China
- Languages at home
- 96% English-only · Vietnamese 1% Other Asian/Pacific 1% Spanish 1%
Political lean MEDSL · Howard
- 2024 margin
- Solid R (+35.3) · D 31.4% · R 66.7% · Other 1.8%
- 2008→2024 swing
- -29.1pp toward R · 2008: -6.2pp · 2024: -35.3pp
- All cycles
- 2024: R+35.3 2020: R+32.4 2016: R+33.9 2012: R+14.3 2008: R+6.2
Not yet ingested
- Civics
- —
Market trends
- HPI YoY
- ▼ -61.76%
- Current HPI
- 236.8237
- Rent YoY
- ▲ 1.80%
- Metro
- Kokomo, IN
- State GDP YoY
- ▲ 2.90%
- F500 in state
- 18
Industry mix (Fortune 500 HQ in IN)
| Industry | F500 HQs | Revenue |
|---|---|---|
| Industrial Machinery | 2 | $37B |
|
||
| Healthcare | 1 | $177B |
|
||
| Pharmaceuticals | 1 | $45B |
|
||
| Metals / Steel | 1 | $18B |
|
||
| Agriculture | 1 | $17B |
|
||
| Packaging | 1 | $12B |
|
||
Price history
+134.3% since first listed3 events — show timeline
- 2026-05-19 Price Changed $169,900 IRMLS
- 2026-05-11 Listed $174,900 IRMLS
- 1998-07-16 Sold (Public Records) $72,500 Public Records
Property tax history
+12.9%/yrLatest (2024): $1,340 · +8.2% YoY. Source: county tax records.
Cash-flow waterfall
monthlySold comps — $/sqft
last 12 mo · ≤1 miLoading sold comps…