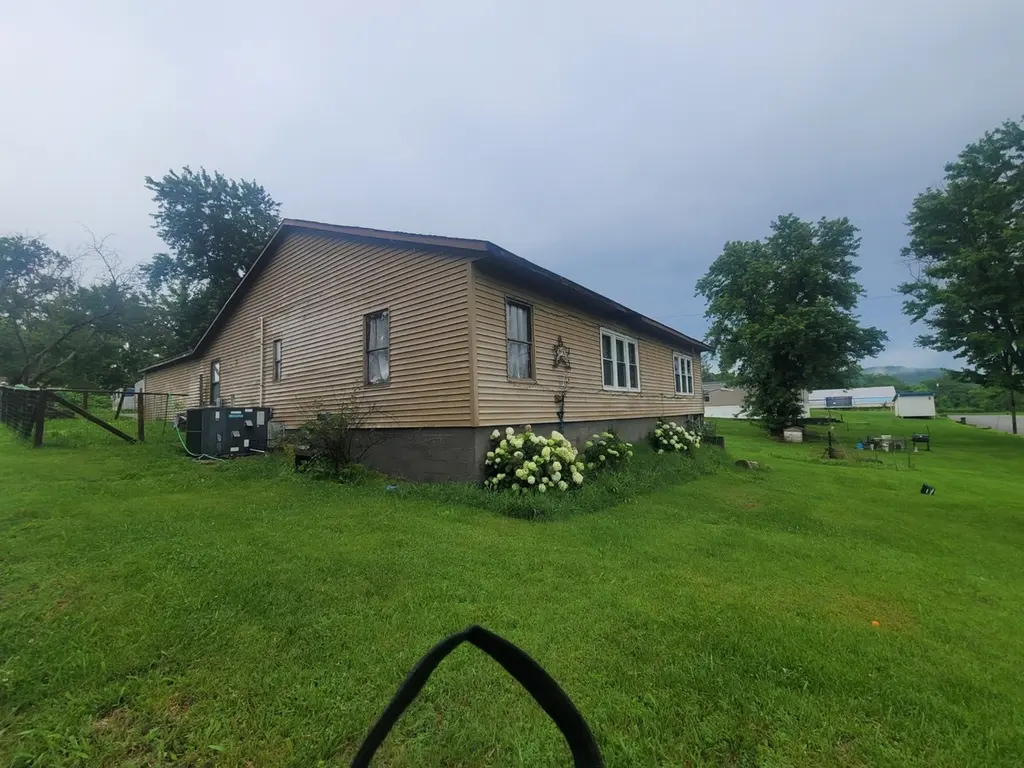
95 Middle Ave · Simpson, IL
Flood risk 1/10 · Minimal
- FEMA flood zone
- —
- Chance of flooding over 30 yrs
- 0.0%
- Est. flood insurance / yr
- —
Fire risk 2/10 · Minimal
- Est. fire insurance / yr
- $804 – $1,492
Heat risk 5/10 · Moderate
- Hot days now (above 108°F)
- 7 days/yr
- Hot days in 30 yrs
- 22 days/yr
Wind risk 3/10 · Minor
- Chance of severe wind over 30 yrs
- 4.0%
Air-quality risk 2/10 · Minimal
- Unhealthy air days now
- 0 days/yr
- Unhealthy air days in 30 yrs
- 1 days/yr
Risk factors via First Street. Map © Google.
Why this score? — see what drove the B grade
The composite is a weighted blend of 9 inputs, each scored 0–100. Each bar is that input's sub-score; the figure is the points it added to the 100-point composite (weight × sub-score).
- Cash flow +29.8/30.0
- DSCR +10.0/10.0
- Appreciation +8.6/10.0
- ARV discount +7.5/15.0
- 1% rule +7.3/10.0
- Livability +2.9/5.0
- Rent growth +2.5/5.0
- Condition / age +2.5/5.0
- Schools +2.4/10.0
$99,000
🖨 Deal sheet 📄 Offer letter ✓ Due diligence
Listing remarks
Great opportunity for homeowners and investors alike! This 3-bedroom, 1-bath ranch offers an attached garage, a spacious lot, and the charm of small-town living in Simpson. The home features a functional floor plan and is ready for your personal updates and finishing touches. Buyers looking to build equity may appreciate the opportunity to customize the home to fit their own style, needs, and preferences. The property needs cosmetic updates but offers an excellent opportunity for a fix-and-flip, rental. First time home buyers may apply for a 203(k) loan to explore the possibility of allowing you to transform this home into your own personal vision all while still being affordable. Ask for m
Key facts
- Attached garage
- Spacious lot
- 0.31 acre lot
Tags
Property features AI
Finance
- Other: Property is in unincorporated Johnson Township; Directions: IL-147 to Simpson, turn onto Middle Ave; property on the south side of the street
- HOA & community: No master association fees required
Exterior
- Parking: Attached garage with space for 2 vehicles (2 total parking spaces)
- Utilities: Septic tank sewer service; Natural gas available; Electric service (standard)
- Home design: Detached single-family home; One-story layout; Fee simple ownership
- Construction: Vinyl siding; Estimated age 41–50 years; Not rebuilt or recently rehabbed; Built after 1978
- Exterior features: Lot dimensions approximately 100 x 135; Lot about a quarter to half acre
Interior
- Kitchen: Main-level kitchen approx. 10 x 12
- Bedrooms: Three bedrooms (all on the main level); Primary bedroom on the main level with full bath attached; Bedroom 2 (main level) approx. 10 x 12; Bedroom 3 (main level) approx. 10 x 12
- Bathrooms: Two full bathrooms
- Heating & cooling: Natural gas heating; Central air conditioning
- Interior features: Seven total rooms
- Laundry & utility: Main-level laundry room approx. 5 x 7
Neighborhood map
What this means for you Summary
Snapshot
- This is a 3-bed/2.0-bath single-family listed at $99k.
Deal economics
- At list price, monthly cash flow is $362 ($4k/yr) — positive.
- The deal already cash-flows at list — no discount required.
- Meets the 1% rule at list price ($1k rent vs $99k).
Location & tenants
- Location reads 58/100 on livability (#1,105 in IL) — a working-class tenant base; expect higher turnover. Strengths: cost of living A+, housing A+; Watch: employment C-, crime D-, amenities F.
- Vienna Hsd 133 (rural): math 15% / reading 35% proficiency, ranked #630 of 919 in IL (top 69%) — low school quality limits family demand, transient renter base, plan for 1-2y turnover.
- Zoned schools: Vienna High School (math 12% / reading 27%, grade F, #397 of 693 statewide, top 61%, 322 students, 0% FRL).
- Market conditions: 5 active listings in the ZIP.
Forward outlook
- In year one you build about $8k of equity ($684 loan paydown + $7k appreciation (7.1% local appreciation)).
- Johnson County population projected at +4% by 2050 — modest demand growth; plan on rents tracking national, not racing it.
- At projected returns (7.1% appreciation + 3.0% rent growth), your $28k cash investment doubles in ~3 years — after that, you're playing with house money.
- By year 5, paydown + projected appreciation supports a ~$35k cash-out refi (75% LTV) — recoverable capital for the next deal without selling this one.
Negotiation context
- Only 3 days on market — expect competitive offers; lowballing is unlikely to land.
Risks & watch-outs
- Climate carrying-cost: extreme-heat days projected 7→22/yr by 2055 (HVAC capex compounding) — expect insurance premiums to compound above CPI over the hold.
Questions for the listing agent
- Is there a deadline driving the sale (1031 exchange, divorce, estate, relocation)? That informs how much negotiation room exists.
- Schools are F-rated, which usually means shorter tenancies and higher turnover. Who's the typical renter profile here, and what's been the actual vacancy rate?
- Crime grade is D in this area — have there been break-ins, vandalism, or insurance claims at this property in the last 3 years? What carrier currently insures it and at what premium?
- What's the average days-on-market for RENTAL listings here right now (not sales)? A rising rental-DOM trend means longer vacancies and softer asking-rent achievability than the comps imply.
- What's the recent tenant-quality profile in this submarket — average credit score on applications, eviction rate, late-payment / NSF rate, and stable-employment percentage? A property-management company in the area should have these aggregated.
- How much new for-sale + rental construction is in the pipeline within 1–3 miles? Heavy new supply typically softens prices + rents 12–24 months out; constrained supply supports both.
Investment metrics
- 1% rule
- 1.23% ✓
- Cap rate
- 10.68%
- Cash-on-cash
- 15.68%
- DSCR
- 1.70
- GRM
- 6.8
CMA / ARV
No comps found within radius.
Projected returns pro-forma
7.13% appreciation · 3.0% rent growth · sell at horizon
- IRR
- 30.6%
- Equity multiple
- 3.11×
- Total profit
- $58,404
- Equity at exit
- $69,448
- IRR
- 27.8%
- Equity multiple
- 6.50×
- Total profit
- $152,350
- Equity at exit
- $132,691
Cash invested: $27,720 (down + closing). Projections, not guarantees.
Landlord ↔ Tenant lean methodology
- Overall (STATE)
- 43 Moderately Tenant-Leaning
- State Illinois
- 43 Moderately Tenant-Leaning · D+7
- County
- — inherits STATE
- City
- — inherits STATE
ZIP-level market 62985
- Home prices YoY
- 4.3%
- Active inventory
- 5
- Price-to-rent
- 6.8×
Monthly cashflow live
- Estimated rent
- $1,215 medium interval (Pro) →
- Mortgage (P&I)
- −$519
- Tax from tax record
- −$37 /mo · $448/yr
- Insurance
- −$41
- HOA
- −$0
- Vacancy / Maint / Mgmt
- −$255
- Net cashflow
- $362
Break-even live
UW: 25.0% down · 7.5% · 30yr · 1.5% tax · 5.0% vac · 8.0% maint · 8.0% mgmt
Financing live
Cash to close
- Down payment
- $24,750
- Closing costs
- $2,970
- Reserves months
- —
- Total cash needed
- —
Loan-product check · same deal, 3 products live
Conventional
25% down · 7.5% · 30yr
- Down + closing
- —
- Monthly P&I
- —
- Monthly cashflow
- —
- DSCR
- —
- Eligible?
- —
Personal DTI + credit; lowest rate.
DSCR
20% down · 8.5% · 30yr
- Down + closing
- —
- Monthly P&I
- —
- Monthly cashflow
- —
- DSCR
- —
- Eligible?
- —
No personal income docs; deal must DSCR.
Hard money
10% down · 12.0% · 12mo
- Down + closing
- —
- Monthly P&I
- —
- Monthly cashflow
- —
- DSCR
- —
- Eligible?
- —
Short-term bridge; refi at stabilization.
Listing history 4 events
-
2026-06-18days on market $99,000 Active 3 DOM
-
2026-06-17days on market $99,000 Active 2 DOM
-
2026-06-17remarks 699-char remark
-
2026-06-17$99,000 Active 1 DOM
ⓘ Source: listings_history table (triggers on properties + properties_extension) + one-shot
backfill from property_details.listing_events for pre-trigger history.
Tax reassessment forecast IL · Partial reset (capped growth)
- Current annual tax
- $448 · $37/mo
- Projected year-2 tax
- $1,348 · $112/mo
- Expected delta
- +$899/yr (+$75/mo · 200.6%)
ⓘ Screening estimate from a state-policy table — verify with the county assessor before closing.
Climate risk First Street
- Flood 1/10 Low 0% chance over 30 yrs
- Wildfire 2/10 Low
- Heat 5/10 Major 7 d/yr ≥108°F today · 22 d/yr by 30 yrs out
- Wind 3/10 Moderate 4% chance of damaging wind over 30 yrs
- Air quality 2/10 Low 0 unhealthy d/yr today · 1 by 30 yrs out
Nearby sold comps map
Loading sold comps map…
Walkable amenities ~0.75 mi
Loading nearby amenities…
Taxation est. · year 1
- Rental income
- $14,584
- − Mortgage interest
- −$5,546
- − Property taxes
- −$448
- − Insurance
- −$495
- − Repairs & maintenance
- −$1,167
- − Management
- −$1,167
- − Depreciation
- −$2,880
- Taxable income
- $2,881
- Est. tax owed @ 24.0%
- −$692
- After-tax cash flow
- $3,656/yr
For passive investors: Depreciation is non-cash, so a rental often shows a tax loss while cash-flowing — sheltering income. Rental losses are passive: they offset passive income freely, and up to $25,000/yr can offset ordinary (W-2) income if you actively participate and your MAGI is under $100k (phasing out to $0 by $150k); unused losses carry forward. On sale, claimed depreciation is recaptured at up to 25%, and gains may owe capital-gains tax (a 1031 exchange can defer both). Figures are a year-1 estimate at your 24.0% rate — not tax advice; consult a CPA.
Schools (NCES district)
- District
- Vienna Hsd 133
- NCES district ID
- 1740290
- Math proficiency
- 15% ▲ 5.00%
- Reading proficiency
- 35% ▬ 0.00%
- Median HH income
- $40,197
- Composite
- 24.12/100
- National rank
- #13157
- State rank
- #630 of 919 in IL
Livability — Simpson
- Score
- 58/100
- State rank
- #1105
- US rank
- #20918
Category grades
Schools grade is shown separately in the Schools card above.
Census & demographics
- Census place
- Simpson, IL
- Population (ZIP)
- 1,108
Population outlook (Johnson County) Hauer SSP2
- Today (2025)
- 13,355 people
- By 2030
- 13,579 · +1.7%
- By 2040
- 13,849 · +3.7%
- By 2050
- 13,880 · +3.9%
- By 2075
- 13,759 · +3.0%
- By 2100
- 11,536 · -13.6%
Race, ethnicity, and origin ACS 2023
- Neighborhood character
- Predominantly White (96%)
- Race & ethnicity
- White 96% Two or more races 4% Hispanic / Latino 3%
- Common ancestry
- Slovak 1% Lithuanian 1% Romanian 1%
- Foreign-born
- 3% · Canada, Jamaica
- Languages at home
- 97% English-only · Spanish 3%
Political lean MEDSL · Johnson
- 2024 margin
- Solid R (+58.3) · D 20.3% · R 78.6% · Other 1.1%
- 2008→2024 swing
- -23.7pp toward R · 2008: -34.6pp · 2024: -58.3pp
- All cycles
- 2024: R+58.3 2020: R+58.6 2016: R+58.3 2012: R+42.1 2008: R+34.6
Not yet ingested
- Civics
- —
Market trends
- HPI YoY
- ▲ 7.13%
- Current HPI
- 171.4867
- Rent YoY
- —
- Metro
- —
- State GDP YoY
- ▲ 1.59%
- F500 in state
- 60
Industry mix (Fortune 500 HQ in IL)
| Industry | F500 HQs | Revenue |
|---|---|---|
| Insurance | 4 | $201B |
|
||
| Consumer Goods | 4 | $87B |
|
||
| Industrial Machinery | 3 | $64B |
|
||
| Healthcare | 2 | $55B |
|
||
| Retail / Pharmacy | 1 | $148B |
|
||
| Agriculture / Food | 1 | $86B |
|
||
Property tax history
+3.0%/yrLatest (2024): $448 · +33.3% YoY. Source: county tax records.
Cash-flow waterfall
monthlySold comps — $/sqft
last 12 mo · ≤1 miLoading sold comps…