907 Lloyds Chapel Rd · Mount Carmel, TN
Flood risk 9/10 · Severe
- FEMA flood zone
- X (unshaded)
- Chance of flooding over 30 yrs
- 0.99%
- Est. flood insurance / yr
- $507 – $1,088
Fire risk 3/10 · Minor
- Est. fire insurance / yr
- $949 – $1,763
Heat risk 4/10 · Minor
- Hot days now (above 101°F)
- 7 days/yr
- Hot days in 30 yrs
- 19 days/yr
Wind risk 2/10 · Minimal
- Chance of severe wind over 30 yrs
- —
Air-quality risk 2/10 · Minimal
- Unhealthy air days now
- 1 days/yr
- Unhealthy air days in 30 yrs
- 2 days/yr
Risk factors via First Street. Map © Google.
Why this score? — see what drove the B- grade
The composite is a weighted blend of 9 inputs, each scored 0–100. Each bar is that input's sub-score; the figure is the points it added to the 100-point composite (weight × sub-score).
- Cash flow +30.0/30.0
- 1% rule +10.0/10.0
- DSCR +10.0/10.0
- ARV discount +7.5/15.0
- Livability +3.2/5.0
- Rent growth +2.5/5.0
- Condition / age +2.5/5.0
- Schools +2.0/10.0
- Appreciation +0.0/10.0
$40,000
🖨 Deal sheet (PDF) 📄 Offer letter ✓ Due diligence
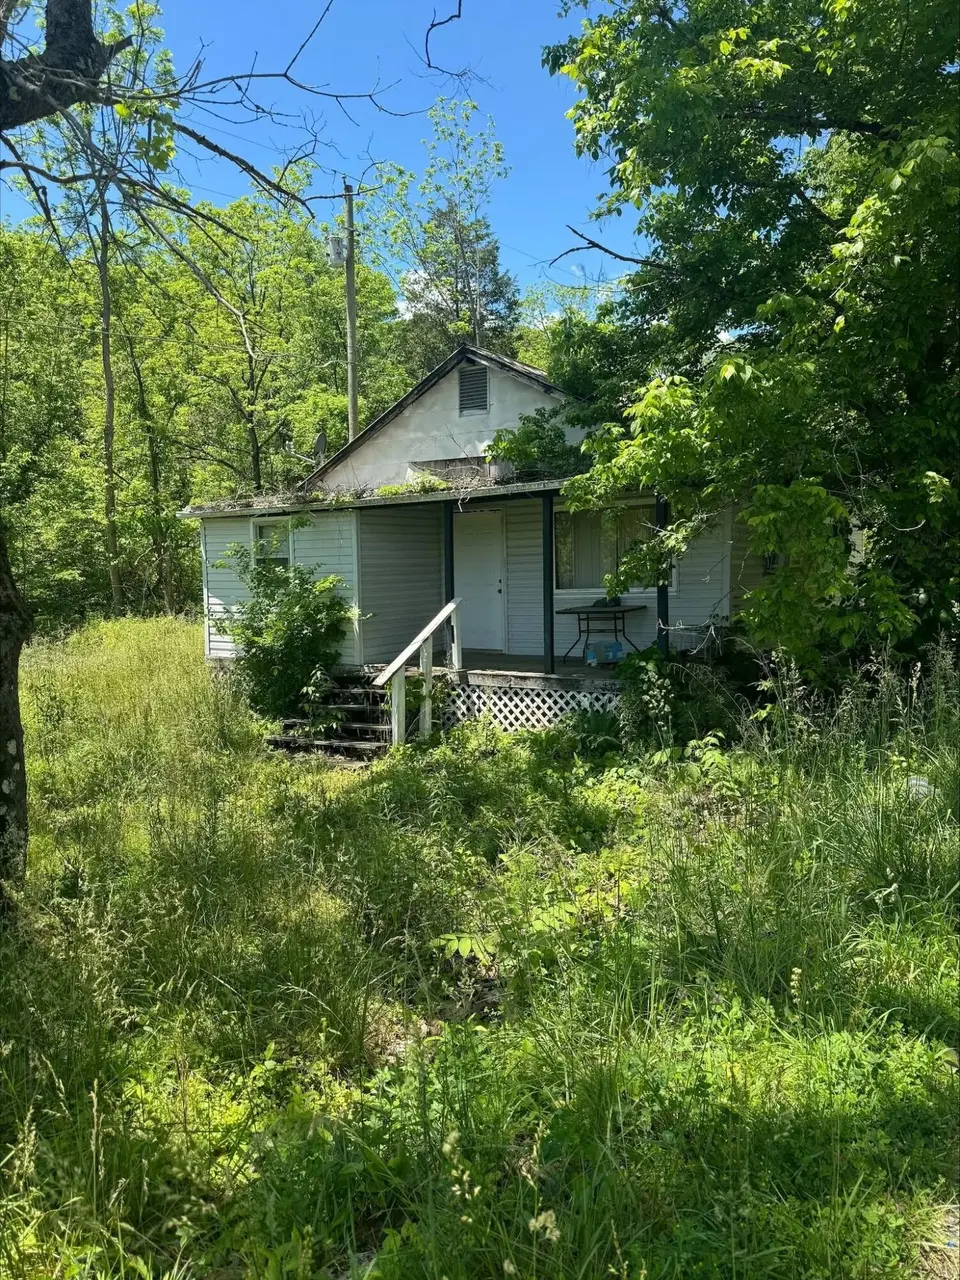
Listing remarks
INVESTOR SPECIAL!!! Check out this quaint 2bedroom 1 bath home in need of some TLC. The perfect opportunity for investors or just anyone looking for a project.
Key facts
- 0.55 acre lot
- Built 1955
- Listed 16 days
Property features AI
Finance
- Other: Property listed in fixer condition
Exterior
- Utilities: Public water; Sewer: unknown
- Home design: Single-family house; One story
- Construction: Aluminum siding, concrete, and frame construction; Built as a one-level structure
- Exterior features: Level lot; County road frontage; No fencing; Asphalt roof; Lot dimensions approximately 200 x 120 (0.55 acres)
Interior
- Kitchen: No appliances listed
- Bedrooms: 2 main-level bedrooms
- Bathrooms: 1 main-level bathroom
- Heating & cooling: Ductless heating; Wall/window cooling units
- Interior features: Aluminum window frames; Metal fireplace; Five total rooms
Neighborhood map
What this means for you Summary
Snapshot
- This is a 2-bed/1.0-bath single-family listed at $40k.
Deal economics
- At list price, monthly cash flow is $525 ($6k/yr) — positive.
- The deal already cash-flows at list — no discount required.
- Meets the 1% rule at list price ($1k rent vs $40k).
- Recommended offer: $39k (1.5% below list) — sets the bar for market timing.
- Cap rate 24.0% vs local median 4.2% in Mount Carmel — top-decile yield for the area; either an underpriced asset or a hidden risk that comps aren't pricing in. Stress-test before assuming the spread holds.
Location & tenants
- Location reads 65/100 on livability (#140 in TN) — a middle-class / working-renter tenant base. Strengths: cost of living A+, housing A+; Watch: crime C-, employment D+, amenities F.
- Hawkins County (rural): math 23% / reading 26% proficiency, ranked #93 of 139 in TN (top 67%) — low school quality limits family demand, transient renter base, plan for 1-2y turnover.
- Zoned schools: Church Hill Elementary (math 27% / reading 37%, grade F, #369 of 952 statewide, top 42%, 328 students, 0% FRL); Church Hill Intermediate School (math 27% / reading 27%, grade F, #128 of 333 statewide, top 40%, 372 students, 0% FRL); Volunteer High School (math 19% / reading 37%, grade F, #101 of 332 statewide, top 30%, 1,045 students, 0% FRL) — zoned schools average 0% FRL vs 57% district-wide (57 pts lower); this property's tenant base skews higher-income than the district average.
- Market conditions: 125 active listings in the ZIP; 151 units permitted in Hawkins County in 2024 (0 in 5+ unit buildings).
Forward outlook
- Local home prices are declining (-3.0%/yr); year-one equity from $277 of loan paydown is wiped out by about $1k of value loss. Plan a longer hold.
- Hawkins County population projected at -17% by 2050 — secular population decline; favor cash flow + early exit over multi-decade hold.
- At projected returns (-3.0% appreciation + 3.0% rent growth), your $11k cash investment doubles in ~3 years — after that, you're playing with house money.
Negotiation context
- It's been on market 16 days — a 2% lower offer ($39k) is reasonable based on typical stale-listing flexibility.
Risks & watch-outs
- Watch-outs: flood insurance adds $66/mo; built in 1955 — expect roof / HVAC / electrical / plumbing capex.
- Climate carrying-cost: severe flood risk — expect insurance premiums to compound above CPI over the hold.
Questions for the listing agent
- Built in 1955 — when were the roof, HVAC, electrical panel, plumbing, and water heater last replaced?
- What's the actual annual flood-insurance premium (NFIP or private), and is the property in a SFHA with mandatory coverage?
- Is there a deadline driving the sale (1031 exchange, divorce, estate, relocation)? That informs how much negotiation room exists.
- Schools are D-rated, which usually means shorter tenancies and higher turnover. Who's the typical renter profile here, and what's been the actual vacancy rate?
- What's the average days-on-market for RENTAL listings here right now (not sales)? A rising rental-DOM trend means longer vacancies and softer asking-rent achievability than the comps imply.
- What's the recent tenant-quality profile in this submarket — average credit score on applications, eviction rate, late-payment / NSF rate, and stable-employment percentage? A property-management company in the area should have these aggregated.
- How much new for-sale + rental construction is in the pipeline within 1–3 miles? Heavy new supply typically softens prices + rents 12–24 months out; constrained supply supports both.
Investment metrics
- 1% rule
- 2.63% ✓
- Cap rate
- 24.03%
- Cash-on-cash
- 63.33%
- DSCR
- 3.82
- GRM
- 3.2
CMA / ARV
No comps found within radius.
Projected returns pro-forma
-3.0% appreciation · 3.0% rent growth · sell at horizon
- IRR
- 54.6%
- Equity multiple
- 3.41×
- Total profit
- $26,965
- Equity at exit
- $5,964
- IRR
- 59.7%
- Equity multiple
- 6.95×
- Total profit
- $66,642
- Equity at exit
- $3,458
Cash invested: $11,200 (down + closing). Projections, not guarantees.
Landlord ↔ Tenant lean methodology
- Overall (STATE)
- 87 Strongly Landlord-Friendly
- State Tennessee
- 87 Strongly Landlord-Friendly · R+13
- County
- — inherits STATE
- City
- — inherits STATE
ZIP-level market 37642
- Home prices YoY
- -16.0%
- Active inventory
- 125
- Price-to-rent
- 3.2×
Monthly cashflow live
- Estimated rent
- $1,050 medium interval (Pro) →
- Mortgage (P&I)
- −$210
- Tax from tax record
- −$12 /mo · $146/yr
- Insurance
- −$17
- Flood insurance flood zone
- −$66 /mo · $798/yr
- HOA
- −$0
- Vacancy / Maint / Mgmt
- −$221
- Net cashflow
- $525
Break-even live
Sensitivity live
| Price | -10% $547 | -5% $536 | +0% $525 | +5% $513 | +10% $502 |
|---|---|---|---|---|---|
| Rent | -10% $442 | -5% $483 | +0% $525 | +5% $566 | +10% $608 |
| Rate | -1.0pp $545 | -0.5pp $535 | base $525 | +0.5pp $514 | +1.0pp $504 |
UW: 25.0% down · 7.5% · 30yr · 1.5% tax · 5.0% vac · 8.0% maint · 8.0% mgmt
Financing live
Cash to close
- Down payment
- $10,000
- Closing costs
- $1,200
- Reserves months
- —
- Total cash needed
- —
Loan-product check · same deal, 3 products live
Conventional
25% down · 7.5% · 30yr
- Down + closing
- —
- Monthly P&I
- —
- Monthly cashflow
- —
- DSCR
- —
- Eligible?
- —
Personal DTI + credit; lowest rate.
DSCR
20% down · 8.5% · 30yr
- Down + closing
- —
- Monthly P&I
- —
- Monthly cashflow
- —
- DSCR
- —
- Eligible?
- —
No personal income docs; deal must DSCR.
Hard money
10% down · 12.0% · 12mo
- Down + closing
- —
- Monthly P&I
- —
- Monthly cashflow
- —
- DSCR
- —
- Eligible?
- —
Short-term bridge; refi at stabilization.
Listing history 11 events
-
2026-06-13status $40,000 Pending 16 DOM
-
2026-06-10days on market $40,000 Active 16 DOM
-
2026-06-09days on market $40,000 Active 15 DOM
-
2026-06-08days on market $40,000 Active 14 DOM
-
2026-06-07days on market $40,000 Active 13 DOM
-
2026-06-05days on market $40,000 Active 10 DOM
-
2026-06-02days on market $40,000 Active 8 DOM
-
2026-06-01days on market $40,000 Active 7 DOM
-
2026-05-31days on market $40,000 Active 6 DOM
-
2026-05-30days on market $40,000 Active 5 DOM
-
2026-05-25$40,000 Active
ⓘ Source: listings_history table (triggers on properties + properties_extension) + one-shot
backfill from property_details.listing_events for pre-trigger history.
Tax reassessment forecast TN · Resets to sale price
- Current annual tax
- $146 · $12/mo
- Projected year-2 tax
- $284 · $24/mo
- Expected delta
- +$138/yr (+$12/mo · 94.5%)
ⓘ Screening estimate from a state-policy table — verify with the county assessor before closing.
Climate risk First Street
- Flood 9/10 Extreme FEMA zone X (unshaded) · 99% chance over 30 yrs
- Wildfire 3/10 Moderate
- Heat 4/10 Moderate 7 d/yr ≥101°F today · 19 d/yr by 30 yrs out
- Wind 2/10 Low
- Air quality 2/10 Low 1 unhealthy d/yr today · 2 by 30 yrs out
Nearby sold comps map
Loading sold comps map…
Walkable amenities ~0.75 mi
Loading nearby amenities…
Taxation est. · year 1
- Rental income
- $12,603
- − Mortgage interest
- −$2,241
- − Property taxes
- −$146
- − Insurance
- −$998
- − Repairs & maintenance
- −$1,008
- − Management
- −$1,008
- − Depreciation
- −$1,164
- Taxable income
- $6,039
- Est. tax owed @ 24.0%
- −$1,449
- After-tax cash flow
- $4,846/yr
For passive investors: Depreciation is non-cash, so a rental often shows a tax loss while cash-flowing — sheltering income. Rental losses are passive: they offset passive income freely, and up to $25,000/yr can offset ordinary (W-2) income if you actively participate and your MAGI is under $100k (phasing out to $0 by $150k); unused losses carry forward. On sale, claimed depreciation is recaptured at up to 25%, and gains may owe capital-gains tax (a 1031 exchange can defer both). Figures are a year-1 estimate at your 24.0% rate — not tax advice; consult a CPA.
Schools (NCES district)
- District
- Hawkins County
- NCES district ID
- 4701740
- Math proficiency
- 23% ▼ -9.00%
- Reading proficiency
- 26% ▼ -6.00%
- Median HH income
- $37,555
- Composite
- 20.45/100
- National rank
- #8581
- State rank
- #93 of 139 in TN
Livability — Mount Carmel
- Score
- 65/100
- State rank
- #140
- US rank
- #12696
Category grades
Schools grade is shown separately in the Schools card above.
Census & demographics
- City population
- 5,504
- Population (ZIP)
- 14,491
Population outlook (Hawkins County) Hauer SSP2
- Today (2025)
- 55,226 people
- By 2030
- 53,784 · -2.6%
- By 2040
- 50,015 · -9.4%
- By 2050
- 45,682 · -17.3%
- By 2075
- 36,211 · -34.4%
- By 2100
- 26,536 · -52.0%
Race, ethnicity, and origin ACS 2023
- Neighborhood character
- Predominantly White (95%)
- Race & ethnicity
- White 95% Two or more races 2% Hispanic / Latino 1% Black 1%
- Common ancestry
- Serbian 2% Iranian 2% Italian 1%
- Foreign-born
- 0%
Political lean MEDSL · Hawkins
- 2024 margin
- Solid R (+68.8) · D 15.2% · R 84.0%
- 2008→2024 swing
- -26.9pp toward R · 2008: -42.0pp · 2024: -68.8pp
- All cycles
- 2024: R+68.8 2020: R+65.8 2016: R+63.4 2012: R+47.0 2008: R+42.0
Not yet ingested
- Civics
- —
Market trends
- HPI YoY
- ▼ -56.69%
- Current HPI
- 297.1526
- Rent YoY
- —
- Metro
- —
- State GDP YoY
- ▲ 2.78%
- F500 in state
- 22
Industry mix (Fortune 500 HQ in TN)
| Industry | F500 HQs | Revenue |
|---|---|---|
| Healthcare | 3 | $91B |
|
||
| Retail | 3 | $72B |
|
||
| Transportation / Logistics | 1 | $88B |
|
||
| Paper / Packaging | 1 | $19B |
|
||
| Insurance | 1 | $13B |
|
||
| Energy | 1 | $12B |
|
||
Price history
1 event — show timeline
- 2026-05-25 Listed $40,000 LAAR
Property tax history
+0.8%/yrLatest (2025): $146 · +0.0% YoY. Source: county tax records.
Cash-flow waterfall
monthlySold comps — $/sqft
last 12 mo · ≤1 miLoading sold comps…