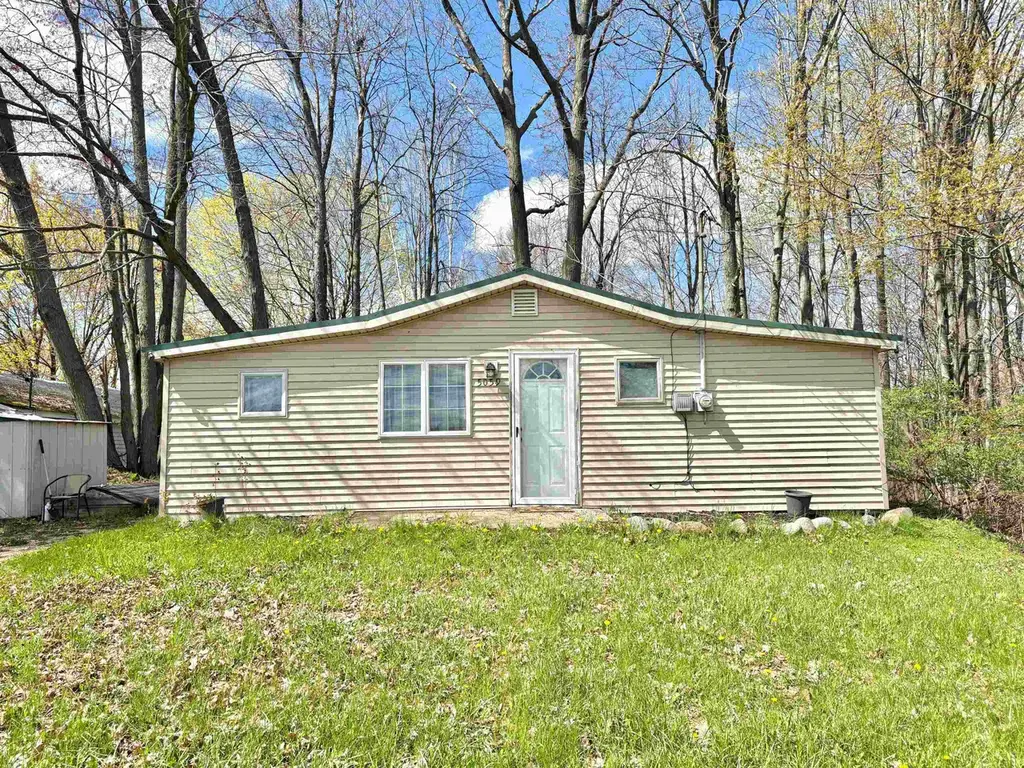
5059 Half Moon Trl · Farwell, MI
Flood risk No data
- FEMA flood zone
- —
- Chance of flooding over 30 yrs
- —
- Est. flood insurance / yr
- —
Fire risk No data
- Est. fire insurance / yr
- —
Heat risk No data
- Hot days now (above threshold)
- —
- Hot days in 30 yrs
- —
Wind risk No data
- Chance of severe wind over 30 yrs
- —
Air-quality risk No data
- Unhealthy air days now
- —
- Unhealthy air days in 30 yrs
- —
Risk factors via First Street. Map © Google.
Why this score? — see what drove the D+ grade
The composite is a weighted blend of 9 inputs, each scored 0–100. Each bar is that input's sub-score; the figure is the points it added to the 100-point composite (weight × sub-score).
- Cash flow +25.2/30.0
- DSCR +8.3/10.0
- 1% rule +6.2/10.0
- Livability +2.9/5.0
- Rent growth +2.5/5.0
- Condition / age +2.5/5.0
- Schools +2.4/10.0
- ARV discount +0.0/15.0
- Appreciation +0.0/10.0
$72,000
🖨 Deal sheet (PDF) 📄 Offer letter ✓ Due diligence
Listing remarks
Updated 2-bed, 1-bath home on a half-acre lot with optional access to Bear Lake. The home has seen solid updates over time and has been well-maintained. Inside, you’ll find updated flooring, a tile shower, a tankless water heater, and a gas fireplace as the primary heat source, with electric baseboard heat in each bedroom. The unique fireplace mantle was custom-built from lumber harvested right from the property. Optional boat launch access to Bear Lake is about $75/year. Half Moon Lake is also nearby and great for kayaking.
Key facts
- Gas fireplace
- Updated flooring
- Half acre lot
Tags
Property features AI
Finance
- Other:
- Financial info:
- HOA & community:
Exterior
- Parking:
- Security:
- Utilities: Private well water; Septic system
- Home design: One-story residential home; Built in 1966; Entry and primary living on main level
- Construction: Vinyl siding; Slab foundation
- Exterior features: Wooded lot; Road frontage
Interior
- Kitchen: Kitchen about 13 x 10; Microwave; Range/Oven; Refrigerator
- Bedrooms: Two bedrooms on the main level (each about 8 x 10)
- Flooring: Vinyl flooring in the living room
- Bathrooms: One full bathroom on the main level
- Heating & cooling: Baseboard heating; Zoned heating; Electric and natural gas fuel options; Other heating features (see remarks)
- Interior features: Gas fireplace (1 total)
- Laundry & utility: Tankless hot water heater
Neighborhood map
What this means for you Summary
Snapshot
- This is a 2-bed/1.0-bath single-family listed at $72k.
Deal economics
- At list price, monthly cash flow is $162 ($2k/yr) — positive.
- The deal already cash-flows at list — no discount required.
- Meets the 1% rule at list price ($804 rent vs $72k).
- Recommended offer: $70k (3.0% below list) — sets the bar for market timing.
- Cap rate 9.0% vs local median 3.7% in Farwell — top-decile yield for the area; either an underpriced asset or a hidden risk that comps aren't pricing in. Stress-test before assuming the spread holds.
Location & tenants
- Location reads 58/100 on livability (#622 in MI) — a working-class tenant base; expect higher turnover. Strengths: cost of living A+, housing A+; Watch: schools D-, crime F, amenities F.
- Farwell Area Schools (town): math 24% / reading 34% proficiency, ranked #388 of 540 in MI (top 72%) — low school quality limits family demand, transient renter base, plan for 1-2y turnover; 62% free/reduced lunch — lower-income household profile, screen leases tightly.
- Market conditions: 95 active listings in the ZIP; 77 units permitted in Clare County in 2024 (0 in 5+ unit buildings).
Forward outlook
- Local home prices are declining (-3.0%/yr); year-one equity from $498 of loan paydown is wiped out by about $2k of value loss. Plan a longer hold.
- Clare County population projected at -20% by 2050 — secular population decline; favor cash flow + early exit over multi-decade hold.
Negotiation context
- It's been on market 47 days — a 3% lower offer ($70k) is reasonable based on typical stale-listing flexibility.
- 9 sale attempts since 23y ago with the ask held roughly flat each time — persistent listings suggest the price (not the market) is what's stuck; bring a comps-based counter.
- Current owner paid $26k; list at $72k implies a 177% gain — meaningful room to come down on a strong offer.
Questions for the listing agent
- It's been on market 47 days. Have you received any prior offers? Is the seller open to a 3% concession, seller financing, or rate buy-down credit?
- Built in 1966 — when were the roof, HVAC, electrical panel, plumbing, and water heater last replaced?
- Is there a deadline driving the sale (1031 exchange, divorce, estate, relocation)? That informs how much negotiation room exists.
- Schools are D-rated, which usually means shorter tenancies and higher turnover. Who's the typical renter profile here, and what's been the actual vacancy rate?
- Crime grade is F in this area — have there been break-ins, vandalism, or insurance claims at this property in the last 3 years? What carrier currently insures it and at what premium?
- The area grade is low — what's the realistic commute time and amenity access for the typical tenant pool here? Any planned neighborhood developments (good or bad) we should know about?
- What's the average days-on-market for RENTAL listings here right now (not sales)? A rising rental-DOM trend means longer vacancies and softer asking-rent achievability than the comps imply.
- What's the recent tenant-quality profile in this submarket — average credit score on applications, eviction rate, late-payment / NSF rate, and stable-employment percentage? A property-management company in the area should have these aggregated.
- How much new for-sale + rental construction is in the pipeline within 1–3 miles? Heavy new supply typically softens prices + rents 12–24 months out; constrained supply supports both.
Investment metrics
- 1% rule
- 1.12% ✓
- Cap rate
- 8.99%
- Cash-on-cash
- 9.62%
- DSCR
- 1.43
- GRM
- 7.5
CMA / ARV
- ARV (median comp)
- $55,152
- List price
- $72,000
- Delta
- 30.55%
- Verdict
- OVERPRICED
- Comps
- 17 within 1.0 mi
Show comp detail 6 sales within ~0.75 mi
| Address | Dist | Beds/Ba | Sqft | Sold | Price | $/sf | Match |
|---|---|---|---|---|---|---|---|
| 5311 Half Moon Trl | 0.27mi | 2/1.0 | 558 (0%) | 14mo | $22,500 | $40 | 76 |
| 5490 Half Moon Trl | 0.22mi | 1/1.0 (-1) | 558 (0%) | 20mo | $80,000 | $143 | 68 |
| 5380 Half Moon Trl | 0.25mi | 2/1.0 | 630 (+13%) | 11mo | $81,000 | $129 | 58 |
| 5231 Summit Ct | 0.29mi | 2/1.0 | 620 (+11%) | 19mo | $90,000 | $145 | 52 |
| 5500 Half Moon Trl | 0.34mi | 2/1.0 | 638 (+14%) | 12mo | $90,000 | $141 | 50 |
| 5962 Woodland Dr Dr | 0.70mi | 1/1.0 (-1) | 600 (+8%) | 20mo | $50,000 | $83 | 33 |
Match score weights: distance 35% · size 25% · config 20% · recency 20%. Top-matched comps best support the ARV.
Projected returns pro-forma
-3.0% appreciation · 3.0% rent growth · sell at horizon
- IRR
- -1.8%
- Equity multiple
- 0.93×
- Total profit
- $-1,374
- Equity at exit
- $10,735
- IRR
- 7.9%
- Equity multiple
- 1.60×
- Total profit
- $12,051
- Equity at exit
- $6,225
Cash invested: $20,160 (down + closing). Projections, not guarantees.
Landlord ↔ Tenant lean methodology
- Overall (STATE)
- 62 Landlord-Friendly
- State Michigan
- 62 Landlord-Friendly · EVEN
- County
- — inherits STATE
- City
- — inherits STATE
ZIP-level market 48632
- Home prices YoY
- -27.9%
- Active inventory
- 95
- Price-to-rent
- 7.5×
Monthly cashflow live
- Estimated rent
- $804 medium interval (Pro) →
- Mortgage (P&I)
- −$378
- Tax from tax record
- −$66 /mo · $791/yr
- Insurance
- −$30
- HOA
- −$0
- Vacancy / Maint / Mgmt
- −$169
- Net cashflow
- $162
Break-even live
Sensitivity live
| Price | -10% $202 | -5% $182 | +0% $162 | +5% $141 | +10% $121 |
|---|---|---|---|---|---|
| Rent | -10% $98 | -5% $130 | +0% $162 | +5% $193 | +10% $225 |
| Rate | -1.0pp $198 | -0.5pp $180 | base $162 | +0.5pp $143 | +1.0pp $124 |
UW: 25.0% down · 7.5% · 30yr · 1.5% tax · 5.0% vac · 8.0% maint · 8.0% mgmt
Financing live
Cash to close
- Down payment
- $18,000
- Closing costs
- $2,160
- Reserves months
- —
- Total cash needed
- —
Loan-product check · same deal, 3 products live
Conventional
25% down · 7.5% · 30yr
- Down + closing
- —
- Monthly P&I
- —
- Monthly cashflow
- —
- DSCR
- —
- Eligible?
- —
Personal DTI + credit; lowest rate.
DSCR
20% down · 8.5% · 30yr
- Down + closing
- —
- Monthly P&I
- —
- Monthly cashflow
- —
- DSCR
- —
- Eligible?
- —
No personal income docs; deal must DSCR.
Hard money
10% down · 12.0% · 12mo
- Down + closing
- —
- Monthly P&I
- —
- Monthly cashflow
- —
- DSCR
- —
- Eligible?
- —
Short-term bridge; refi at stabilization.
Listing history 34 events
-
2026-06-21days on market $72,000 Active 47 DOM
-
2026-06-21pricedays on market $72,000 Active 46 DOM
-
2026-06-18days on market $74,900 Active 44 DOM
-
2026-06-17days on market $74,900 Active 43 DOM
-
2026-06-16days on market $74,900 Active 42 DOM
-
2026-06-15days on market $74,900 Active 41 DOM
-
2026-06-13days on market $74,900 Active 39 DOM
-
2026-06-12days on market $74,900 Active 38 DOM
-
2026-06-09days on market $74,900 Active 35 DOM
-
2026-06-08days on market $74,900 Active 34 DOM
-
2026-06-07days on market $74,900 Active 33 DOM
-
2026-06-07days on market $74,900 Active 32 DOM
-
2026-06-04days on market $74,900 Active 29 DOM
-
2026-06-02days on market $74,900 Active 28 DOM
-
2026-06-01days on market $74,900 Active 27 DOM
-
2026-05-31days on market $74,900 Active 26 DOM
-
2026-05-31days on market $74,900 Active 25 DOM
-
2026-05-13historical
-
2026-05-13historical
-
2026-05-02$74,900 Active
-
2026-05-02$74,900 Active
-
2026-05-02$74,900 Active
-
2019-12-02soldstatus $26,000
-
2019-12-02soldstatus $26,000
-
2019-07-02$29,900
-
2019-07-02$29,900
-
2017-04-30historical
-
2017-04-30historical
-
2016-04-30$24,900
-
2016-04-30$24,900
-
2009-07-01soldstatus $25,900
-
2006-10-02$29,900
-
2005-06-16historical
-
2003-07-02$35,000
ⓘ Source: listings_history table (triggers on properties + properties_extension) + one-shot
backfill from property_details.listing_events for pre-trigger history.
Tax reassessment forecast MI · Partial reset (capped growth)
- Current annual tax
- $791 · $66/mo
- Projected year-2 tax
- $950 · $79/mo
- Expected delta
- +$159/yr (+$13/mo · 20.1%)
ⓘ Screening estimate from a state-policy table — verify with the county assessor before closing.
Nearby sold comps map
Loading sold comps map…
Walkable amenities ~0.75 mi
Loading nearby amenities…
Taxation est. · year 1
- Rental income
- $9,648
- − Mortgage interest
- −$4,033
- − Property taxes
- −$791
- − Insurance
- −$360
- − Repairs & maintenance
- −$772
- − Management
- −$772
- − Depreciation
- −$2,095
- Taxable income
- $826
- Est. tax owed @ 24.0%
- −$198
- After-tax cash flow
- $1,742/yr
For passive investors: Depreciation is non-cash, so a rental often shows a tax loss while cash-flowing — sheltering income. Rental losses are passive: they offset passive income freely, and up to $25,000/yr can offset ordinary (W-2) income if you actively participate and your MAGI is under $100k (phasing out to $0 by $150k); unused losses carry forward. On sale, claimed depreciation is recaptured at up to 25%, and gains may owe capital-gains tax (a 1031 exchange can defer both). Figures are a year-1 estimate at your 24.0% rate — not tax advice; consult a CPA.
Schools (NCES district)
- District
- Farwell Area Schools
- NCES district ID
- 2614100
- Math proficiency
- 24% ▼ -8.00%
- Reading proficiency
- 34% ▼ -8.00%
- Median HH income
- $36,696
- Composite
- 24.07/100
- National rank
- #7760
- State rank
- #388 of 540 in MI
Livability — Farwell
- Score
- 58/100
- State rank
- #622
- US rank
- #20973
Category grades
Schools grade is shown separately in the Schools card above.
Census & demographics
- Population (ZIP)
- 4,995
Population outlook (Clare County) Hauer SSP2
- Today (2025)
- 29,283 people
- By 2030
- 28,199 · -3.7%
- By 2040
- 25,722 · -12.2%
- By 2050
- 23,372 · -20.2%
- By 2075
- 18,569 · -36.6%
- By 2100
- 14,320 · -51.1%
Race, ethnicity, and origin ACS 2023
- Neighborhood character
- Predominantly White (91%)
- Race & ethnicity
- White 91% Two or more races 4% Hispanic / Latino 4%
- Common ancestry
- Romanian 7% Lithuanian 3% Slovak 2%
- Foreign-born
- 2% · Canada, China, South Korea
- Languages at home
- 95% English-only · German/W. Germanic 2% Spanish 1% Chinese 1%
Political lean MEDSL · Clare
- 2024 margin
- Solid R (+37.6) · D 30.5% · R 68.1% · Other 1.4%
- 2008→2024 swing
- -42.4pp toward R · 2008: 4.8pp · 2024: -37.6pp
- All cycles
- 2024: R+37.6 2020: R+34.8 2016: R+31.8 2012: R+4.8 2008: D+4.8
Not yet ingested
- Civics
- —
Market trends
- HPI YoY
- ▼ -90.83%
- Current HPI
- 234.5118
- Rent YoY
- —
- Metro
- —
- State GDP YoY
- ▲ 1.37%
- F500 in state
- 28
Industry mix (Fortune 500 HQ in MI)
| Industry | F500 HQs | Revenue |
|---|---|---|
| Automotive Parts | 3 | $48B |
|
||
| Automotive | 2 | $372B |
|
||
| Chemicals | 1 | $45B |
|
||
| Automotive Retail | 1 | $29B |
|
||
| Healthcare / Medical Devices | 1 | $23B |
|
||
| Automotive Technology | 1 | $20B |
|
||
Price history
+114.0% since first listed17 events — show timeline
- 2026-05-13 Listing Removed — MiRealSource-MiMLS
- 2026-05-13 Listing Removed — REALCOMP
- 2026-05-02 Listed $74,900 MiRealSource-MiMLS
- 2026-05-02 Listed $74,900 MiRealSource-MiMLS
- 2026-05-02 Listed $74,900 REALCOMP
- 2019-12-02 Sold (MLS) $26,000 MiRealSource-MiMLS
- 2019-12-02 Sold (MLS) $26,000 REALCOMP
- 2019-07-02 Listed $29,900 MiRealSource-MiMLS
- 2019-07-02 Listed $29,900 REALCOMP
- 2017-04-30 Listing Removed — MiRealSource-MiMLS
- 2017-04-30 Listing Removed — REALCOMP
- 2016-04-30 Listed $24,900 MiRealSource-MiMLS
- 2016-04-30 Listed $24,900 REALCOMP
- 2009-07-01 Sold (MLS) $25,900 MiRealSource-MiMLS
- 2006-10-02 Listed $29,900 MiRealSource-MiMLS
- 2005-06-16 Listing Removed — MiRealSource-MiMLS
- 2003-07-02 Listed $35,000 MiRealSource-MiMLS
Property tax history
+7.0%/yrLatest (2025): $791 · +0.3% YoY. Source: county tax records.
Cash-flow waterfall
monthlySold comps — $/sqft
last 12 mo · ≤1 miLoading sold comps…