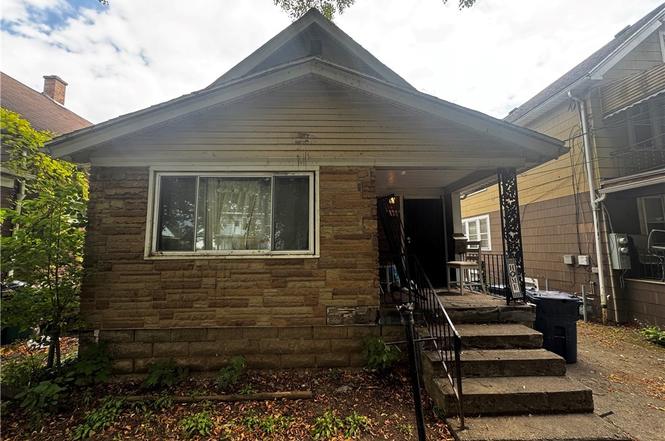
437 Cornwall Ave · Buffalo, NY
Flood risk 1/10 · Minimal
- FEMA flood zone
- X (unshaded)
- Chance of flooding over 30 yrs
- 0.0%
- Est. flood insurance / yr
- $473 – $860
Fire risk 1/10 · Minimal
- Est. fire insurance / yr
- $691 – $1,283
Heat risk 3/10 · Minor
- Hot days now (above 93°F)
- 7 days/yr
- Hot days in 30 yrs
- 15 days/yr
Wind risk 1/10 · Minimal
- Chance of severe wind over 30 yrs
- —
Air-quality risk 3/10 · Minor
- Unhealthy air days now
- 2 days/yr
- Unhealthy air days in 30 yrs
- 3 days/yr
Risk factors via First Street. Map © Google.
Why this score? — see what drove the B- grade
The composite is a weighted blend of 9 inputs, each scored 0–100. Each bar is that input's sub-score; the figure is the points it added to the 100-point composite (weight × sub-score).
- Cash flow +30.0/30.0
- 1% rule +10.0/10.0
- DSCR +10.0/10.0
- ARV discount +7.5/15.0
- Livability +3.9/5.0
- Schools +3.3/10.0
- Rent growth +2.7/5.0
- Condition / age +2.5/5.0
- Appreciation +0.0/10.0
$85,000
🖨 Deal sheet 📄 Offer letter ✓ Due diligence
Listing remarks
Welcome to 437 Cornwall, a 3-bedroom home offering 1,737 square feet of living space. This property features a spacious living area and a functional kitchen with ample cabinet space. All three bedrooms are generously sized, providing flexibility. The detached two-car garage adds convenience and extra storage, perfect for vehicles or hobbies. Enjoy the large backyard—ideal for relaxing, gardening, or entertaining. This home blends comfort and convenience.
Key facts
- Functional kitchen
- Spacious living area
- Large backyard
Tags
Neighborhood map
What this means for you Summary
Snapshot
- This is a 3-bed/1.0-bath single-family listed at $85k.
Deal economics
- At list price, monthly cash flow is $589 ($7k/yr) — positive.
- The deal already cash-flows at list — no discount required.
- Meets the 1% rule at list price ($1k rent vs $85k).
- Recommended offer: $75k (12.0% below list) — sets the bar for market timing.
- Cap rate 14.6% vs local median 8.0% in Buffalo — top-decile yield for the area; either an underpriced asset or a hidden risk that comps aren't pricing in. Stress-test before assuming the spread holds.
Location & tenants
- Location reads 77/100 on livability (#195 in NY, #3,011 nationally) — a middle-class / working-renter tenant base. Strengths: commute A+, housing A+, health & safety A+; Watch: crime F, employment D-.
- Buffalo City School District (urban): math 41% / reading 40% proficiency, ranked #535 of 590 in NY (top 91%) — families likely to look elsewhere, expect single-tenant / working-renter base with shorter leases; 75% free/reduced lunch — lower-income household profile, screen leases tightly.
- Market conditions: Rents flat; 237 active listings in the ZIP; 19 comparable units currently listed for rent nearby; rentals at typical pace (median 15d on market — plan ~3-4 weeks tenant-placement turnaround); lower-income renter base — watch delinquency; 1,244 units permitted in Erie County in 2024 (563 in 5+ unit buildings).
- This rent runs 40% of the median local income ($45k/yr) — at the standard rent-burdened threshold; future hikes will face affordability resistance.
Forward outlook
- Local home prices are declining (-3.0%/yr); year-one equity from $588 of loan paydown is wiped out by about $3k of value loss. Plan a longer hold.
- At projected returns (-3.0% appreciation + 0.7% rent growth), your $24k cash investment doubles in ~5 years — after that, you're playing with house money.
Negotiation context
- It's been on market 136 days — a 12% lower offer ($75k) is reasonable based on typical stale-listing flexibility.
Risks & watch-outs
- Watch-outs: built in 1920 — expect roof / HVAC / electrical / plumbing capex.
Questions for the listing agent
- It's been on market 136 days. Have you received any prior offers? Is the seller open to a 12% concession, seller financing, or rate buy-down credit?
- Built in 1920 — when were the roof, HVAC, electrical panel, plumbing, and water heater last replaced?
- Why hasn't it sold? Are there any deal-killer items the seller is aware of (foundation, flood, title, zoning, code violations)?
- Is there a deadline driving the sale (1031 exchange, divorce, estate, relocation)? That informs how much negotiation room exists.
- Crime grade is F in this area — have there been break-ins, vandalism, or insurance claims at this property in the last 3 years? What carrier currently insures it and at what premium?
- What's the average days-on-market for RENTAL listings here right now (not sales)? A rising rental-DOM trend means longer vacancies and softer asking-rent achievability than the comps imply.
- What's the recent tenant-quality profile in this submarket — average credit score on applications, eviction rate, late-payment / NSF rate, and stable-employment percentage? A property-management company in the area should have these aggregated.
- How much new for-sale + rental construction is in the pipeline within 1–3 miles? Heavy new supply typically softens prices + rents 12–24 months out; constrained supply supports both.
Investment metrics
- 1% rule
- 1.75% ✓
- Cap rate
- 14.60%
- Cash-on-cash
- 29.67%
- DSCR
- 2.32
- GRM
- 4.8
CMA / ARV
- ARV (on-the-fly)
- $184,122
- Comps found
- 12
Show comp detail 12 sales within ~0.75 mi
| Address | Dist | Beds/Ba | Sqft | Sold | Price | $/sf | Match |
|---|---|---|---|---|---|---|---|
| 353 Warwick Ave | 0.37mi | 3/1.0 | 1,611 (-7%) | 1mo | $161,800 | $100 | 70 |
| 127 Durham Ave | 0.32mi | 3/1.0 | 1,550 (-11%) | 1mo | $216,000 | $139 | 66 |
| 624 Kensington Ave | 0.53mi | 4/1.5 (+1) | 1,742 (+0%) | 8mo | $95,000 | $55 | 61 |
| 597 Norfolk Ave | 0.33mi | 3/1.0 | 1,490 (-14%) | 4mo | $160,000 | $107 | 58 |
| 66 Maple Ridge Ave | 0.29mi | 3/1.5 | 1,994 (+15%) | 5mo | $150,000 | $75 | 56 |
| 365 Wyoming Ave | 0.20mi | 4/1.5 (+1) | 1,922 (+11%) | 12mo | $85,000 | $44 | 56 |
| 92 Fernhill Ave | 0.22mi | 3/1.0 | 1,494 (-14%) | 13mo | $215,000 | $144 | 56 |
| 101 Marigold Ave | 0.71mi | 4/1.0 (+1) | 1,687 (-3%) | 12mo | $200,000 | $119 | 47 |
| 34 Copsewood Ave | 0.67mi | 4/2.0 (+1) | 1,602 (-8%) | 6mo | $170,000 | $106 | 42 |
| 59 Hempstead Ave | 0.58mi | 3/2.0 | 1,536 (-12%) | 11mo | $195,000 | $127 | 41 |
| 17 Elmer Ave | 0.66mi | 3/1.0 | 1,496 (-14%) | 9mo | $150,000 | $100 | 38 |
| 49 Elmer Ave | 0.72mi | 3/1.0 | 1,503 (-14%) | 14mo | $142,500 | $95 | 33 |
Match score weights: distance 35% · size 25% · config 20% · recency 20%. Top-matched comps best support the ARV.
Projected returns pro-forma
-3.0% appreciation · 0.67% rent growth · sell at horizon
- IRR
- 21.5%
- Equity multiple
- 1.85×
- Total profit
- $20,321
- Equity at exit
- $12,674
- IRR
- 28.0%
- Equity multiple
- 3.21×
- Total profit
- $52,696
- Equity at exit
- $7,349
Cash invested: $23,800 (down + closing). Projections, not guarantees.
Landlord ↔ Tenant lean methodology
- Overall (STATE)
- 15 Strongly Tenant-Friendly
- State New York
- 15 Strongly Tenant-Friendly · D+10
- County
- — inherits STATE
- City
- — inherits STATE
ZIP-level market 14215
- Home prices YoY
- -30.0%
- Rents YoY
- 0.7%
- Active inventory
- 237
- Price-to-rent
- 4.8×
Monthly cashflow live
- Estimated rent
- $1,489 high interval (Pro) →
- Mortgage (P&I)
- −$446
- Tax est. 1.5%
- −$106 /mo · $1,275/yr
- Insurance
- −$35
- HOA
- −$0
- Vacancy / Maint / Mgmt
- −$313
- Net cashflow
- $589
Break-even live
UW: 25.0% down · 7.5% · 30yr · 1.5% tax · 5.0% vac · 8.0% maint · 8.0% mgmt
Financing live
Cash to close
- Down payment
- $21,250
- Closing costs
- $2,550
- Reserves months
- —
- Total cash needed
- —
Loan-product check · same deal, 3 products live
Conventional
25% down · 7.5% · 30yr
- Down + closing
- —
- Monthly P&I
- —
- Monthly cashflow
- —
- DSCR
- —
- Eligible?
- —
Personal DTI + credit; lowest rate.
DSCR
20% down · 8.5% · 30yr
- Down + closing
- —
- Monthly P&I
- —
- Monthly cashflow
- —
- DSCR
- —
- Eligible?
- —
No personal income docs; deal must DSCR.
Hard money
10% down · 12.0% · 12mo
- Down + closing
- —
- Monthly P&I
- —
- Monthly cashflow
- —
- DSCR
- —
- Eligible?
- —
Short-term bridge; refi at stabilization.
Rent comps 19 comps
| Address | Beds | Baths | Sqft | Rent | $/sqft | DOM | Units | Dist |
|---|---|---|---|---|---|---|---|---|
| 74 Dorris Ave Buffalo, NY | 3.0 | 1.0 | 1200 | $1,450 | $1.21 | 43d | 1 | 0.33mi |
| 71 Gerald Ave Buffalo, NY | 2.0 | 1.0 | 1773 | $1,100 | $0.62 | 43d | 1 | 0.58mi |
| 25 Parkridge Ave Buffalo, NY | 3.0 | 1.0 | 1914 | $1,350 | $0.71 | 14d | 1 | 0.59mi |
| 110 Gerald Ave Buffalo, NY | 2.0 | 1.0 | 2098 | $1,100 | $0.52 | 23d | 1 | 0.64mi |
| 216 Newburgh Ave Buffalo, NY | 2.0 | 1.0 | 1690 | $1,150 | $0.68 | 23d | 1 | 0.79mi |
| 517 Goodyear Ave Buffalo, NY | 3.0 | 1.0 | 1559 | $1,800 | $1.15 | 19d | 1 | 1.15mi |
| 563 Humboldt Pkwy Buffalo, NY | 3.0 | 1.0 | 2004 | $1,200 | $0.60 | 23d | 1 | 1.23mi |
| 73 Inter Park Ave Buffalo, NY | 3.0 | 1.0 | 2080 | $1,300 | $0.62 | 14d | 1 | 1.23mi |
| 189 Westminster Ave Buffalo, NY | 4.0 | 1.5 | 1065 | $1,595 | $1.50 | 10d | 1 | 1.24mi |
| 89 Lasalle Ave Buffalo, NY | 1.0–4.0 | 1.0–4.0 | 1024 | $2,291 | $2.24 | 1d | 10 | 1.31mi |
| 65 Domedion Ave Buffalo, NY | 3.0 | 1.0 | 1632 | $1,500 | $0.92 | 1d | 1 | 1.31mi |
| 76 Vernon Pl Unit Lower Buffalo, NY | 3.0 | 1.0 | 1190 | $1,445 | $1.21 | 14d | 1 | 1.32mi |
| 76 Vernon Pl Unit Upper Buffalo, NY | 3.0 | 1.0 | 1190 | $1,595 | $1.34 | 14d | 1 | 1.32mi |
| 263 Minnesota Ave Unit Upper Buffalo, NY | 3.0 | 1.0 | 1242 | $1,500 | $1.21 | 14d | 1 | 1.33mi |
| 179 Donaldson Rd Buffalo, NY | 3.0 | 1.0 | 1152 | $1,350 | $1.17 | 3d | 1 | 1.34mi |
| 184 Butler Ave Unit 1545840P Buffalo, NY | 4.0 | 1.0 | 1496 | $3,226 | $2.16 | 14d | 1 | 1.39mi |
| 265 Lisbon Ave Unit 2 Buffalo, NY | 3.0 | 1.0 | 1200 | $1,400 | $1.17 | 43d | 1 | 1.40mi |
| 222 Lisbon Ave Unit Upper Buffalo, NY | 3.0 | 1.0 | 1400 | $1,400 | $1.00 | 43d | 1 | 1.43mi |
| 222 Lisbon Ave Buffalo, NY | 4.0 | 1.0 | 1300 | $1,400 | $1.08 | 23d | 1 | 1.43mi |
Listing history 3 events
-
2026-01-23status Pending
-
2026-01-13price $85,000
-
2025-09-09$110,000 Active
ⓘ Source: listings_history table (triggers on properties + properties_extension) + one-shot
backfill from property_details.listing_events for pre-trigger history.
Climate risk First Street
- Flood 1/10 Low FEMA zone X (unshaded) · 0% chance over 30 yrs
- Wildfire 1/10 Low
- Heat 3/10 Moderate 7 d/yr ≥93°F today · 15 d/yr by 30 yrs out
- Wind 1/10 Low
- Air quality 3/10 Moderate 2 unhealthy d/yr today · 3 by 30 yrs out
Nearby sold comps map
Loading sold comps map…
Walkable amenities ~0.75 mi
Loading nearby amenities…
Taxation est. · year 1
- Rental income
- $17,862
- − Mortgage interest
- −$4,761
- − Property taxes
- −$1,275
- − Insurance
- −$425
- − Repairs & maintenance
- −$1,429
- − Management
- −$1,429
- − Depreciation
- −$2,473
- Taxable income
- $6,070
- Est. tax owed @ 24.0%
- −$1,457
- After-tax cash flow
- $5,605/yr
For passive investors: Depreciation is non-cash, so a rental often shows a tax loss while cash-flowing — sheltering income. Rental losses are passive: they offset passive income freely, and up to $25,000/yr can offset ordinary (W-2) income if you actively participate and your MAGI is under $100k (phasing out to $0 by $150k); unused losses carry forward. On sale, claimed depreciation is recaptured at up to 25%, and gains may owe capital-gains tax (a 1031 exchange can defer both). Figures are a year-1 estimate at your 24.0% rate — not tax advice; consult a CPA.
Schools (NCES district)
- District
- Buffalo City School District
- NCES district ID
- 3605850
- Math proficiency
- 41% ▲ 11.00%
- Reading proficiency
- 40% ▲ 7.00%
- Median HH income
- $31,665
- Composite
- 33.17/100
- National rank
- #5544
- State rank
- #535 of 590 in NY
Livability — Buffalo
- Score
- 77/100
- State rank
- #195
- US rank
- #3011
Category grades
Schools grade is shown separately in the Schools card above.
Census & demographics
- Census place
- Buffalo, NY
- County
- Erie County · 714,559 people
- City population
- 440,021
- Metro
- Buffalo-Cheektowaga, NY
- Population (ZIP)
- 42,524
- Household income
- $44,955
- Rent vs Own
- Severe rent burden
- 2873.0
Population outlook (Erie County) Hauer SSP2
- Today (2025)
- 933,037 people
- By 2030
- 935,181 · +0.2%
- By 2040
- 928,531 · -0.5%
- By 2050
- 905,725 · -2.9%
- By 2075
- 834,037 · -10.6%
- By 2100
- 708,033 · -24.1%
Race, ethnicity, and origin ACS 2023
- Neighborhood character
- Predominantly Black (67%)
- Race & ethnicity
- Black 67% White 15% Asian 7% Hispanic / Latino 6% Two or more races 6%
- Hispanic origin (detail)
- Puerto Rican 4%
- Common ancestry
- Romanian 4% Lithuanian 1% Italian 1%
- Foreign-born
- 9% · Canada, China
- Languages at home
- 88% English-only · Other Indo-European 4% Spanish 4% Chinese 1%
Political lean MEDSL · Erie
- 2024 margin
- Lean D (+9.7) · D 54.8% · R 45.2%
- 2008→2024 swing
- -7.9pp toward R · 2008: 17.5pp · 2024: 9.7pp
- All cycles
- 2024: D+9.7 2020: D+14.7 2016: D+4.8 2012: D+15.6 2008: D+17.5
Not yet ingested
- Civics
- —
Market trends
- HPI YoY
- ▼ -126.29%
- Current HPI
- 295.2966
- Rent YoY
- ▲ 0.67%
- Metro
- Buffalo-Cheektowaga, NY
- State GDP YoY
- ▲ 2.60%
- F500 in state
- 92
Industry mix (Fortune 500 HQ in NY)
| Industry | F500 HQs | Revenue |
|---|---|---|
| Financial Services | 10 | $950B |
|
||
| Consumer Goods | 9 | $162B |
|
||
| Insurance | 4 | $225B |
|
||
| Telecommunications | 2 | $144B |
|
||
| Pharmaceuticals | 2 | $112B |
|
||
| Media / Entertainment | 2 | $69B |
|
||
Price history
-22.7% since first listed3 events — show timeline
- 2026-01-23 Pending — WNYREIS
- 2026-01-13 Price Changed $85,000 WNYREIS
- 2025-09-09 Listed $110,000 WNYREIS
Property tax history
+2.0%/yrLatest (2025): $103 · +0.0% YoY. Source: county tax records.
Cash-flow waterfall
monthlySold comps — $/sqft
last 12 mo · ≤1 miLoading sold comps…