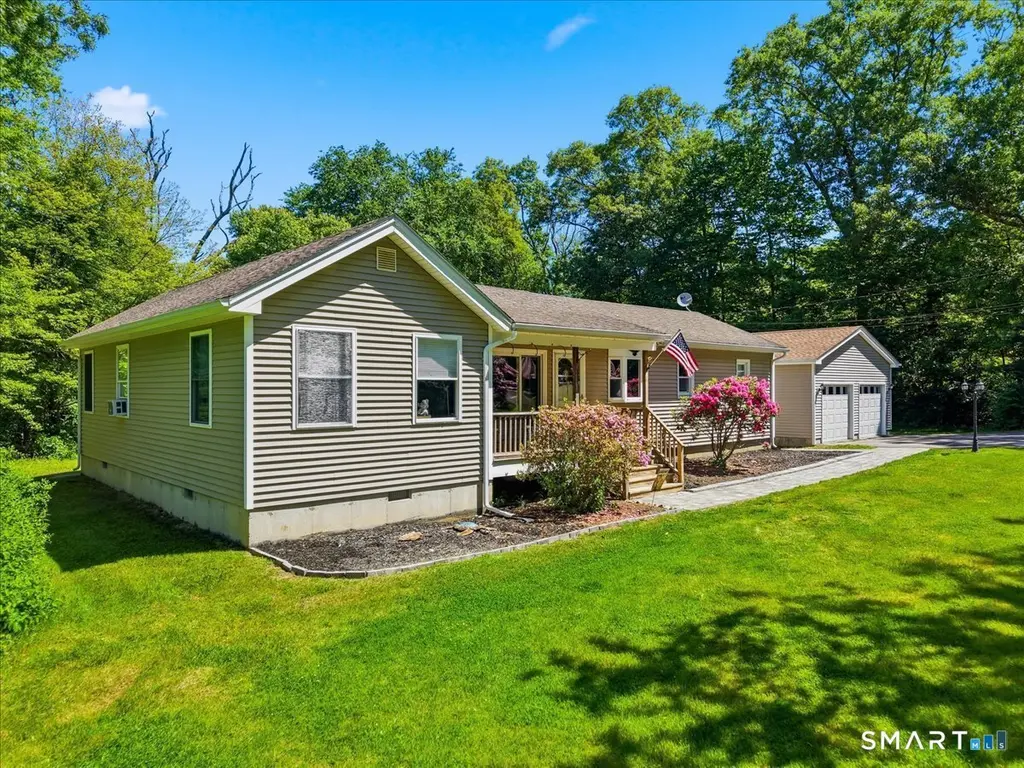
860 Long Cove Rd · Gales Ferry, CT
Flood risk 1/10 · Minimal
- FEMA flood zone
- X (unshaded)
- Chance of flooding over 30 yrs
- 0.0%
- Est. flood insurance / yr
- $507 – $1,088
Fire risk 2/10 · Minimal
- Est. fire insurance / yr
- $829 – $1,539
Heat risk 5/10 · Moderate
- Hot days now (above 96°F)
- 7 days/yr
- Hot days in 30 yrs
- 16 days/yr
Wind risk 8/10 · Major
- Chance of severe wind over 30 yrs
- 80.0%
Air-quality risk 3/10 · Minor
- Unhealthy air days now
- 3 days/yr
- Unhealthy air days in 30 yrs
- 4 days/yr
Risk factors via First Street. Map © Google.
Why this score? — see what drove the F grade
The composite is a weighted blend of 9 inputs, each scored 0–100. Each bar is that input's sub-score; the figure is the points it added to the 100-point composite (weight × sub-score).
- ARV discount +8.5/15.0
- Cash flow +5.9/30.0
- Schools +3.9/10.0
- Livability +3.9/5.0
- Rent growth +2.5/5.0
- Condition / age +2.5/5.0
- 1% rule +1.2/10.0
- DSCR +0.3/10.0
- Appreciation +0.0/10.0
$374,900
🖨 Deal sheet (PDF) 📄 Offer letter ✓ Due diligence
Listing remarks
Welcome home to this well maintained ranch in desirable Gales Ferry! Offering 2-3 bedrooms (public records, due to septic size, reflect 2 bedrooms but there are 3 rooms being used as bedrooms currently), 2 full bathrooms, and a versatile office/den/playroom, this home provides flexible living space to fit a variety of needs. The spacious living area is perfect for gathering, while the kitchen features an abundance of cabinetry and storage. The remodeled primary bathroom adds a fresh, modern touch and enhanced comfort. The additional office/den/playroom offers endless possibilities, ideal for working from home, a playroom or hobby room. Enjoy your morning coffee on the inviting covered front
Key facts
- Covered front porch
- Private backyard
- Expansive yard
Tags
Property features AI
Exterior
- Parking: Detached garage; 2-car garage
- Utilities: Private well water; Septic sewage system; Electric service
- Home design: Single-family home
- Construction: Frame construction; Concrete foundation; Shingle roof; Vinyl siding; Built as single-family residence
- Exterior features: Sidewalk; Storage shed; Porch; Deck; Gutters; Lightly wooded, level lot
Interior
- Kitchen: Electric range; Microwave; Refrigerator; Dishwasher
- Bedrooms: 3 bedrooms
- Bathrooms: 2 full bathrooms
- Heating & cooling: Hot water heating; Oil-fired heating (fuel tank in basement); Domestic hot water
- Interior features: Full unfinished basement; Attic with hatch access; Total of 5 rooms
- Laundry & utility: Laundry located on lower level
Neighborhood map
What this means for you Summary
Snapshot
- This is a 2-bed/2.0-bath single-family listed at $375k.
Deal economics
- At list price, monthly cash flow is $-730 ($-9k/yr) — negative.
- To cash-flow at today's rent, offer at most $246k (34.4% below list).
- To meet the 1% rule (rent ≥ 1% of price), the offer needs to be $234k (37.6% below list).
- Recommended offer: $234k (37.6% below list) — sets the bar for 1% rule.
- Cap rate 4.0% vs local median 5.1% in Gales Ferry — below-typical yield; the buyer is paying a premium for something (appreciation thesis, condition, location) that the cap rate doesn't capture.
Location & tenants
- Location reads 78/100 on livability (#40 in CT, #2,751 nationally) — a middle-class / working-renter tenant base. Strengths: crime A+, employment A+, housing A+; Watch: cost of living D+, amenities F, commute F.
- Ledyard School District (rural): math 34% / reading 49% proficiency, ranked #92 of 153 in CT (top 60%) — families likely to look elsewhere, expect single-tenant / working-renter base with shorter leases; only 15% free/reduced lunch — higher-income household profile.
- Market conditions: 31 active listings in the ZIP; 487 units permitted in Southeastern Connecticut Planning Region in 2024 (244 in 5+ unit buildings).
Forward outlook
- Local home prices are declining (-3.0%/yr); year-one equity from $3k of loan paydown is wiped out by about $11k of value loss. Plan a longer hold.
Negotiation context
- Only 5 days on market — expect competitive offers; lowballing is unlikely to land.
- Current owner paid $114k; list at $375k implies a 230% gain — meaningful room to come down on a strong offer.
Risks & watch-outs
- Watch-outs: built in 1958 — expect roof / HVAC / electrical / plumbing capex.
- Climate carrying-cost: severe wind risk, 80% chance of damaging wind over 30y; extreme-heat days projected 7→16/yr by 2055 (HVAC capex compounding) — expect insurance premiums to compound above CPI over the hold.
Questions for the listing agent
- What do current leases actually rent for vs. the listed asking? Can we see a recent rent roll and the last 12 months of T-12 income?
- Built in 1958 — when were the roof, HVAC, electrical panel, plumbing, and water heater last replaced?
- Is there a deadline driving the sale (1031 exchange, divorce, estate, relocation)? That informs how much negotiation room exists.
- Schools are B-rated — typically a magnet for longer-tenancy family renters. What's the average tenant stay here, and is there a school-zone premium baked into asking?
- The area grade is low — what's the realistic commute time and amenity access for the typical tenant pool here? Any planned neighborhood developments (good or bad) we should know about?
- What's the average days-on-market for RENTAL listings here right now (not sales)? A rising rental-DOM trend means longer vacancies and softer asking-rent achievability than the comps imply.
- What's the recent tenant-quality profile in this submarket — average credit score on applications, eviction rate, late-payment / NSF rate, and stable-employment percentage? A property-management company in the area should have these aggregated.
- How much new for-sale + rental construction is in the pipeline within 1–3 miles? Heavy new supply typically softens prices + rents 12–24 months out; constrained supply supports both.
Investment metrics
- 1% rule
- 0.62% ✗
- Cap rate
- 3.96%
- Cash-on-cash
- -8.35%
- DSCR
- 0.63
- GRM
- 13.4
CMA / ARV
- ARV (on-the-fly)
- $383,670
- Comps found
- 10
Show comp detail 10 sales within ~0.75 mi
| Address | Dist | Beds/Ba | Sqft | Sold | Price | $/sf | Match |
|---|---|---|---|---|---|---|---|
| 869 Long Cove Rd | 0.10mi | 3/1.5 (+1) | 1,726 (+10%) | 10mo | $390,000 | $226 | 63 |
| 3 Parkwood Dr | 0.43mi | 3/1.5 (+1) | 1,634 (+4%) | 8mo | $400,000 | $245 | 60 |
| 9 Parkwood Dr | 0.45mi | 3/2.0 (+1) | 1,630 (+4%) | 9mo | $422,000 | $259 | 59 |
| 844 Long Cove Rd | 0.15mi | 3/2.0 (+1) | 1,432 (-9%) | 22mo | $398,000 | $278 | 55 |
| 5 Conrad Ct | 0.68mi | 3/1.5 (+1) | 1,569 (+0%) | 11mo | $425,000 | $271 | 52 |
| 22 Oakwood Dr | 0.42mi | 3/1.5 (+1) | 1,524 (-3%) | 23mo | $345,000 | $226 | 50 |
| 11 Ledgewood Dr | 0.52mi | 3/1.5 (+1) | 1,450 (-7%) | 10mo | $330,750 | $228 | 48 |
| 28 Laurel Leaf Dr | 0.48mi | 3/2.0 (+1) | 1,438 (-8%) | 17mo | $280,000 | $195 | 44 |
| 9 Conrad Ct | 0.70mi | 3/2.0 (+1) | 1,600 (+2%) | 22mo | $430,000 | $269 | 41 |
| 82 Vinegar Hill Rd | 0.69mi | 3/1.0 (+1) | 1,630 (+4%) | 23mo | $325,000 | $199 | 33 |
Match score weights: distance 35% · size 25% · config 20% · recency 20%. Top-matched comps best support the ARV.
Projected returns pro-forma
-3.0% appreciation · 3.0% rent growth · sell at horizon
- IRR
- -31.0%
- Equity multiple
- -0.02×
- Total profit
- $-107,239
- Equity at exit
- $55,899
- IRR
- -34.0%
- Equity multiple
- -0.46×
- Total profit
- $-153,167
- Equity at exit
- $32,415
Cash invested: $104,972 (down + closing). Projections, not guarantees.
Landlord ↔ Tenant lean methodology
- Overall (STATE)
- 27 Tenant-Leaning
- State Connecticut
- 27 Tenant-Leaning · D+7
- County
- — inherits STATE
- City
- — inherits STATE
ZIP-level market 06335
- Home prices YoY
- -22.0%
- Active inventory
- 31
- Price-to-rent
- 13.4×
Monthly cashflow live
- Estimated rent
- $2,339 medium interval (Pro) →
- Mortgage (P&I)
- −$1,966
- Tax from tax record
- −$456 /mo · $5,475/yr
- Insurance
- −$156
- HOA
- −$0
- Vacancy / Maint / Mgmt
- −$491
- Net cashflow
- $-730
Break-even live
Sensitivity live
| Price | -10% $-518 | -5% $-624 | +0% $-730 | +5% $-836 | +10% $-943 |
|---|---|---|---|---|---|
| Rent | -10% $-915 | -5% $-823 | +0% $-730 | +5% $-638 | +10% $-546 |
| Rate | -1.0pp $-542 | -0.5pp $-635 | base $-730 | +0.5pp $-828 | +1.0pp $-926 |
UW: 25.0% down · 7.5% · 30yr · 1.5% tax · 5.0% vac · 8.0% maint · 8.0% mgmt
Financing live
Cash to close
- Down payment
- $93,725
- Closing costs
- $11,247
- Reserves months
- —
- Total cash needed
- —
Loan-product check · same deal, 3 products live
Conventional
25% down · 7.5% · 30yr
- Down + closing
- —
- Monthly P&I
- —
- Monthly cashflow
- —
- DSCR
- —
- Eligible?
- —
Personal DTI + credit; lowest rate.
DSCR
20% down · 8.5% · 30yr
- Down + closing
- —
- Monthly P&I
- —
- Monthly cashflow
- —
- DSCR
- —
- Eligible?
- —
No personal income docs; deal must DSCR.
Hard money
10% down · 12.0% · 12mo
- Down + closing
- —
- Monthly P&I
- —
- Monthly cashflow
- —
- DSCR
- —
- Eligible?
- —
Short-term bridge; refi at stabilization.
Listing history 6 events
-
2026-06-10status $374,900 Under Contract 5 DOM
-
2026-06-09days on market $374,900 Active 5 DOM
-
2026-06-08days on market $374,900 Active 4 DOM
-
2026-06-07days on market $374,900 Active 3 DOM
-
2026-06-05remarks 699-char remark
-
2026-06-05$374,900 Active 1 DOM
ⓘ Source: listings_history table (triggers on properties + properties_extension) + one-shot
backfill from property_details.listing_events for pre-trigger history.
Tax reassessment forecast CT · Partial reset (capped growth)
- Current annual tax
- $5,475 · $456/mo
- Projected year-2 tax
- $6,749 · $562/mo
- Expected delta
- +$1,274/yr (+$106/mo · 23.3%)
ⓘ Screening estimate from a state-policy table — verify with the county assessor before closing.
Climate risk First Street
- Flood 1/10 Low FEMA zone X (unshaded) · 0% chance over 30 yrs
- Wildfire 2/10 Low
- Heat 5/10 Major 7 d/yr ≥96°F today · 16 d/yr by 30 yrs out
- Wind 8/10 Severe 80% chance of damaging wind over 30 yrs
- Air quality 3/10 Moderate 3 unhealthy d/yr today · 4 by 30 yrs out
Nearby sold comps map
Loading sold comps map…
Walkable amenities ~0.75 mi
Loading nearby amenities…
Taxation est. · year 1
- Rental income
- $28,073
- − Mortgage interest
- −$21,000
- − Property taxes
- −$5,475
- − Insurance
- −$1,874
- − Repairs & maintenance
- −$2,246
- − Management
- −$2,246
- − Depreciation
- −$10,906
- Taxable loss
- −$15,675
- Est. tax savings @ 24.0%
- +$3,762
- After-tax cash flow
- $-5,002/yr
For passive investors: Depreciation is non-cash, so a rental often shows a tax loss while cash-flowing — sheltering income. Rental losses are passive: they offset passive income freely, and up to $25,000/yr can offset ordinary (W-2) income if you actively participate and your MAGI is under $100k (phasing out to $0 by $150k); unused losses carry forward. On sale, claimed depreciation is recaptured at up to 25%, and gains may owe capital-gains tax (a 1031 exchange can defer both). Figures are a year-1 estimate at your 24.0% rate — not tax advice; consult a CPA.
Schools (NCES district)
- District
- Ledyard School District
- NCES district ID
- 0902160
- Math proficiency
- 34% ▼ -12.00%
- Reading proficiency
- 49% ▼ -6.00%
- Median HH income
- $84,854
- Composite
- 39.02/100
- National rank
- #4064
- State rank
- #92 of 153 in CT
Livability — Gales Ferry
- Score
- 78/100
- State rank
- #40
- US rank
- #2751
Category grades
Schools grade is shown separately in the Schools card above.
Census & demographics
- Population (ZIP)
- 6,100
Population outlook (Southeastern Connecticut County) Hauer SSP2
- By 2040
- 293,442
Race, ethnicity, and origin ACS 2023
- Neighborhood character
- Predominantly White (75%)
- Race & ethnicity
- White 75% Two or more races 11% Hispanic / Latino 8% Black 4% Asian 3%
- Hispanic origin (detail)
- Puerto Rican 4%
- Common ancestry
- Romanian 9% Lithuanian 7% Serbian 4%
- Foreign-born
- 5% · Canada, China, Jamaica
- Languages at home
- 94% English-only · Spanish 3% Chinese 1% French/Haitian/Cajun 1%
Political lean MEDSL · Southeastern Connecticut
- 2024 margin
- D (+13.0) · D 55.6% · R 42.6% · Other 1.8%
- All cycles
- 2024: D+13.0
Not yet ingested
- Civics
- —
Market trends
- HPI YoY
- ▼ -67.79%
- Current HPI
- 240.7698
- Rent YoY
- —
- Metro
- —
- State GDP YoY
- ▲ 1.06%
- F500 in state
- 38
Industry mix (Fortune 500 HQ in CT)
| Industry | F500 HQs | Revenue |
|---|---|---|
| Industrial Machinery | 4 | $38B |
|
||
| Insurance | 3 | $71B |
|
||
| Financial Services | 2 | $25B |
|
||
| Transportation / Logistics | 2 | $18B |
|
||
| Healthcare | 1 | $247B |
|
||
| Telecommunications | 1 | $55B |
|
||
Price history
+278.7% since first listed3 events — show timeline
- 2026-06-04 Listed $374,900 Smart MLS
- 1988-05-06 Sold (Public Records) $113,500 Public Records
- 1987-12-01 Sold (Public Records) $99,000 Public Records
Property tax history
+1.8%/yrLatest (2023): $5,475 · +10.3% YoY. Source: county tax records.
Cash-flow waterfall
monthlySold comps — $/sqft
last 12 mo · ≤1 miLoading sold comps…