597 County Road 3406 · Plum Grove, TX
Flood risk 9/10 · Severe
- FEMA flood zone
- X (unshaded)
- Chance of flooding over 30 yrs
- 0.99%
- Est. flood insurance / yr
- $507 – $1,088
Fire risk 5/10 · Moderate
- Est. fire insurance / yr
- $1,222 – $2,270
Heat risk 9/10 · Severe
- Hot days now (above 111°F)
- 7 days/yr
- Hot days in 30 yrs
- 25 days/yr
Wind risk 8/10 · Major
- Chance of severe wind over 30 yrs
- 99.0%
Air-quality risk 2/10 · Minimal
- Unhealthy air days now
- 1 days/yr
- Unhealthy air days in 30 yrs
- 1 days/yr
Risk factors via First Street. Map © Google.
Why this score? — see what drove the B- grade
The composite is a weighted blend of 9 inputs, each scored 0–100. Each bar is that input's sub-score; the figure is the points it added to the 100-point composite (weight × sub-score).
- Cash flow +30.0/30.0
- DSCR +10.0/10.0
- 1% rule +7.8/10.0
- ARV discount +7.5/15.0
- Rent growth +3.5/5.0
- Livability +2.9/5.0
- Condition / age +2.5/5.0
- Schools +2.1/10.0
- Appreciation +0.0/10.0
$125,000
🖨 Deal sheet (PDF) 📄 Offer letter ✓ Due diligence
Listing remarks MLS
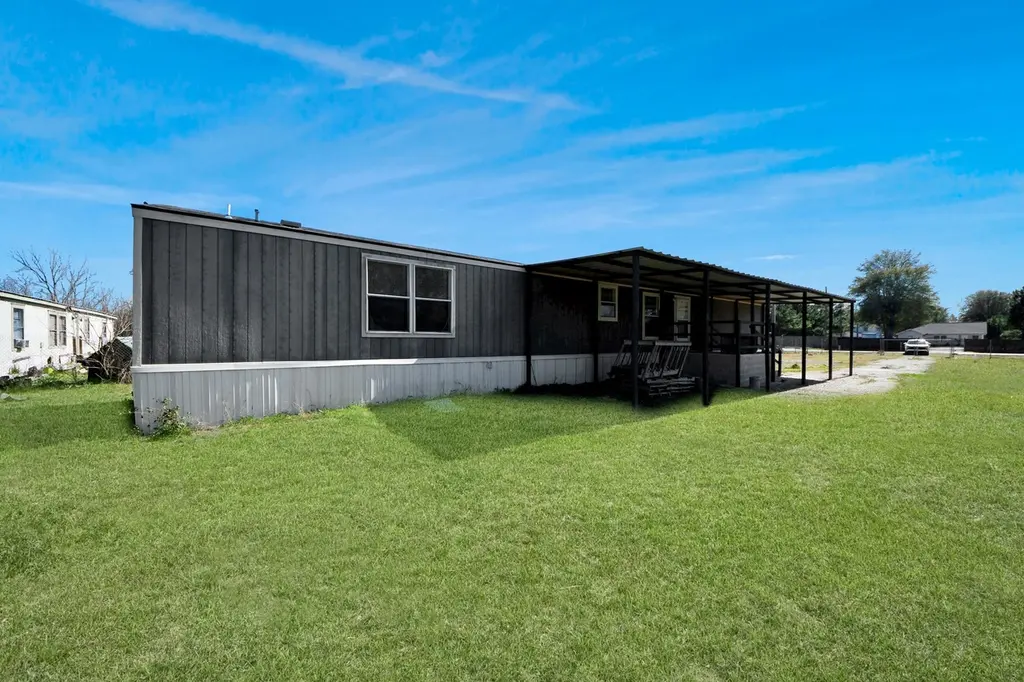
Welcome to this well-maintained single-wide mobile home located in Cleveland, TX! Situated on a spacious ½-acre fully fenced lot, this 3-bedroom, 2-bath home offers comfort, privacy, and room to enjoy the outdoors. Inside, you’ll find a functional layout with generously sized bedrooms and two full bathrooms. Step outside to the covered porch, perfect for relaxing, entertaining, or enjoying your morning coffee. With plenty of space for pets, gardening, or outdoor activities, this property offers peaceful country living with convenient access to town. Endless potential—schedule your showing today!
Key facts
- Covered porch
- Fully fenced lot
- 0.5 acre lot
Tags
Neighborhood map
What this means for you Summary
Snapshot
- This is a 3-bed/2.0-bath manufactured listed at $125k.
Deal economics
- At list price, monthly cash flow is $404 ($5k/yr) — positive.
- The deal already cash-flows at list — no discount required.
- Meets the 1% rule at list price ($2k rent vs $125k).
- Recommended offer: $114k (9.0% below list) — sets the bar for market timing.
- Cap rate 10.8% vs local median 5.0% in Plum Grove — top-decile yield for the area; either an underpriced asset or a hidden risk that comps aren't pricing in. Stress-test before assuming the spread holds.
Location & tenants
- Location reads 58/100 on livability (#1,206 in TX) — a working-class tenant base; expect higher turnover. Strengths: crime A+, cost of living A+, housing A+; Watch: amenities F, commute F, health & safety F.
- Cleveland ISD (town): math 24% / reading 25% proficiency, ranked #723 of 826 in TX (top 88%) — low school quality limits family demand, transient renter base, plan for 1-2y turnover; 71% free/reduced lunch — lower-income household profile, screen leases tightly.
- Zoned schools: Northside El (math 33% / reading 31%, grade F, #2,268 of 4,322 statewide, top 55%, 1,235 students, 90% FRL); Cleveland Middle (math 22% / reading 25%, grade F, #1,317 of 1,662 statewide, top 80%, 1,696 students, 98% FRL); Cleveland H S (math 30% / reading 32%, grade F, #1,077 of 1,632 statewide, top 66%, 3,310 students, 92% FRL) — zoned schools average 93% FRL vs 71% district-wide (23 pts higher); higher-poverty schools than district average — tighter screening recommended.
- Market conditions: Rents rising fast (+4.0%/yr); 1577 active listings in the ZIP; 1,321 units permitted in Liberty County in 2024 (0 in 5+ unit buildings).
- This rent runs 31% of the median local income ($62k/yr) — at the standard rent-burdened threshold; future hikes will face affordability resistance.
Forward outlook
- Local home prices are declining (-3.0%/yr); year-one equity from $864 of loan paydown is wiped out by about $4k of value loss. Plan a longer hold.
- Liberty County population projected at +24% by 2050 — long-run rental-demand tailwind backs the buy-and-hold thesis.
- At projected returns (-3.0% appreciation + 4.0% rent growth), your $35k cash investment doubles in ~8 years — after that, you're playing with house money.
Negotiation context
- It's been on market 105 days — a 9% lower offer ($114k) is reasonable based on typical stale-listing flexibility.
- 4 sale attempts since 2y ago; this cycle's ask has dropped $20k (14%) from the opening price — seller is motivated, your offer sets the floor, not the list.
Risks & watch-outs
- Watch-outs: flood insurance adds $66/mo.
- Climate carrying-cost: severe flood risk; severe wind risk, 99% chance of damaging wind over 30y; moderate wildfire risk; extreme-heat days projected 7→25/yr by 2055 (HVAC capex compounding) — expect insurance premiums to compound above CPI over the hold.
Questions for the listing agent
- It's been on market 105 days. Have you received any prior offers? Is the seller open to a 9% concession, seller financing, or rate buy-down credit?
- What's the actual annual flood-insurance premium (NFIP or private), and is the property in a SFHA with mandatory coverage?
- What does the HOA fee cover, when was the last increase, and are there any pending special assessments or reserve-fund shortfalls?
- Why hasn't it sold? Are there any deal-killer items the seller is aware of (foundation, flood, title, zoning, code violations)?
- Is there a deadline driving the sale (1031 exchange, divorce, estate, relocation)? That informs how much negotiation room exists.
- Schools are F-rated, which usually means shorter tenancies and higher turnover. Who's the typical renter profile here, and what's been the actual vacancy rate?
- What's the average days-on-market for RENTAL listings here right now (not sales)? A rising rental-DOM trend means longer vacancies and softer asking-rent achievability than the comps imply.
- What's the recent tenant-quality profile in this submarket — average credit score on applications, eviction rate, late-payment / NSF rate, and stable-employment percentage? A property-management company in the area should have these aggregated.
- How much new for-sale + rental construction is in the pipeline within 1–3 miles? Heavy new supply typically softens prices + rents 12–24 months out; constrained supply supports both.
Investment metrics
- 1% rule
- 1.28% ✓
- Cap rate
- 10.81%
- Cash-on-cash
- 16.12%
- DSCR
- 1.72
- GRM
- 6.5
CMA / ARV
- ARV (median comp)
- $125,000
- List price
- $125,000
- Delta
- —
- Verdict
- FAIR
- Comps
- 7 within 2.0 mi
Show comp detail 1 sale within ~0.75 mi
| Address | Dist | Beds/Ba | Sqft | Sold | Price | $/sf | Match |
|---|---|---|---|---|---|---|---|
| 106 County Road 3755 | 0.62mi | 3/2.0 | 1,216 (+3%) | 10mo | $189,990 | $156 | 58 |
Match score weights: distance 35% · size 25% · config 20% · recency 20%. Top-matched comps best support the ARV.
Projected returns pro-forma
-3.0% appreciation · 4.0% rent growth · sell at horizon
- IRR
- 5.2%
- Equity multiple
- 1.20×
- Total profit
- $7,111
- Equity at exit
- $18,638
- IRR
- 15.5%
- Equity multiple
- 2.32×
- Total profit
- $46,207
- Equity at exit
- $10,808
Cash invested: $35,000 (down + closing). Projections, not guarantees.
Landlord ↔ Tenant lean methodology
- Overall (STATE)
- 87 Strongly Landlord-Friendly
- State Texas
- 87 Strongly Landlord-Friendly · R+5
- County
- — inherits STATE
- City
- — inherits STATE
ZIP-level market 77327
- Home prices YoY
- -5.2%
- Rents YoY
- 4.0%
- Active inventory
- 1577
- Price-to-rent
- 6.5×
Monthly cashflow live
- Estimated rent
- $1,600 medium interval (Pro) →
- Mortgage (P&I)
- −$656
- Tax from tax record
- −$76 /mo · $912/yr
- Insurance
- −$52
- Flood insurance flood zone
- −$66 /mo · $798/yr
- HOA
- −$10
- Vacancy / Maint / Mgmt
- −$336
- Net cashflow
- $404
Break-even live
Sensitivity live
| Price | -10% $475 | -5% $439 | +0% $404 | +5% $368 | +10% $333 |
|---|---|---|---|---|---|
| Rent | -10% $277 | -5% $341 | +0% $404 | +5% $467 | +10% $530 |
| Rate | -1.0pp $467 | -0.5pp $436 | base $404 | +0.5pp $371 | +1.0pp $338 |
UW: 25.0% down · 7.5% · 30yr · 1.5% tax · 5.0% vac · 8.0% maint · 8.0% mgmt
Financing live
Cash to close
- Down payment
- $31,250
- Closing costs
- $3,750
- Reserves months
- —
- Total cash needed
- —
Loan-product check · same deal, 3 products live
Conventional
25% down · 7.5% · 30yr
- Down + closing
- —
- Monthly P&I
- —
- Monthly cashflow
- —
- DSCR
- —
- Eligible?
- —
Personal DTI + credit; lowest rate.
DSCR
20% down · 8.5% · 30yr
- Down + closing
- —
- Monthly P&I
- —
- Monthly cashflow
- —
- DSCR
- —
- Eligible?
- —
No personal income docs; deal must DSCR.
Hard money
10% down · 12.0% · 12mo
- Down + closing
- —
- Monthly P&I
- —
- Monthly cashflow
- —
- DSCR
- —
- Eligible?
- —
Short-term bridge; refi at stabilization.
HOA detail
- Monthly dues
- $10 · $120/yr
Listing history 27 events
-
2026-06-21days on market $125,000 Active 105 DOM
-
2026-06-18days on market $125,000 Active 102 DOM
-
2026-06-17days on market $125,000 Active 101 DOM
-
2026-06-16days on market $125,000 Active 100 DOM
-
2026-06-15days on market $125,000 Active 99 DOM
-
2026-06-13days on market $125,000 Active 97 DOM
-
2026-06-09days on market $125,000 Active 93 DOM
-
2026-06-08days on market $125,000 Active 92 DOM
-
2026-06-07days on market $125,000 Active 91 DOM
-
2026-06-04days on market $125,000 Active 88 DOM
-
2026-06-03days on market $125,000 Active 87 DOM
-
2026-06-02days on market $125,000 Active 86 DOM
-
2026-06-01days on market $125,000 Active 85 DOM
-
2026-05-31days on market $125,000 Active 84 DOM
-
2026-04-29price $135,000 621-char remark
Show marketing remark (621 chars)
Welcome to this well-maintained single-wide mobile home located in Cleveland, TX! Situated on a spacious ½-acre fully fenced lot, this 3-bedroom, 2-bath home offers comfort, privacy, and room to enjoy the outdoors. Inside, you’ll find a functional layout with generously sized bedrooms and two full bathrooms. Step outside to the covered porch, perfect for relaxing, entertaining, or enjoying your morning coffee. With plenty of space for pets, gardening, or outdoor activities, this property offers peaceful country living with convenient access to town. Endless potential—schedule your showing today!
-
2026-03-08$145,000 Active 621-char remark
Show marketing remark (621 chars)
Welcome to this well-maintained single-wide mobile home located in Cleveland, TX! Situated on a spacious ½-acre fully fenced lot, this 3-bedroom, 2-bath home offers comfort, privacy, and room to enjoy the outdoors. Inside, you’ll find a functional layout with generously sized bedrooms and two full bathrooms. Step outside to the covered porch, perfect for relaxing, entertaining, or enjoying your morning coffee. With plenty of space for pets, gardening, or outdoor activities, this property offers peaceful country living with convenient access to town. Endless potential—schedule your showing today!
-
2026-02-04historical
-
2026-01-22$142,000 Active
-
2025-11-10historical
-
2025-09-15price $149,000
-
2025-06-27price $155,000
-
2025-03-13price $168,999
-
2025-01-28price $176,999
-
2024-11-01$184,999 Active
-
2024-07-26historical
-
2024-02-06$199,000 Active
-
2021-06-01soldstatus
ⓘ Source: listings_history table (triggers on properties + properties_extension) + one-shot
backfill from property_details.listing_events for pre-trigger history.
Tax reassessment forecast TX · Resets to sale price
- Current annual tax
- $912 · $76/mo
- Projected year-2 tax
- $2,288 · $191/mo
- Expected delta
- +$1,376/yr (+$115/mo · 150.9%)
ⓘ Screening estimate from a state-policy table — verify with the county assessor before closing.
Climate risk First Street
- Flood 9/10 Extreme FEMA zone X (unshaded) · 99% chance over 30 yrs
- Wildfire 5/10 Major
- Heat 9/10 Extreme 7 d/yr ≥111°F today · 25 d/yr by 30 yrs out
- Wind 8/10 Severe 99% chance of damaging wind over 30 yrs
- Air quality 2/10 Low 1 unhealthy d/yr today · 1 by 30 yrs out
Nearby sold comps map
Loading sold comps map…
Walkable amenities ~0.75 mi
Loading nearby amenities…
Taxation est. · year 1
- Rental income
- $19,198
- − Mortgage interest
- −$7,002
- − Property taxes
- −$912
- − Insurance
- −$1,422
- − Repairs & maintenance
- −$1,536
- − Management
- −$1,536
- − HOA
- −$120
- − Depreciation
- −$3,636
- Taxable income
- $3,034
- Est. tax owed @ 24.0%
- −$728
- After-tax cash flow
- $4,118/yr
For passive investors: Depreciation is non-cash, so a rental often shows a tax loss while cash-flowing — sheltering income. Rental losses are passive: they offset passive income freely, and up to $25,000/yr can offset ordinary (W-2) income if you actively participate and your MAGI is under $100k (phasing out to $0 by $150k); unused losses carry forward. On sale, claimed depreciation is recaptured at up to 25%, and gains may owe capital-gains tax (a 1031 exchange can defer both). Figures are a year-1 estimate at your 24.0% rate — not tax advice; consult a CPA.
Schools (NCES district)
- District
- Cleveland ISD
- NCES district ID
- 4814370
- Math proficiency
- 24% ▼ -13.00%
- Reading proficiency
- 25% ▼ -4.00%
- Median HH income
- $39,173
- Composite
- 20.61/100
- National rank
- #8549
- State rank
- #723 of 826 in TX
Livability — Plum Grove
- Score
- 58/100
- State rank
- #1206
- US rank
- #21049
Category grades
Schools grade is shown separately in the Schools card above.
Census & demographics
- County
- Liberty County · 82,189 people
- Metro
- Houston-The Woodlands-Sugar Land, TX
- Population (ZIP)
- 42,685
- Household income
- $62,219
- Rent vs Own
- Severe rent burden
- 437.0
Population outlook (Liberty County) Hauer SSP2
- Today (2025)
- 87,956 people
- By 2030
- 92,161 · +4.8%
- By 2040
- 100,784 · +14.6%
- By 2050
- 109,471 · +24.5%
- By 2075
- 133,470 · +51.7%
- By 2100
- 147,372 · +67.6%
Race, ethnicity, and origin ACS 2023
- Neighborhood character
- Diverse neighborhood (Simpson 0.57)
- Race & ethnicity
- Hispanic / Latino 54% White 36% Two or more races 18% Black 8% Native American 2%
- Hispanic origin (detail)
- Mexican 42%
- Common ancestry
- Lithuanian 2% Serbian 1% Slovak 0%
- Foreign-born
- 22% · Canada
- Languages at home
- 51% English-only · Spanish 48%
Political lean MEDSL · Liberty
- 2024 margin
- Solid R (+61.6) · D 19.0% · R 80.6%
- 2008→2024 swing
- -17.9pp toward R · 2008: -43.7pp · 2024: -61.6pp
- All cycles
- 2024: R+61.6 2020: R+59.7 2016: R+58.0 2012: R+53.3 2008: R+43.7
Not yet ingested
- Civics
- —
Market trends
- HPI YoY
- ▼ -12.39%
- Current HPI
- 224.9222
- Rent YoY
- ▲ 4.00%
- Metro
- Houston-The Woodlands-Sugar Land, TX
- State GDP YoY
- ▲ 3.95%
- F500 in state
- 110
Industry mix (Fortune 500 HQ in TX)
| Industry | F500 HQs | Revenue |
|---|---|---|
| Energy | 16 | $1,198B |
|
||
| Technology | 5 | $198B |
|
||
| Engineering / Construction | 4 | $72B |
|
||
| Energy Services | 3 | $60B |
|
||
| Utilities | 3 | $41B |
|
||
| Healthcare | 2 | $330B |
|
||
Price history
-32.2% since first listed13 events — show timeline
- 2026-04-29 Price Changed $135,000 HARMLS
- 2026-03-08 Listed $145,000 HARMLS
- 2026-02-04 Listing Removed — HARMLS
- 2026-01-22 Listed $142,000 HARMLS
- 2025-11-10 Listing Removed — HARMLS
- 2025-09-15 Price Changed $149,000 HARMLS
- 2025-06-27 Price Changed $155,000 HARMLS
- 2025-03-13 Price Changed $168,999 HARMLS
- 2025-01-28 Price Changed $176,999 HARMLS
- 2024-11-01 Listed $184,999 HARMLS
- 2024-07-26 Listing Removed — HARMLS
- 2024-02-06 Listed $199,000 HARMLS
- 2021-06-01 Sold (Public Records) — Public Records
Property tax history
+5.8%/yrLatest (2025): $912 · +0.7% YoY. Source: county tax records.
Cash-flow waterfall
monthlySold comps — $/sqft
last 12 mo · ≤1 miLoading sold comps…