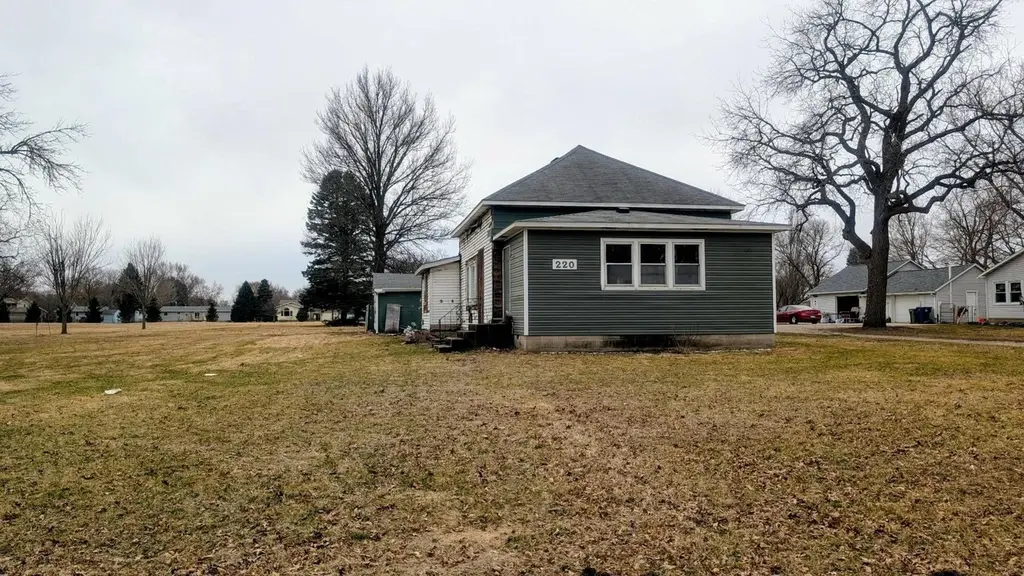
220 4th St SW · Spencer, IA
Flood risk 1/10 · Minimal
- FEMA flood zone
- X (shaded)
- Chance of flooding over 30 yrs
- 0.0%
- Est. flood insurance / yr
- $507 – $1,088
Fire risk 3/10 · Minor
- Est. fire insurance / yr
- $902 – $1,676
Heat risk 2/10 · Minimal
- Hot days now (above 99°F)
- 7 days/yr
- Hot days in 30 yrs
- 16 days/yr
Wind risk 2/10 · Minimal
- Chance of severe wind over 30 yrs
- —
Air-quality risk 1/10 · Minimal
- Unhealthy air days now
- 0 days/yr
- Unhealthy air days in 30 yrs
- 0 days/yr
Risk factors via First Street. Map © Google.
Why this score? — see what drove the D+ grade
The composite is a weighted blend of 9 inputs, each scored 0–100. Each bar is that input's sub-score; the figure is the points it added to the 100-point composite (weight × sub-score).
- Cash flow +15.0/30.0
- ARV discount +7.5/15.0
- Schools +6.1/10.0
- 1% rule +5.0/10.0
- DSCR +5.0/10.0
- Livability +3.9/5.0
- Rent growth +2.5/5.0
- Condition / age +2.5/5.0
- Appreciation +0.0/10.0
$29,900
🖨 Deal sheet (PDF) 📄 Offer letter ✓ Due diligence
Listing remarks MLS
SOLD AS-IS Fixer-upper with tons of potential! Whether you're looking to build to suit or revamp the existing property, this home sits on over ¾ of an acre in a fantastic location. Enjoy close proximity to retail, parks, and everyday conveniences, making this a great opportunity for investors, builders, or buyers ready to create their vision.
Key facts
- Over 3/4 acre
- 0.77 acre lot
- 2 garage spots
Tags
Neighborhood map
What this means for you Summary
Snapshot
- This is a 3-bed/1.0-bath single-family listed at $30k.
Deal economics
- At list price, monthly cash flow is $924 ($11k/yr) — positive.
- The deal already cash-flows at list — no discount required.
- Meets the 1% rule at list price ($1k rent vs $30k).
- Recommended offer: $29k (3.0% below list) — sets the bar for market timing.
- Cap rate 43.4% vs local median 4.8% in Spencer — top-decile yield for the area; either an underpriced asset or a hidden risk that comps aren't pricing in. Stress-test before assuming the spread holds.
Location & tenants
- Location reads 77/100 on livability (#168 in IA, #3,020 nationally) — a middle-class / working-renter tenant base. Strengths: crime A+, cost of living A+, housing A+; Watch: employment D, amenities F, commute F.
- Spencer Community School District (town): math 73% / reading 72% proficiency, ranked #114 of 289 in IA (top 39%) — strong family-tenant draw, lease renewals of 3-5y typical.
- Zoned schools: Fairview Park Elementary (math 82% / reading 47%, grade B, #317 of 616 statewide, top 58%, 308 students, 49% FRL); Spencer Middle School (math 77% / reading 75%, grade A, #59 of 246 statewide, top 26%, 514 students, 43% FRL); Spencer High School (math 68% / reading 76%, grade B+, #117 of 336 statewide, top 39%, 712 students, 40% FRL).
- Market conditions: 108 active listings in the ZIP; 3 comparable units currently listed for rent nearby; rentals lingering (median 45d on market — plan ~5-8 weeks vacancy on turnover, expect pricing pressure); 100% of comp listings sitting > 30 days — soft ceiling on asking rent; 11 units permitted in Clay County in 2024 (0 in 5+ unit buildings).
Forward outlook
- Local home prices are declining (-3.0%/yr); year-one equity from $207 of loan paydown is wiped out by about $897 of value loss. Plan a longer hold.
- Clay County population projected to shrink 6% by 2050 — rents likely to lag national; underwrite the cash flow, not the appreciation.
- At projected returns (-3.0% appreciation + 3.0% rent growth), your $8k cash investment doubles in ~1 year — after that, you're playing with house money.
Negotiation context
- It's been on market 51 days — a 3% lower offer ($29k) is reasonable based on typical stale-listing flexibility.
Risks & watch-outs
- Watch-outs: property tax is 2.9% of price; built in 1900 — expect roof / HVAC / electrical / plumbing capex.
Questions for the listing agent
- It's been on market 51 days. Have you received any prior offers? Is the seller open to a 3% concession, seller financing, or rate buy-down credit?
- Built in 1900 — when were the roof, HVAC, electrical panel, plumbing, and water heater last replaced?
- Property tax is high relative to price — has the assessment been appealed recently, and will the sale trigger a re-assessment?
- Is there a deadline driving the sale (1031 exchange, divorce, estate, relocation)? That informs how much negotiation room exists.
- Schools are A-rated — typically a magnet for longer-tenancy family renters. What's the average tenant stay here, and is there a school-zone premium baked into asking?
- The area grade is low — what's the realistic commute time and amenity access for the typical tenant pool here? Any planned neighborhood developments (good or bad) we should know about?
- What's the average days-on-market for RENTAL listings here right now (not sales)? A rising rental-DOM trend means longer vacancies and softer asking-rent achievability than the comps imply.
- What's the recent tenant-quality profile in this submarket — average credit score on applications, eviction rate, late-payment / NSF rate, and stable-employment percentage? A property-management company in the area should have these aggregated.
- How much new for-sale + rental construction is in the pipeline within 1–3 miles? Heavy new supply typically softens prices + rents 12–24 months out; constrained supply supports both.
Investment metrics
- 1% rule
- 4.93% ✓
- Cap rate
- 43.39%
- Cash-on-cash
- 132.48%
- DSCR
- 6.89
- GRM
- 1.7
CMA / ARV
- ARV (median comp)
- $167,279
- List price
- $29,900
- Delta
- -82.13%
- Verdict
- UNDERPRICED
- Comps
- 20 within 1.0 mi
Show comp detail 12 sales within ~0.75 mi
| Address | Dist | Beds/Ba | Sqft | Sold | Price | $/sf | Match |
|---|---|---|---|---|---|---|---|
| 811 1st Ave SW | 0.31mi | 3/1.0 | 1,200 (-10%) | 3mo | $165,000 | $138 | 66 |
| 34 W 1st St | 0.34mi | 3/1.0 | 1,296 (-3%) | 16mo | $135,000 | $104 | 65 |
| 32 W 1st St | 0.34mi | 3/1.0 | 1,195 (-11%) | 2mo | $114,000 | $95 | 64 |
| 314 7th St SW | 0.21mi | 3/1.5 | 1,232 (-8%) | 14mo | $161,500 | $131 | 63 |
| 26 W 1st St | 0.35mi | 3/1.0 | 1,470 (+10%) | 7mo | $108,000 | $73 | 62 |
| 620 1st Ave SE | 0.31mi | 3/1.0 | 1,144 (-15%) | 2mo | $23,500 | $21 | 60 |
| 512 4th Ave SE | 0.50mi | 3/1.5 | 1,320 (-2%) | 15mo | $150,500 | $114 | 59 |
| 813 6th Ave SW | 0.35mi | 2/2.0 (-1) | 1,222 (-9%) | 4mo | $90,500 | $74 | 57 |
| 105 W 1st St | 0.36mi | 3/2.0 | 1,484 (+11%) | 13mo | $164,000 | $111 | 51 |
| 915 1st Ave SW | 0.38mi | 3/2.5 | 1,536 (+15%) | 7mo | $160,000 | $104 | 46 |
| 320 9th St SW | 0.32mi | 4/2.0 (+1) | 1,528 (+14%) | 13mo | $142,000 | $93 | 42 |
| 407 8th St SE | 0.56mi | 3/2.0 | 1,512 (+13%) | 15mo | $185,000 | $122 | 36 |
Match score weights: distance 35% · size 25% · config 20% · recency 20%. Top-matched comps best support the ARV.
Projected returns pro-forma
-3.0% appreciation · 3.0% rent growth · sell at horizon
- IRR
- —
- Equity multiple
- 7.46×
- Total profit
- $54,065
- Equity at exit
- $4,458
- IRR
- —
- Equity multiple
- 15.70×
- Total profit
- $123,055
- Equity at exit
- $2,585
Cash invested: $8,372 (down + closing). Projections, not guarantees.
Landlord ↔ Tenant lean methodology
- Overall (STATE)
- 83 Strongly Landlord-Friendly
- State Iowa
- 83 Strongly Landlord-Friendly · R+6
- County
- — inherits STATE
- City
- — inherits STATE
ZIP-level market 51301
- Home prices YoY
- -35.0%
- Active inventory
- 108
- Price-to-rent
- 1.7×
Monthly cashflow live
- Estimated rent
- $1,475 medium interval (Pro) →
- Mortgage (P&I)
- −$157
- Tax from tax record
- −$72 /mo · $860/yr
- Insurance
- −$12
- HOA
- −$0
- Vacancy / Maint / Mgmt
- −$310
- Net cashflow
- $924
Break-even live
Sensitivity live
| Price | -10% $941 | -5% $933 | +0% $924 | +5% $916 | +10% $907 |
|---|---|---|---|---|---|
| Rent | -10% $808 | -5% $866 | +0% $924 | +5% $983 | +10% $1,041 |
| Rate | -1.0pp $939 | -0.5pp $932 | base $924 | +0.5pp $917 | +1.0pp $909 |
UW: 25.0% down · 7.5% · 30yr · 1.5% tax · 5.0% vac · 8.0% maint · 8.0% mgmt
Financing live
Cash to close
- Down payment
- $7,475
- Closing costs
- $897
- Reserves months
- —
- Total cash needed
- —
Loan-product check · same deal, 3 products live
Conventional
25% down · 7.5% · 30yr
- Down + closing
- —
- Monthly P&I
- —
- Monthly cashflow
- —
- DSCR
- —
- Eligible?
- —
Personal DTI + credit; lowest rate.
DSCR
20% down · 8.5% · 30yr
- Down + closing
- —
- Monthly P&I
- —
- Monthly cashflow
- —
- DSCR
- —
- Eligible?
- —
No personal income docs; deal must DSCR.
Hard money
10% down · 12.0% · 12mo
- Down + closing
- —
- Monthly P&I
- —
- Monthly cashflow
- —
- DSCR
- —
- Eligible?
- —
Short-term bridge; refi at stabilization.
Rent comps 3 comps
| Address | Beds | Baths | Sqft | Rent | $/sqft | DOM | Units | Dist |
|---|---|---|---|---|---|---|---|---|
| 801 9th St SW Unit 910-C5 Spencer, IA | 4.0 | 2.5 | 1193 | $1,599 | $1.34 | 45d | 1 | 0.53mi |
| 801 9th St SW Unit 814-D6 Spencer, IA | 3.0 | 2.0 | 1230 | $1,460 | $1.19 | 45d | 1 | 0.53mi |
| 801 9th St SW Unit 1001-201 Spencer, IA | 3.0 | 2.0 | 998 | $1,345 | $1.35 | 45d | 1 | 0.53mi |
Listing history 4 events
-
2026-05-08status Pending 352-char remark
Show marketing remark (352 chars)
SOLD AS-IS Fixer-upper with tons of potential! Whether you're looking to build to suit or revamp the existing property, this home sits on over ¾ of an acre in a fantastic location. Enjoy close proximity to retail, parks, and everyday conveniences, making this a great opportunity for investors, builders, or buyers ready to create their vision.
-
2026-05-05price $29,900 352-char remark
Show marketing remark (352 chars)
SOLD AS-IS Fixer-upper with tons of potential! Whether you're looking to build to suit or revamp the existing property, this home sits on over ¾ of an acre in a fantastic location. Enjoy close proximity to retail, parks, and everyday conveniences, making this a great opportunity for investors, builders, or buyers ready to create their vision.
-
2026-03-18$34,900 Active 352-char remark
Show marketing remark (352 chars)
SOLD AS-IS Fixer-upper with tons of potential! Whether you're looking to build to suit or revamp the existing property, this home sits on over ¾ of an acre in a fantastic location. Enjoy close proximity to retail, parks, and everyday conveniences, making this a great opportunity for investors, builders, or buyers ready to create their vision.
-
2007-04-05soldstatus $63,100
ⓘ Source: listings_history table (triggers on properties + properties_extension) + one-shot
backfill from property_details.listing_events for pre-trigger history.
Tax reassessment forecast IA · Partial reset (capped growth)
- Current annual tax
- $860 · $72/mo
- Projected year-2 tax
- $860 · $72/mo
- Expected delta
- $0/yr ($0/mo · 0.0%)
ⓘ Screening estimate from a state-policy table — verify with the county assessor before closing.
Climate risk First Street
- Flood 1/10 Low FEMA zone X (shaded) · 0% chance over 30 yrs
- Wildfire 3/10 Moderate
- Heat 2/10 Low 7 d/yr ≥99°F today · 16 d/yr by 30 yrs out
- Wind 2/10 Low
- Air quality 1/10 Low 0 unhealthy d/yr today · 0 by 30 yrs out
Nearby sold comps map
Loading sold comps map…
Walkable amenities ~0.75 mi
Loading nearby amenities…
Taxation est. · year 1
- Rental income
- $17,699
- − Mortgage interest
- −$1,675
- − Property taxes
- −$860
- − Insurance
- −$150
- − Repairs & maintenance
- −$1,416
- − Management
- −$1,416
- − Depreciation
- −$870
- Taxable income
- $11,313
- Est. tax owed @ 24.0%
- −$2,715
- After-tax cash flow
- $8,376/yr
For passive investors: Depreciation is non-cash, so a rental often shows a tax loss while cash-flowing — sheltering income. Rental losses are passive: they offset passive income freely, and up to $25,000/yr can offset ordinary (W-2) income if you actively participate and your MAGI is under $100k (phasing out to $0 by $150k); unused losses carry forward. On sale, claimed depreciation is recaptured at up to 25%, and gains may owe capital-gains tax (a 1031 exchange can defer both). Figures are a year-1 estimate at your 24.0% rate — not tax advice; consult a CPA.
Schools (NCES district)
- District
- Spencer Community School District
- NCES district ID
- 1926910
- Math proficiency
- 73% ▼ -7.00%
- Reading proficiency
- 72% ▼ -6.00%
- Median HH income
- $45,474
- Composite
- 61.02/100
- National rank
- #797
- State rank
- #114 of 289 in IA
Livability — Spencer
- Score
- 77/100
- State rank
- #168
- US rank
- #3020
Category grades
Schools grade is shown separately in the Schools card above.
Census & demographics
- Census place
- Spencer, IA
- City population
- 12,402
- Population (ZIP)
- 12,402
Population outlook (Clay County) Hauer SSP2
- Today (2025)
- 16,277 people
- By 2030
- 16,073 · -1.3%
- By 2040
- 15,638 · -3.9%
- By 2050
- 15,315 · -5.9%
- By 2075
- 15,026 · -7.7%
- By 2100
- 14,638 · -10.1%
Race, ethnicity, and origin ACS 2023
- Neighborhood character
- Predominantly White (91%)
- Race & ethnicity
- White 91% Hispanic / Latino 5% Two or more races 4%
- Hispanic origin (detail)
- Mexican 4%
- Common ancestry
- Portuguese 14% Iranian 4% Lithuanian 2%
- Foreign-born
- 1% · Canada, South Korea
- Languages at home
- 98% English-only · Spanish 1%
Political lean MEDSL · Clay
- 2024 margin
- Solid R (+43.2) · D 27.8% · R 71.0% · Other 1.2%
- 2008→2024 swing
- -38.1pp toward R · 2008: -5.1pp · 2024: -43.2pp
- All cycles
- 2024: R+43.2 2020: R+38.7 2016: R+42.4 2012: R+18.7 2008: R+5.1
Not yet ingested
- Civics
- —
Market trends
- HPI YoY
- ▼ -103.43%
- Current HPI
- 192.1741
- Rent YoY
- —
- Metro
- —
- State GDP YoY
- ▲ 2.48%
- F500 in state
- 4
Industry mix (Fortune 500 HQ in IA)
| Industry | F500 HQs | Revenue |
|---|---|---|
| Financial Services | 1 | $16B |
|
||
| Retail / Convenience | 1 | $15B |
|
||
Price history
-52.6% since first listed4 events — show timeline
- 2026-05-08 Pending — Iowa Great Lakes BOR
- 2026-05-05 Price Changed $29,900 Iowa Great Lakes BOR
- 2026-03-18 Listed $34,900 Iowa Great Lakes BOR
- 2007-04-05 Sold (Public Records) $63,100 Public Records
Property tax history
+1.1%/yrLatest (2025): $860 · +3.9% YoY. Source: county tax records.
Cash-flow waterfall
monthlySold comps — $/sqft
last 12 mo · ≤1 miLoading sold comps…