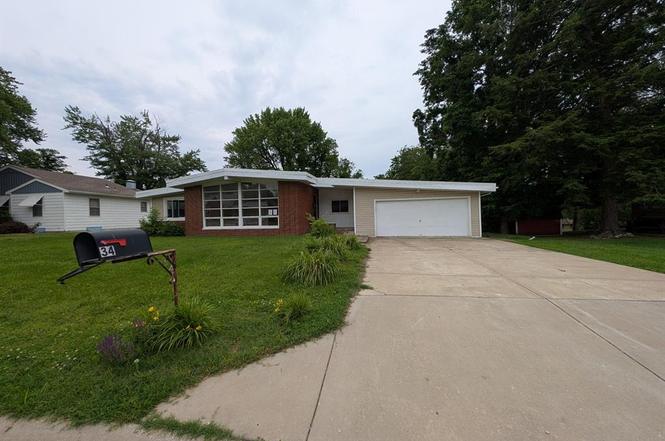
34 Wilshire Dr · Fairview Heights, IL
Flood risk 1/10 · Minimal
- FEMA flood zone
- X
- Chance of flooding over 30 yrs
- 0.0%
- Est. flood insurance / yr
- $507 – $1,088
Fire risk 2/10 · Minimal
- Est. fire insurance / yr
- $804 – $1,492
Heat risk 5/10 · Moderate
- Hot days now (above 107°F)
- 7 days/yr
- Hot days in 30 yrs
- 21 days/yr
Wind risk 2/10 · Minimal
- Chance of severe wind over 30 yrs
- 1.0%
Air-quality risk 3/10 · Minor
- Unhealthy air days now
- 2 days/yr
- Unhealthy air days in 30 yrs
- 4 days/yr
Risk factors via First Street. Map © Google.
Why this score? — see what drove the B+ grade
The composite is a weighted blend of 9 inputs, each scored 0–100. Each bar is that input's sub-score; the figure is the points it added to the 100-point composite (weight × sub-score).
- Cash flow +30.0/30.0
- ARV discount +15.0/15.0
- 1% rule +10.0/10.0
- DSCR +10.0/10.0
- Livability +3.8/5.0
- Rent growth +2.5/5.0
- Condition / age +2.5/5.0
- Schools +2.2/10.0
- Appreciation +0.0/10.0
$100,000
🖨 Deal sheet 📄 Offer letter ✓ Due diligence
Listing remarks
Welcome to 34 Wilshire Drive in Fairview Heights! This spacious ranch-style home offers an inviting layout with generous living areas designed for comfortable everyday living. Featuring a large living room, an expansive den with fireplace, a functional kitchen with dining space, 4 bedrooms, and 2 baths. Main-floor laundry adds everyday convenience. The partial basement offers extra storage potential, and the attached garage provides sheltered parking and workspace. Situated on a sizable lot in the established French Village Hills subdivision, this property presents an excellent opportunity to personalize and make it your own. Located in the heart of Fairview Heights, residents enjoy conveni
Key facts
- 5,662 sq ft lot
- 2 garage spots
- Built 1959
Property features AI
Finance
- Other: Above-grade finished living area reported as 1,641 (per public records)
- Financial info: Lease not considered
Exterior
- Parking: Attached 2-car garage (22 x 31)
- Utilities: Public water; Private sewer; Electric service by Ameren
- Home design: Single-family residence; One level; Residential property owned by a government entity
- Construction: Brick veneer and other exterior materials
- Exterior features: Patio; Chain link fencing; Back yard
Interior
- Bedrooms: Four bedrooms on the main level
- Bathrooms: Two full bathrooms on the main level
- Interior features: Basement with cellar and crawl space; Wood-burning fireplace in the family room; Central air conditioning; Forced air heating
- Laundry & utility: Main-level laundry
Neighborhood map
What this means for you Summary
Snapshot
- This is a 4-bed/4.0-bath single-family listed at $100k.
Deal economics
- At list price, monthly cash flow is $582 ($7k/yr) — positive.
- The deal already cash-flows at list — no discount required.
- Meets the 1% rule at list price ($2k rent vs $100k).
- Cap rate 13.3% vs local median 4.1% in Fairview Heights — top-decile yield for the area; either an underpriced asset or a hidden risk that comps aren't pricing in. Stress-test before assuming the spread holds.
Location & tenants
- Location reads 75/100 on livability (#225 in IL, #4,180 nationally) — a middle-class / working-renter tenant base. Strengths: commute A+, cost of living A+, housing A+; Watch: crime F, amenities F, health & safety F.
- Belleville Twp Hsd 201 (suburban): math 21% / reading 28% proficiency, ranked #308 of 620 in IL (top 50%) — low school quality limits family demand, transient renter base, plan for 1-2y turnover.
- Zoned schools: Belleville High School-East (math 23% / reading 30%, grade F, #241 of 693 statewide, top 35%, 2,568 students, 0% FRL).
- Market conditions: 81 active listings in the ZIP; 1 comparable units currently listed for rent nearby; solid renter incomes; 783 units permitted in St. Clair County in 2024 (378 in 5+ unit buildings).
Forward outlook
- Local home prices are declining (-3.0%/yr); year-one equity from $691 of loan paydown is wiped out by about $3k of value loss. Plan a longer hold.
- St. Clair County population projected at -23% by 2050 — secular population decline; favor cash flow + early exit over multi-decade hold.
- At projected returns (-3.0% appreciation + 3.0% rent growth), your $28k cash investment doubles in ~5 years — after that, you're playing with house money.
Negotiation context
- Only 2 days on market — expect competitive offers; lowballing is unlikely to land.
Risks & watch-outs
- Watch-outs: property tax is 3.5% of price; built in 1959 — expect roof / HVAC / electrical / plumbing capex.
- Climate carrying-cost: extreme-heat days projected 7→21/yr by 2055 (HVAC capex compounding) — expect insurance premiums to compound above CPI over the hold.
Questions for the listing agent
- Built in 1959 — when were the roof, HVAC, electrical panel, plumbing, and water heater last replaced?
- Property tax is high relative to price — has the assessment been appealed recently, and will the sale trigger a re-assessment?
- Is there a deadline driving the sale (1031 exchange, divorce, estate, relocation)? That informs how much negotiation room exists.
- Schools are D-rated, which usually means shorter tenancies and higher turnover. Who's the typical renter profile here, and what's been the actual vacancy rate?
- Crime grade is F in this area — have there been break-ins, vandalism, or insurance claims at this property in the last 3 years? What carrier currently insures it and at what premium?
- What's the average days-on-market for RENTAL listings here right now (not sales)? A rising rental-DOM trend means longer vacancies and softer asking-rent achievability than the comps imply.
- What's the recent tenant-quality profile in this submarket — average credit score on applications, eviction rate, late-payment / NSF rate, and stable-employment percentage? A property-management company in the area should have these aggregated.
- How much new for-sale + rental construction is in the pipeline within 1–3 miles? Heavy new supply typically softens prices + rents 12–24 months out; constrained supply supports both.
Investment metrics
- 1% rule
- 1.82% ✓
- Cap rate
- 13.27%
- Cash-on-cash
- 24.93%
- DSCR
- 2.11
- GRM
- 4.6
CMA / ARV
- ARV (on-the-fly)
- $169,023
- Comps found
- 5
Show comp detail 5 sales within ~0.75 mi
| Address | Dist | Beds/Ba | Sqft | Sold | Price | $/sf | Match |
|---|---|---|---|---|---|---|---|
| 25 Clark Dr | 0.29mi | 4/2.5 | 1,808 (+10%) | 5mo | $275,000 | $152 | 59 |
| 9515 Holy Cross Rd | 0.34mi | 3/2.0 (-1) | 1,734 (+6%) | 6mo | $55,000 | $32 | 57 |
| 27 Brown Dr | 0.57mi | 3/2.0 (-1) | 1,456 (-11%) | 2mo | $149,900 | $103 | 40 |
| 211 Lucinda Dr | 0.38mi | 3/1.5 (-1) | 1,720 (+5%) | 24mo | $172,000 | $100 | 40 |
| 9640 Ridge Heights Rd | 0.53mi | 3/1.0 (-1) | 1,774 (+8%) | 16mo | $250,000 | $141 | 32 |
Match score weights: distance 35% · size 25% · config 20% · recency 20%. Top-matched comps best support the ARV.
Projected returns pro-forma
-3.0% appreciation · 3.0% rent growth · sell at horizon
- IRR
- 18.5%
- Equity multiple
- 1.75×
- Total profit
- $20,979
- Equity at exit
- $14,910
- IRR
- 26.9%
- Equity multiple
- 3.38×
- Total profit
- $66,509
- Equity at exit
- $8,646
Cash invested: $28,000 (down + closing). Projections, not guarantees.
Landlord ↔ Tenant lean methodology
- Overall (STATE)
- 43 Moderately Tenant-Leaning
- State Illinois
- 43 Moderately Tenant-Leaning · D+7
- County
- — inherits STATE
- City
- — inherits STATE
ZIP-level market 62208
- Home prices YoY
- -34.2%
- Active inventory
- 81
- Price-to-rent
- 4.6×
Monthly cashflow live
- Estimated rent
- $1,823 medium interval (Pro) →
- Mortgage (P&I)
- −$524
- Tax from tax record
- −$293 /mo · $3,510/yr
- Insurance
- −$42
- HOA
- −$0
- Vacancy / Maint / Mgmt
- −$383
- Net cashflow
- $582
Break-even live
UW: 25.0% down · 7.5% · 30yr · 1.5% tax · 5.0% vac · 8.0% maint · 8.0% mgmt
Financing live
Cash to close
- Down payment
- $25,000
- Closing costs
- $3,000
- Reserves months
- —
- Total cash needed
- —
Loan-product check · same deal, 3 products live
Conventional
25% down · 7.5% · 30yr
- Down + closing
- —
- Monthly P&I
- —
- Monthly cashflow
- —
- DSCR
- —
- Eligible?
- —
Personal DTI + credit; lowest rate.
DSCR
20% down · 8.5% · 30yr
- Down + closing
- —
- Monthly P&I
- —
- Monthly cashflow
- —
- DSCR
- —
- Eligible?
- —
No personal income docs; deal must DSCR.
Hard money
10% down · 12.0% · 12mo
- Down + closing
- —
- Monthly P&I
- —
- Monthly cashflow
- —
- DSCR
- —
- Eligible?
- —
Short-term bridge; refi at stabilization.
Rent comps 1 comps
| Address | Beds | Baths | Sqft | Rent | $/sqft | DOM | Units | Dist |
|---|---|---|---|---|---|---|---|---|
| 15 Potomac Dr Fairview Heights, IL | 3.0 | 3.0 | 1980 | $1,300 | $0.66 | 23d | 1 | 1.26mi |
Listing history 3 events
-
2026-06-18days on market $100,000 Active 2 DOM
-
2026-06-16remarks 699-char remark
-
2026-06-16$100,000 Active 1 DOM
ⓘ Source: listings_history table (triggers on properties + properties_extension) + one-shot
backfill from property_details.listing_events for pre-trigger history.
Tax reassessment forecast IL · Partial reset (capped growth)
- Current annual tax
- $3,510 · $293/mo
- Projected year-2 tax
- $3,510 · $293/mo
- Expected delta
- $0/yr ($0/mo · 0.0%)
ⓘ Screening estimate from a state-policy table — verify with the county assessor before closing.
Climate risk First Street
- Flood 1/10 Low FEMA zone X · 0% chance over 30 yrs
- Wildfire 2/10 Low
- Heat 5/10 Major 7 d/yr ≥107°F today · 21 d/yr by 30 yrs out
- Wind 2/10 Low 100% chance of damaging wind over 30 yrs
- Air quality 3/10 Moderate 2 unhealthy d/yr today · 4 by 30 yrs out
Nearby sold comps map
Loading sold comps map…
Walkable amenities ~0.75 mi
Loading nearby amenities…
Taxation est. · year 1
- Rental income
- $21,879
- − Mortgage interest
- −$5,602
- − Property taxes
- −$3,510
- − Insurance
- −$500
- − Repairs & maintenance
- −$1,750
- − Management
- −$1,750
- − Depreciation
- −$2,909
- Taxable income
- $5,857
- Est. tax owed @ 24.0%
- −$1,406
- After-tax cash flow
- $5,575/yr
For passive investors: Depreciation is non-cash, so a rental often shows a tax loss while cash-flowing — sheltering income. Rental losses are passive: they offset passive income freely, and up to $25,000/yr can offset ordinary (W-2) income if you actively participate and your MAGI is under $100k (phasing out to $0 by $150k); unused losses carry forward. On sale, claimed depreciation is recaptured at up to 25%, and gains may owe capital-gains tax (a 1031 exchange can defer both). Figures are a year-1 estimate at your 24.0% rate — not tax advice; consult a CPA.
Schools (NCES district)
- District
- Belleville Twp Hsd 201
- NCES district ID
- 1705640
- Math proficiency
- 21% ▼ -8.00%
- Reading proficiency
- 28% ▼ -3.00%
- Median HH income
- $58,064
- Composite
- 22.39/100
- National rank
- #8115
- State rank
- #308 of 620 in IL
Livability — Fairview Heights
- Score
- 75/100
- State rank
- #225
- US rank
- #4180
Category grades
Schools grade is shown separately in the Schools card above.
Census & demographics
- Census place
- Fairview Heights, IL
- County
- Saint Clair County · 169,691 people
- City population
- 16,821
- Metro
- St. Louis, MO-IL
- Population (ZIP)
- 16,821
- Household income
- $80,205
- Rent vs Own
- Severe rent burden
- 555.0
Population outlook (St. Clair County) Hauer SSP2
- Today (2025)
- 250,366 people
- By 2030
- 240,511 · -3.9%
- By 2040
- 217,391 · -13.2%
- By 2050
- 192,699 · -23.0%
- By 2075
- 140,637 · -43.8%
- By 2100
- 100,499 · -59.9%
Race, ethnicity, and origin ACS 2023
- Neighborhood character
- Diverse neighborhood (Simpson 0.64)
- Race & ethnicity
- White 50% Black 33% Two or more races 11% Asian 3% Hispanic / Latino 3%
- Common ancestry
- Lithuanian 2% Romanian 2% Slovak 2%
- Foreign-born
- 4% · Canada, South Korea, Jamaica
- Languages at home
- 96% English-only · Spanish 2% Arabic 1%
Political lean MEDSL · St. Clair
- 2024 margin
- Lean D (+7.9) · D 53.0% · R 45.1% · Other 1.8%
- 2008→2024 swing
- -14.6pp toward R · 2008: 22.4pp · 2024: 7.9pp
- All cycles
- 2024: D+7.9 2020: D+8.7 2016: D+5.6 2012: D+14.5 2008: D+22.4
Not yet ingested
- Civics
- —
Market trends
- HPI YoY
- ▼ -71.14%
- Current HPI
- 136.8631
- Rent YoY
- —
- Metro
- St. Louis, MO-IL
- State GDP YoY
- ▲ 1.59%
- F500 in state
- 60
Industry mix (Fortune 500 HQ in IL)
| Industry | F500 HQs | Revenue |
|---|---|---|
| Insurance | 4 | $201B |
|
||
| Consumer Goods | 4 | $87B |
|
||
| Industrial Machinery | 3 | $64B |
|
||
| Healthcare | 2 | $55B |
|
||
| Retail / Pharmacy | 1 | $148B |
|
||
| Agriculture / Food | 1 | $86B |
|
||
Price history
+127.3% since first listed3 events — show timeline
- 2026-06-16 Listed $100,000 MARIS as Distributed by MLS Grid
- 2011-02-04 Sold (Public Records) $102,000 Public Records
- 2003-11-19 Sold (Public Records) $44,000 Public Records
Property tax history
+3.4%/yrLatest (2024): $3,510 · +7.1% YoY. Source: county tax records.
Cash-flow waterfall
monthlySold comps — $/sqft
last 12 mo · ≤1 miLoading sold comps…