 Triplex
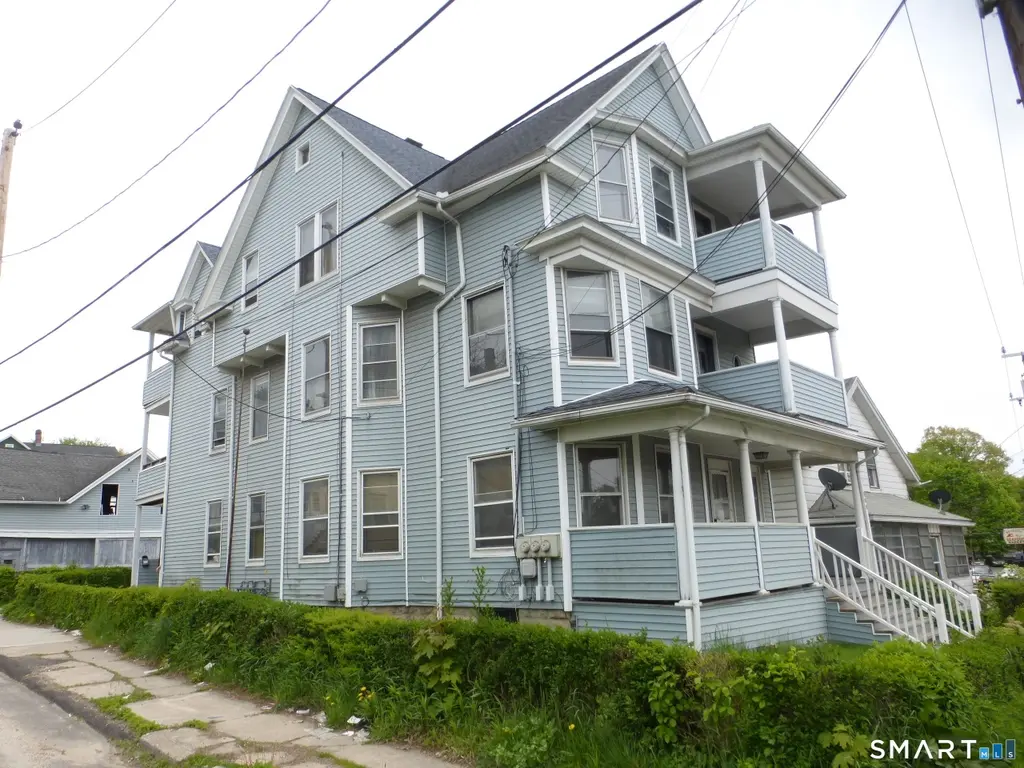
987 Baldwin St · Waterbury, CT
Flood risk 1/10 · Minimal
- FEMA flood zone
- X (unshaded)
- Chance of flooding over 30 yrs
- 0.0%
- Est. flood insurance / yr
- $473 – $860
Fire risk 1/10 · Minimal
- Est. fire insurance / yr
- $829 – $1,539
Heat risk 5/10 · Moderate
- Hot days now (above 96°F)
- 7 days/yr
- Hot days in 30 yrs
- 16 days/yr
Wind risk 6/10 · Moderate
- Chance of severe wind over 30 yrs
- 27.0%
Air-quality risk 3/10 · Minor
- Unhealthy air days now
- 2 days/yr
- Unhealthy air days in 30 yrs
- 3 days/yr
Risk factors via First Street. Map © Google.
Why this score? — see what drove the A- grade
The composite is a weighted blend of 9 inputs, each scored 0–100. Each bar is that input's sub-score; the figure is the points it added to the 100-point composite (weight × sub-score).
- Cash flow +30.0/30.0
- ARV discount +15.0/15.0
- 1% rule +10.0/10.0
- DSCR +10.0/10.0
- Appreciation +5.7/10.0
- Livability +4.0/5.0
- Rent growth +2.5/5.0
- Condition / age +2.5/5.0
- Schools +1.5/10.0
$280,000
🖨 Deal sheet (PDF) 📄 Offer letter ✓ Due diligence
Multi-family units
County records classify this as Multi-Family (2-4 Unit). Listing-text estimate: 3 units. confirmed
Listing remarks
Unlock instant equity potential with this spacious 3 family property ready for renovation. The home features a large four-car garage with a walk-up loft- ideal for storage, a workshop, or future expansion possibilities. A few major exterior updates are already complete, including newer vinyl siding and a newer roof. The interior requires full rehab, making this a perfect opportunity for investors seeking a value-add project. CASH BUYERS ONLY. Property is being sold "As Is", including existing tenants and any remaining contents at the time of closing. A rare chance for seasoned investors to secure a high-potential multi-family project with major upside!
Key facts
- 6,534 sq ft lot
- 4 garage spots
- Built 1908
Property features AI
Finance
- Financial info: Multi-family for sale (3 units)
Exterior
- Parking: Detached garage with 4 garage spaces
- Utilities: Public water connected; Public sewer connected; Natural gas hot water
- Home design: Multi-family property (3-family)
- Construction: Frame construction; Vinyl siding; Asphalt shingle roof; Concrete and stone foundation; Blue exterior color
- Exterior features: Enclosed porch and open porch; Gutters and exterior lighting; Corner lot
Interior
- Bedrooms: 7 bedrooms
- Bathrooms: 3 full bathrooms
- Heating & cooling: Hot water heating; Natural gas heating
- Interior features: 16 total rooms; Full unfinished basement; Attic with access via hatch
Neighborhood map
What this means for you Summary
Snapshot
- This is a 3 × 2-bed/1.0-bath units multifamily listed at $280k.
Deal economics
- At list price, monthly cash flow is $2k ($20k/yr) — positive. Per door: $561/mo.
- The deal already cash-flows at list — no discount required.
- Meets the 1% rule at list price ($5k rent vs $280k).
- Cap rate 13.5% vs local median 3.5% in Waterbury — top-decile yield for the area; either an underpriced asset or a hidden risk that comps aren't pricing in. Stress-test before assuming the spread holds.
Location & tenants
- Location reads 79/100 on livability (#32 in CT, #2,205 nationally) — a middle-class / working-renter tenant base. Strengths: commute A+, cost of living A+, housing A+; Watch: crime D, employment D.
- Waterbury School District (suburban): math 12% / reading 23% proficiency, ranked #148 of 153 in CT (top 97%) — low school quality limits family demand, transient renter base, plan for 1-2y turnover; 73% free/reduced lunch — lower-income household profile, screen leases tightly.
- Zoned schools: Washington School (math 2% / reading 8%, grade F, #545 of 553 statewide, top 99%, 296 students, 79% FRL); West Side Middle School (math 8% / reading 23%, grade F, #165 of 175 statewide, top 94%, 817 students, 81% FRL); Crosby High School (math 2% / reading 17%, grade F, #187 of 194 statewide, top 96%, 1,400 students, 84% FRL).
- Market conditions: 43 active listings in the ZIP; 1 comparable units currently listed for rent nearby; 502 units permitted in Naugatuck Valley Planning Region in 2024 (171 in 5+ unit buildings).
- At $4,972/mo this rent would consume 114% of the median local household income ($52k/yr) (locally 801% of renters already pay >50% of income on rent) — very limited rent-growth headroom before tenants either downsize or default.
Forward outlook
- In year one you build about $6k of equity ($2k loan paydown + $4k appreciation (1.4% local appreciation)).
- At projected returns (1.4% appreciation + 3.0% rent growth), your $78k cash investment doubles in ~3 years — after that, you're playing with house money.
- By year 6, paydown + projected appreciation supports a ~$32k cash-out refi (75% LTV) — recoverable capital for the next deal without selling this one.
Negotiation context
- Only 1 days on market — expect competitive offers; lowballing is unlikely to land.
Risks & watch-outs
- Watch-outs: property tax is 2.8% of price; built in 1908 — expect roof / HVAC / electrical / plumbing capex.
- Climate carrying-cost: major wind risk, 27% chance of damaging wind over 30y; extreme-heat days projected 7→16/yr by 2055 (HVAC capex compounding) — expect insurance premiums to compound above CPI over the hold.
Questions for the listing agent
- Can we see the unit-by-unit rent roll, current vacancy, and any below-market leases? What's the average tenancy length?
- What capital expenditures (roof, boiler, parking lot, exteriors) have been made in the last 5 years, and what's planned in the next 2?
- Built in 1908 — when were the roof, HVAC, electrical panel, plumbing, and water heater last replaced?
- Property tax is high relative to price — has the assessment been appealed recently, and will the sale trigger a re-assessment?
- Is there a deadline driving the sale (1031 exchange, divorce, estate, relocation)? That informs how much negotiation room exists.
- Schools are D-rated, which usually means shorter tenancies and higher turnover. Who's the typical renter profile here, and what's been the actual vacancy rate?
- Crime grade is D in this area — have there been break-ins, vandalism, or insurance claims at this property in the last 3 years? What carrier currently insures it and at what premium?
- What's the average days-on-market for RENTAL listings here right now (not sales)? A rising rental-DOM trend means longer vacancies and softer asking-rent achievability than the comps imply.
- What's the recent tenant-quality profile in this submarket — average credit score on applications, eviction rate, late-payment / NSF rate, and stable-employment percentage? A property-management company in the area should have these aggregated.
- How much new apartment / multifamily construction is in the pipeline within 1–3 miles? Heavy new supply (>2% of stock underway) typically softens rents 12–24 months out; light construction supports rent growth.
Investment metrics
- 1% rule
- 1.78% ✓
- Cap rate
- 13.51%
- Cash-on-cash
- 25.78%
- DSCR
- 2.15
- GRM
- 4.7
CMA / ARV
- ARV (on-the-fly)
- $417,222
- Comps found
- 10
Show comp detail 10 sales within ~0.75 mi
| Address | Dist | Beds/Ba | Sqft | Sold | Price | $/sf | Match |
|---|---|---|---|---|---|---|---|
| 895 Baldwin St | 0.08mi | 6/3.0 (-1) | 3,645 (+2%) | 2mo | $360,000 | $99 | 86 |
| 127 Lounsbury St | 0.12mi | 7/3.0 | 3,204 (-10%) | 1mo | $420,000 | $131 | 77 |
| 73 South St | 0.18mi | 6/3.0 (-1) | 3,240 (-9%) | 2mo | $399,900 | $123 | 69 |
| 98 Sylvan Ave | 0.37mi | 8/3.0 (+1) | 3,468 (-3%) | 16mo | $400,000 | $115 | 60 |
| 1599 S Main St | 0.38mi | 7/3.0 | 3,936 (+10%) | 12mo | $300,000 | $76 | 55 |
| 73 Lounsbury St | 0.16mi | 6/3.0 (-1) | 3,096 (-13%) | 20mo | $350,000 | $113 | 49 |
| 144 Washington St | 0.30mi | 6/3.0 (-1) | 3,108 (-13%) | 17mo | $400,000 | $129 | 46 |
| 48 South St | 0.23mi | 8/3.0 (+1) | 3,082 (-14%) | 20mo | $360,000 | $117 | 45 |
| 20 Stiles St | 0.45mi | 6/3.0 (-1) | 4,095 (+15%) | 8mo | $415,000 | $101 | 42 |
| 73 E Dover St | 0.66mi | 8/4.0 (+1) | 3,320 (-7%) | 11mo | $415,000 | $125 | 40 |
Match score weights: distance 35% · size 25% · config 20% · recency 20%. Top-matched comps best support the ARV.
Projected returns pro-forma
1.39% appreciation · 3.0% rent growth · sell at horizon
- IRR
- 28.8%
- Equity multiple
- 2.51×
- Total profit
- $118,219
- Equity at exit
- $101,370
- IRR
- 31.0%
- Equity multiple
- 4.85×
- Total profit
- $301,547
- Equity at exit
- $139,301
Cash invested: $78,400 (down + closing). Projections, not guarantees.
Landlord ↔ Tenant lean methodology
- Overall (STATE)
- 27 Tenant-Leaning
- State Connecticut
- 27 Tenant-Leaning · D+7
- County
- — inherits STATE
- City
- — inherits STATE
ZIP-level market 06706
- Home prices YoY
- 0.5%
- Active inventory
- 43
- Price-to-rent
- 14.1×
Monthly cashflow live
- Estimated rent
- $4,972 high interval (Pro) →
- Mortgage (P&I)
- −$1,468
- Tax from tax record
- −$658 /mo · $7,901/yr
- Insurance
- −$117
- HOA
- −$0
- Vacancy / Maint / Mgmt
- −$1,044
- Net cashflow
- $1,684
Break-even live
Sensitivity live
| Price | -10% $1,843 | -5% $1,764 | +0% $1,684 | +5% $1,605 | +10% $1,526 |
|---|---|---|---|---|---|
| Rent | -10% $1,292 | -5% $1,488 | +0% $1,684 | +5% $1,881 | +10% $2,077 |
| Rate | -1.0pp $1,825 | -0.5pp $1,756 | base $1,684 | +0.5pp $1,612 | +1.0pp $1,538 |
3-unit breakdown (identical units grouped — click to expand)
| Units | Beds | Baths | Est. rent |
|---|---|---|---|
| 3× units | 2 | 1 | $4,971 |
| #1 | 2 | 1 | $1,657 |
| #2 | 2 | 1 | $1,657 |
| #3 | 2 | 1 | $1,657 |
| Total (3 units) | $4,972 | ||
UW: 25.0% down · 7.5% · 30yr · 1.5% tax · 5.0% vac · 8.0% maint · 8.0% mgmt
Financing live
Cash to close
- Down payment
- $70,000
- Closing costs
- $8,400
- Reserves months
- —
- Total cash needed
- —
Loan-product check · same deal, 3 products live
Conventional
25% down · 7.5% · 30yr
- Down + closing
- —
- Monthly P&I
- —
- Monthly cashflow
- —
- DSCR
- —
- Eligible?
- —
Personal DTI + credit; lowest rate.
DSCR
20% down · 8.5% · 30yr
- Down + closing
- —
- Monthly P&I
- —
- Monthly cashflow
- —
- DSCR
- —
- Eligible?
- —
No personal income docs; deal must DSCR.
Hard money
10% down · 12.0% · 12mo
- Down + closing
- —
- Monthly P&I
- —
- Monthly cashflow
- —
- DSCR
- —
- Eligible?
- —
Short-term bridge; refi at stabilization.
Rent comps 1 comps
| Address | Beds | Baths | Sqft | Rent | $/sqft | DOM | Units | Dist |
|---|---|---|---|---|---|---|---|---|
| 14 Niagara St Waterbury, CT | 6.0 | 3.0 | 3156 | $1,700 | $0.54 | 5d | 1 | 0.96mi |
Listing history 2 events
-
2026-05-12status Under Contract
-
2026-05-12$280,000 Active
ⓘ Source: listings_history table (triggers on properties + properties_extension) + one-shot
backfill from property_details.listing_events for pre-trigger history.
Tax reassessment forecast CT · Partial reset (capped growth)
- Current annual tax
- $7,901 · $658/mo
- Projected year-2 tax
- $7,901 · $658/mo
- Expected delta
- $0/yr ($0/mo · 0.0%)
ⓘ Screening estimate from a state-policy table — verify with the county assessor before closing.
Climate risk First Street
- Flood 1/10 Low FEMA zone X (unshaded) · 0% chance over 30 yrs
- Wildfire 1/10 Low
- Heat 5/10 Major 7 d/yr ≥96°F today · 16 d/yr by 30 yrs out
- Wind 6/10 Major 27% chance of damaging wind over 30 yrs
- Air quality 3/10 Moderate 2 unhealthy d/yr today · 3 by 30 yrs out
Nearby sold comps map
Loading sold comps map…
Walkable amenities ~0.75 mi
Loading nearby amenities…
Taxation est. · year 1
- Rental income
- $59,664
- − Mortgage interest
- −$15,684
- − Property taxes
- −$7,901
- − Insurance
- −$1,400
- − Repairs & maintenance
- −$4,773
- − Management
- −$4,773
- − Depreciation
- −$8,145
- Taxable income
- $16,987
- Est. tax owed @ 24.0%
- −$4,077
- After-tax cash flow
- $16,136/yr
For passive investors: Depreciation is non-cash, so a rental often shows a tax loss while cash-flowing — sheltering income. Rental losses are passive: they offset passive income freely, and up to $25,000/yr can offset ordinary (W-2) income if you actively participate and your MAGI is under $100k (phasing out to $0 by $150k); unused losses carry forward. On sale, claimed depreciation is recaptured at up to 25%, and gains may owe capital-gains tax (a 1031 exchange can defer both). Figures are a year-1 estimate at your 24.0% rate — not tax advice; consult a CPA.
Schools (NCES district)
- District
- Waterbury School District
- NCES district ID
- 0904830
- Math proficiency
- 12% ▼ -7.00%
- Reading proficiency
- 23% ▼ -8.00%
- Median HH income
- $40,040
- Composite
- 14.85/100
- National rank
- #9380
- State rank
- #148 of 153 in CT
Livability — Waterbury
- Score
- 79/100
- State rank
- #32
- US rank
- #2205
Category grades
Schools grade is shown separately in the Schools card above.
Census & demographics
- Census place
- Waterbury, CT
- County
- New Haven County · 688,236 people
- City population
- 115,012
- Metro
- New Haven-Milford, CT
- Population (ZIP)
- 15,551
- Household income
- $52,242
- Rent vs Own
- Severe rent burden
- 801.0
Population outlook (Naugatuck Valley County) Hauer SSP2
- By 2040
- 496,846
Race, ethnicity, and origin ACS 2023
- Neighborhood character
- Highly diverse neighborhood (Simpson 0.72)
- Race & ethnicity
- Hispanic / Latino 35% White 31% Black 25% Two or more races 12% Asian 3%
- Hispanic origin (detail)
- Puerto Rican 25% Dominican 4%
- Common ancestry
- Lithuanian 3% Estonian 2% Romanian 1%
- Foreign-born
- 20% · Canada, Jamaica
- Languages at home
- 60% English-only · Spanish 27% Other Indo-European 11% Other Asian/Pacific 1%
Political lean MEDSL · Naugatuck Valley
- 2024 margin
- Lean R (+7.4) · D 45.6% · R 53.0% · Other 1.4%
- All cycles
- 2024: R+7.4
Not yet ingested
- Civics
- —
Market trends
- HPI YoY
- ▲ 1.39%
- Current HPI
- 309.8467
- Rent YoY
- —
- Metro
- New Haven-Milford, CT
- State GDP YoY
- ▲ 1.06%
- F500 in state
- 38
Industry mix (Fortune 500 HQ in CT)
| Industry | F500 HQs | Revenue |
|---|---|---|
| Industrial Machinery | 4 | $38B |
|
||
| Insurance | 3 | $71B |
|
||
| Financial Services | 2 | $25B |
|
||
| Transportation / Logistics | 2 | $18B |
|
||
| Healthcare | 1 | $247B |
|
||
| Telecommunications | 1 | $55B |
|
||
Price history
2 events — show timeline
- 2026-05-12 Pending — Smart MLS
- 2026-05-12 Listed $280,000 Smart MLS
Property tax history
+4.7%/yrLatest (2023): $7,901 · +66.9% YoY. Source: county tax records.
Cash-flow waterfall
monthlySold comps — $/sqft
last 12 mo · ≤1 miLoading sold comps…