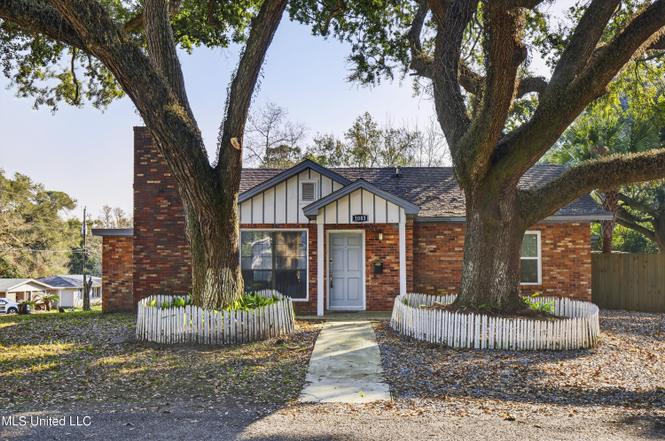
1003 Cecille St · Gulfport, MS
Flood risk 1/10 · Minimal
- FEMA flood zone
- X (unshaded)
- Chance of flooding over 30 yrs
- 0.0%
- Est. flood insurance / yr
- $507 – $1,088
Fire risk 3/10 · Minor
- Est. fire insurance / yr
- $1,241 – $2,305
Heat risk 10/10 · Severe
- Hot days now (above 106°F)
- 7 days/yr
- Hot days in 30 yrs
- 22 days/yr
Wind risk 9/10 · Severe
- Chance of severe wind over 30 yrs
- 99.0%
Air-quality risk 1/10 · Minimal
- Unhealthy air days now
- 0 days/yr
- Unhealthy air days in 30 yrs
- 0 days/yr
Risk factors via First Street. Map © Google.
Why this score? — see what drove the D- grade
The composite is a weighted blend of 9 inputs, each scored 0–100. Each bar is that input's sub-score; the figure is the points it added to the 100-point composite (weight × sub-score).
- ARV discount +11.4/15.0
- Cash flow +7.5/30.0
- Rent growth +5.0/5.0
- Livability +3.7/5.0
- Schools +3.4/10.0
- 1% rule +2.5/10.0
- Condition / age +2.5/5.0
- DSCR +1.7/10.0
- Appreciation +0.0/10.0
$179,000
🖨 Deal sheet (PDF) 📄 Offer letter ✓ Due diligence
Listing remarks MLS
Cute starter home on large corner lot. All new appliances, A/C, floors and more. This home has two living areas and lots of storage. Must see to appreciate! Home is being sold AS-IS.
Key facts
- Mature oak trees
- Large open room
- Substantial addition
Tags
Property features AI
Finance
- Other: Corner lot
Exterior
- Parking: Detached carport; Driveway; One carport space
- Utilities: Public water; Public sewer; Electricity available; Water available; Sewer available
- Home design: Single-family residence (house); One story
- Construction: Brick veneer construction; Slab foundation; Built by owner (year built source listed as Owner)
- Exterior features: Composition roof; Shed(s) on the property; See remarks for additional exterior details
Interior
- Kitchen: Kitchen on the main level
- Bedrooms: Primary bedroom on the main level; Two additional bedrooms on the main level
- Flooring: Laminate flooring; Tile flooring
- Bathrooms: Three full bathrooms
- Heating & cooling: Forced air heating; Central air conditioning
- Interior features: Five total rooms; Fireplace in the living room; Electric water heater
Neighborhood map
What this means for you Summary
Snapshot
- This is a 3-bed/1.0-bath single-family listed at $179k.
Deal economics
- At list price, monthly cash flow is $-219 ($-3k/yr) — negative.
- To cash-flow at today's rent, offer at most $140k (21.6% below list).
- To meet the 1% rule (rent ≥ 1% of price), the offer needs to be $134k (24.9% below list).
- Recommended offer: $134k (24.9% below list) — sets the bar for 1% rule.
Location & tenants
- Location reads 73/100 on livability (#15 in MS) — a middle-class / working-renter tenant base. Strengths: cost of living A+, housing A+, health & safety A+; Watch: schools D, amenities F, commute F.
- Gulfport School District (urban): math 41% / reading 42% proficiency, ranked #37 of 130 in MS (top 28%) — families likely to look elsewhere, expect single-tenant / working-renter base with shorter leases; 67% free/reduced lunch — lower-income household profile, screen leases tightly.
- Market conditions: Rents rising fast (+10.5%/yr); 252 active listings in the ZIP; 21 comparable units currently listed for rent nearby; rentals lingering (median 45d on market — plan ~5-8 weeks vacancy on turnover, expect pricing pressure); 52% of comp listings sitting > 30 days — soft ceiling on asking rent; lower-income renter base — watch delinquency; 2,194 units permitted in Harrison County in 2024 (0 in 5+ unit buildings).
- At $1,344/mo this rent would consume 46% of the median local household income ($35k/yr) (locally 1516% of renters already pay >50% of income on rent) — very limited rent-growth headroom before tenants either downsize or default.
Forward outlook
- Local home prices are declining (-3.0%/yr); year-one equity from $1k of loan paydown is wiped out by about $5k of value loss. Plan a longer hold.
- Harrison County population projected at +27% by 2050 — long-run rental-demand tailwind backs the buy-and-hold thesis.
Negotiation context
- It's been on market 117 days — a 9% lower offer ($163k) is reasonable based on typical stale-listing flexibility.
- 7 sale attempts since 14y ago; this cycle's ask has dropped $16k (8%) from the opening price — seller is motivated, your offer sets the floor, not the list.
- Current owner paid $20k; list at $179k implies a 795% gain — meaningful room to come down on a strong offer.
Risks & watch-outs
- Climate carrying-cost: severe wind risk, 99% chance of damaging wind over 30y; extreme-heat days projected 7→22/yr by 2055 (HVAC capex compounding) — expect insurance premiums to compound above CPI over the hold.
Questions for the listing agent
- What do current leases actually rent for vs. the listed asking? Can we see a recent rent roll and the last 12 months of T-12 income?
- It's been on market 117 days. Have you received any prior offers? Is the seller open to a 25% concession, seller financing, or rate buy-down credit?
- Why hasn't it sold? Are there any deal-killer items the seller is aware of (foundation, flood, title, zoning, code violations)?
- Is there a deadline driving the sale (1031 exchange, divorce, estate, relocation)? That informs how much negotiation room exists.
- Schools are D-rated, which usually means shorter tenancies and higher turnover. Who's the typical renter profile here, and what's been the actual vacancy rate?
- The area grade is low — what's the realistic commute time and amenity access for the typical tenant pool here? Any planned neighborhood developments (good or bad) we should know about?
- What's the average days-on-market for RENTAL listings here right now (not sales)? A rising rental-DOM trend means longer vacancies and softer asking-rent achievability than the comps imply.
- What's the recent tenant-quality profile in this submarket — average credit score on applications, eviction rate, late-payment / NSF rate, and stable-employment percentage? A property-management company in the area should have these aggregated.
- How much new for-sale + rental construction is in the pipeline within 1–3 miles? Heavy new supply typically softens prices + rents 12–24 months out; constrained supply supports both.
Investment metrics
- 1% rule
- 0.75% ✗
- Cap rate
- 4.83%
- Cash-on-cash
- -5.24%
- DSCR
- 0.77
- GRM
- 11.1
CMA / ARV
- ARV (on-the-fly)
- $195,776
- Comps found
- 12
Show comp detail 12 sales within ~0.75 mi
| Address | Dist | Beds/Ba | Sqft | Sold | Price | $/sf | Match |
|---|---|---|---|---|---|---|---|
| 921 Wanda Pl | 0.14mi | 3/2.0 | 1,477 (+0%) | 1mo | $229,900 | $156 | 88 |
| 1108 Oak Pl | 0.23mi | 3/2.0 | 1,459 (-1%) | 4mo | $230,000 | $158 | 81 |
| 941 22nd St | 0.46mi | 3/2.0 | 1,489 (+1%) | 2mo | $154,990 | $104 | 71 |
| 2704 Pine Ave | 0.20mi | 3/2.0 | 1,603 (+9%) | 2mo | $149,900 | $94 | 70 |
| 1211 23rd St | 0.49mi | 2/2.0 (-1) | 1,433 (-3%) | 1mo | $159,900 | $112 | 63 |
| 1901 Jones Ave | 0.46mi | 3/2.0 | 1,560 (+6%) | 2mo | $210,000 | $135 | 62 |
| 1601 25th St | 0.75mi | 3/1.0 | 1,502 (+2%) | 0mo | $120,000 | $80 | 61 |
| 2903 Audubon Dr | 0.39mi | 3/2.0 | 1,350 (-8%) | 6mo | $118,800 | $88 | 59 |
| 3307 Johnson Dr | 0.52mi | 4/2.0 (+1) | 1,400 (-5%) | 2mo | $119,000 | $85 | 57 |
| 2313 Gulf Ave | 0.41mi | 4/2.0 (+1) | 1,620 (+10%) | 1mo | $225,000 | $139 | 54 |
| 910 22nd St | 0.46mi | 2/2.0 (-1) | 1,281 (-13%) | 3mo | $169,900 | $133 | 46 |
| 954 E Beach Blvd | 0.69mi | 3/2.5 | 1,688 (+15%) | 3mo | $824,900 | $489 | 35 |
Match score weights: distance 35% · size 25% · config 20% · recency 20%. Top-matched comps best support the ARV.
Projected returns pro-forma
-3.0% appreciation · 8.0% rent growth · sell at horizon
- IRR
- -19.6%
- Equity multiple
- 0.29×
- Total profit
- $-35,802
- Equity at exit
- $26,689
- IRR
- -4.1%
- Equity multiple
- 0.67×
- Total profit
- $-16,623
- Equity at exit
- $15,477
Cash invested: $50,120 (down + closing). Projections, not guarantees.
Landlord ↔ Tenant lean methodology
- Overall (STATE)
- 90 Strongly Landlord-Friendly
- State Mississippi
- 90 Strongly Landlord-Friendly · R+11
- County
- — inherits STATE
- City
- — inherits STATE
ZIP-level market 39501
- Home prices YoY
- -34.5%
- Rents YoY
- 10.5%
- Active inventory
- 252
- Price-to-rent
- 11.1×
Monthly cashflow live
- Estimated rent
- $1,344 high interval (Pro) →
- Mortgage (P&I)
- −$939
- Tax from tax record
- −$267 /mo · $3,205/yr
- Insurance
- −$75
- HOA
- −$0
- Vacancy / Maint / Mgmt
- −$282
- Net cashflow
- $-219
Break-even live
Sensitivity live
| Price | -10% $-118 | -5% $-168 | +0% $-219 | +5% $-270 | +10% $-320 |
|---|---|---|---|---|---|
| Rent | -10% $-325 | -5% $-272 | +0% $-219 | +5% $-166 | +10% $-113 |
| Rate | -1.0pp $-129 | -0.5pp $-173 | base $-219 | +0.5pp $-265 | +1.0pp $-313 |
UW: 25.0% down · 7.5% · 30yr · 1.5% tax · 5.0% vac · 8.0% maint · 8.0% mgmt
Financing live
Cash to close
- Down payment
- $44,750
- Closing costs
- $5,370
- Reserves months
- —
- Total cash needed
- —
Loan-product check · same deal, 3 products live
Conventional
25% down · 7.5% · 30yr
- Down + closing
- —
- Monthly P&I
- —
- Monthly cashflow
- —
- DSCR
- —
- Eligible?
- —
Personal DTI + credit; lowest rate.
DSCR
20% down · 8.5% · 30yr
- Down + closing
- —
- Monthly P&I
- —
- Monthly cashflow
- —
- DSCR
- —
- Eligible?
- —
No personal income docs; deal must DSCR.
Hard money
10% down · 12.0% · 12mo
- Down + closing
- —
- Monthly P&I
- —
- Monthly cashflow
- —
- DSCR
- —
- Eligible?
- —
Short-term bridge; refi at stabilization.
Rent comps 21 comps
| Address | Beds | Baths | Sqft | Rent | $/sqft | DOM | Units | Dist |
|---|---|---|---|---|---|---|---|---|
| 2706 6th Ave Gulfport, MS | 3.0 | 2.0 | 1217 | $1,300 | $1.07 | 22d | 1 | 0.07mi |
| 2823 6th Ave Unit A Gulfport, MS | 3.0 | 2.0 | 1100 | $1,100 | $1.00 | 22d | 1 | 0.17mi |
| 2311 5th Ave Gulfport, MS | 3.0 | 1.5 | 1100 | $1,300 | $1.18 | 45d | 1 | 0.31mi |
| 2233 5th Ave Gulfport, MS | 3.0 | 1.0 | 1215 | $1,300 | $1.07 | 45d | 1 | 0.35mi |
| 1224 29th St Gulfport, MS | 2.0 | 2.0 | 1050 | $1,155 | $1.10 | 14d | 1 | 0.37mi |
| 941 22nd St Gulfport, MS | 3.0 | 2.0 | 1450 | $1,600 | $1.10 | 14d | 1 | 0.44mi |
| 1400 28th St Gulfport, MS | 2.0–3.0 | 2.0 | 1101 | $1,085 | $0.99 | 14d | 1 | 0.61mi |
| 3333 12th Ave Unit 6 Gulfport, MS | 2.0 | 2.5 | 1000 | $899 | $0.90 | 45d | 1 | 0.68mi |
| 3333 12th Ave Gulfport, MS | 2.0 | 2.0 | 1000 | $899 | $0.90 | 45d | 1 | 0.68mi |
| 3508 Nunnally St Gulfport, MS | 4.0 | 3.0 | 1718 | $2,200 | $1.28 | 14d | 1 | 0.71mi |
| 3508 Nunnally St Gulfport, MS | 4.0 | 2.5 | 1718 | $2,200 | $1.28 | 45d | 1 | 0.71mi |
| 2207 16th Ave Gulfport, MS | 2.0 | 1.0 | 1325 | $1,425 | $1.08 | 14d | 1 | 0.85mi |
| 1605 20th St Gulfport, MS | 3.0 | 3.0 | 1350 | $1,095 | $0.81 | 45d | 1 | 0.87mi |
| 2227 17th Ave Gulfport, MS | 2.0 | 1.0 | 1000 | $850 | $0.85 | 45d | 1 | 0.89mi |
| 124 30th 1/2 St Gulfport, MS | 2.0 | 1.5 | 1007 | $1,100 | $1.09 | 45d | 1 | 0.93mi |
| 3209 F Ave Gulfport, MS | 2.0 | 1.0 | 1000 | $850 | $0.85 | 45d | 1 | 0.95mi |
| 1511 2nd St Gulfport, MS | 3.0 | 1.5 | 1030 | $2,000 | $1.94 | 45d | 1 | 0.95mi |
| 2110 30th St Gulfport, MS | 2.0 | 2.0 | 950 | $950 | $1.00 | 22d | 1 | 1.18mi |
| 1822 15th St Gulfport, MS | 2.0 | 2.0 | 1100 | $1,900 | $1.73 | 45d | 1 | 1.32mi |
| 3503 Hancock Ave Gulfport, MS | 2.0 | 2.5 | 1100 | $1,100 | $1.00 | 22d | 1 | 1.34mi |
| 2317 30th St Gulfport, MS | 2.0 | 1.0 | 1164 | $2,150 | $1.85 | 22d | 1 | 1.35mi |
Listing history 29 events
-
2026-06-09status $179,000 Pending 117 DOM
-
2026-06-08days on market $179,000 Active 117 DOM
-
2026-06-07days on market $179,000 Active 116 DOM
-
2026-06-05days on market $179,000 Active 113 DOM
-
2026-06-02days on market $179,000 Active 111 DOM
-
2026-06-01days on market $179,000 Active 110 DOM
-
2026-05-31days on market $179,000 Active 109 DOM
-
2026-05-30days on market $179,000 Active 108 DOM
-
2026-05-20status Active
-
2026-05-05status Pending
-
2026-05-05status Active
-
2026-04-27historical
-
2026-04-20price $179,000
-
2026-02-03price $189,000
-
2026-01-19$195,000 Active
-
2025-11-08price $175,000
-
2025-08-05price $194,000
-
2025-06-18$198,000 Active
-
2022-11-15soldstatus
-
2022-10-28soldstatus Closed 186-char remark
Show marketing remark (186 chars)
Cute starter home on large corner lot. All new appliances, A/C, floors and more. This home has two living areas and lots of storage. Must see to appreciate! Home is being sold AS-IS.
-
2022-09-14status Pending 186-char remark
Show marketing remark (186 chars)
Cute starter home on large corner lot. All new appliances, A/C, floors and more. This home has two living areas and lots of storage. Must see to appreciate! Home is being sold AS-IS.
-
2022-09-09$160,000 Active 186-char remark
Show marketing remark (186 chars)
Cute starter home on large corner lot. All new appliances, A/C, floors and more. This home has two living areas and lots of storage. Must see to appreciate! Home is being sold AS-IS.
-
2022-01-12soldstatus
-
2022-01-12soldstatus
-
2013-04-30soldstatus $20,000
-
2013-04-29soldstatus
-
2012-11-28$23,900
-
2012-10-01historical
-
2012-09-05$49,900
ⓘ Source: listings_history table (triggers on properties + properties_extension) + one-shot
backfill from property_details.listing_events for pre-trigger history.
Tax reassessment forecast MS · Resets to sale price
- Current annual tax
- $3,205 · $267/mo
- Projected year-2 tax
- $3,205 · $267/mo
- Expected delta
- $0/yr ($0/mo · -0.0%)
ⓘ Screening estimate from a state-policy table — verify with the county assessor before closing.
Climate risk First Street
- Flood 1/10 Low FEMA zone X (unshaded) · 0% chance over 30 yrs
- Wildfire 3/10 Moderate
- Heat 10/10 Extreme 7 d/yr ≥106°F today · 22 d/yr by 30 yrs out
- Wind 9/10 Extreme 99% chance of damaging wind over 30 yrs
- Air quality 1/10 Low 0 unhealthy d/yr today · 0 by 30 yrs out
Nearby sold comps map
Loading sold comps map…
Walkable amenities ~0.75 mi
Loading nearby amenities…
Taxation est. · year 1
- Rental income
- $16,123
- − Mortgage interest
- −$10,027
- − Property taxes
- −$3,205
- − Insurance
- −$895
- − Repairs & maintenance
- −$1,290
- − Management
- −$1,290
- − Depreciation
- −$5,207
- Taxable loss
- −$5,791
- Est. tax savings @ 24.0%
- +$1,390
- After-tax cash flow
- $-1,237/yr
For passive investors: Depreciation is non-cash, so a rental often shows a tax loss while cash-flowing — sheltering income. Rental losses are passive: they offset passive income freely, and up to $25,000/yr can offset ordinary (W-2) income if you actively participate and your MAGI is under $100k (phasing out to $0 by $150k); unused losses carry forward. On sale, claimed depreciation is recaptured at up to 25%, and gains may owe capital-gains tax (a 1031 exchange can defer both). Figures are a year-1 estimate at your 24.0% rate — not tax advice; consult a CPA.
Schools (NCES district)
- District
- Gulfport School District
- NCES district ID
- 2801710
- Math proficiency
- 41% ▼ -15.00%
- Reading proficiency
- 42% ▼ -6.00%
- Median HH income
- $35,712
- Composite
- 34.38/100
- National rank
- #5213
- State rank
- #37 of 130 in MS
Livability — Gulfport
- Score
- 73/100
- State rank
- #15
- US rank
- #5010
Category grades
Schools grade is shown separately in the Schools card above.
Census & demographics
- Census place
- Gulfport, MS
- County
- Harrison County · 178,171 people
- City population
- 96,188
- Metro
- Gulfport-Biloxi, MS
- Population (ZIP)
- 22,565
- Household income
- $34,758
- Rent vs Own
- Severe rent burden
- 1516.0
Population outlook (Harrison County) Hauer SSP2
- Today (2025)
- 228,444 people
- By 2030
- 241,942 · +5.9%
- By 2040
- 267,531 · +17.1%
- By 2050
- 291,062 · +27.4%
- By 2075
- 346,711 · +51.8%
- By 2100
- 378,165 · +65.5%
Race, ethnicity, and origin ACS 2023
- Neighborhood character
- Diverse neighborhood (Simpson 0.56)
- Race & ethnicity
- Black 59% White 29% Two or more races 7% Hispanic / Latino 5%
- Hispanic origin (detail)
- Mexican 2%
- Common ancestry
- Lithuanian 2% Serbian 1% Slovak 1%
- Foreign-born
- 2% · Canada
- Languages at home
- 95% English-only · Spanish 4%
Political lean MEDSL · Harrison
- 2024 margin
- Strong R (+28.9) · D 35.0% · R 63.9% · Other 1.1%
- 2008→2024 swing
- -2.9pp toward R · 2008: -26.0pp · 2024: -28.9pp
- All cycles
- 2024: R+28.9 2020: R+25.2 2016: R+30.7 2012: R+26.6 2008: R+26.0
Not yet ingested
- Civics
- —
Market trends
- HPI YoY
- ▼ -110.16%
- Current HPI
- 208.998
- Rent YoY
- ▲ 10.49%
- Metro
- Gulfport-Biloxi, MS
- State GDP YoY
- —
- F500 in state
- 0
Price history
+258.7% since first listed21 events — show timeline
- 2026-05-20 Relisted — MLSU
- 2026-05-05 Pending — MLSU
- 2026-05-05 Relisted — MLSU
- 2026-04-27 Listing Removed — MLSU
- 2026-04-20 Price Changed $179,000 MLSU
- 2026-02-03 Price Changed $189,000 MLSU
- 2026-01-19 Listed $195,000 MLSU
- 2025-11-08 Price Changed $175,000 PRCBOR
- 2025-08-05 Price Changed $194,000 PRCBOR
- 2025-06-18 Listed $198,000 PRCBOR
- 2022-11-15 Sold (Public Records) — Public Records
- 2022-10-28 Sold (MLS) — MLSU
- 2022-09-14 Pending — MLSU
- 2022-09-09 Listed $160,000 MLSU
- 2022-01-12 Sold (Public Records) — Public Records
- 2022-01-12 Sold (Public Records) — Public Records
- 2013-04-30 Sold (Public Records) $20,000 Public Records
- 2013-04-29 Sold (MLS) — MLSU
- 2012-11-28 Listed $23,900 MLSU
- 2012-10-01 Listing Removed — MLSU
- 2012-09-05 Listed $49,900 MLSU
Property tax history
+14.6%/yrLatest (2025): $3,205 · +4.7% YoY. Source: county tax records.
Cash-flow waterfall
monthlySold comps — $/sqft
last 12 mo · ≤1 miLoading sold comps…