 Duplex
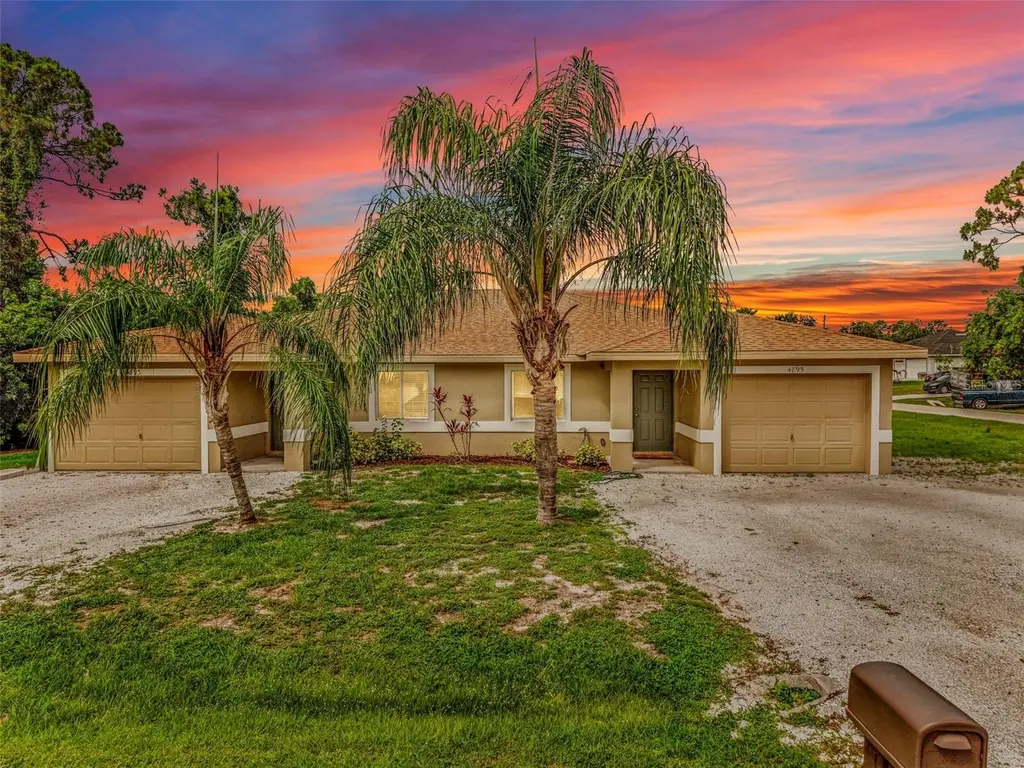
4893/4895 29th St SW · Lehigh Acres, FL
Flood risk 5/10 · Moderate
- FEMA flood zone
- X (unshaded)
- Chance of flooding over 30 yrs
- 0.66%
- Est. flood insurance / yr
- $507 – $1,088
Fire risk 3/10 · Minor
- Est. fire insurance / yr
- $947 – $1,759
Heat risk 10/10 · Severe
- Hot days now (above 107°F)
- 7 days/yr
- Hot days in 30 yrs
- 29 days/yr
Wind risk 10/10 · Severe
- Chance of severe wind over 30 yrs
- 99.0%
Air-quality risk 2/10 · Minimal
- Unhealthy air days now
- 1 days/yr
- Unhealthy air days in 30 yrs
- 1 days/yr
Risk factors via First Street. Map © Google.
Why this score? — see what drove the C- grade
The composite is a weighted blend of 9 inputs, each scored 0–100. Each bar is that input's sub-score; the figure is the points it added to the 100-point composite (weight × sub-score).
- ARV discount +15.0/15.0
- Cash flow +14.9/30.0
- DSCR +4.6/10.0
- 1% rule +4.1/10.0
- Schools +4.1/10.0
- Condition / age +3.8/5.0
- Livability +3.0/5.0
- Appreciation +0.8/10.0
- Rent growth +0.8/5.0
$382,500
🖨 Deal sheet (PDF) 📄 Offer letter ✓ Due diligence
Multi-family units
County records classify this as Multi-Family (2-4 Unit). Listing-text estimate: 2 units. confirmed
Listing remarks
Under contract-accepting backup offers. Excellent investment opportunity in the rapidly growing Lehigh Acres market! This well-maintained duplex offers two spacious 3-bedroom, 2-bathroom units, each with a 1-car garage and private entrance, making it highly desirable for long-term tenants. Built in 2005 with solid block construction and located in Flood Zone X with no flood insurance required, this property checks all the boxes for investors seeking stable cash flow and low maintenance ownership. Each side features over 1,100 square feet of living space with open floorplans, tile flooring in main living areas, central water, septic, and separately functional layouts ideal for maximizing ren
Key facts
- Flood zone x
- Private entrance
- Tile flooring
Tags
Property features AI
Finance
- Other: Property type: Residential income (duplex); Total buildings: 1; Zoning: RM-2; Lot size approx. 0.28 acres (1/4 to less than 1/2 acre)
- Financial info: Annual net income reported: $30,230; Pro forma rent indicated at $1,695 per unit; One unit currently leased at $1,495 (lease expires June 30)
- HOA & community: No association
Exterior
- Parking: Driveway and off-street parking; Two garage spaces (one garage space per unit), attached garages
- Utilities: Public water; Septic tank; Cable, electricity, and water connected
- Home design: Duplex residential income property; Single-story (one level)
- Construction: Block and stucco construction; Shingle roof; Slab foundation; Built as completed (existing condition)
- Exterior features: Patio; Rain gutters; Lap pool
Interior
- Bedrooms: Two 3-bedroom units (one 3-bed unit occupied in each side)
- Bathrooms: Each unit has 2 bathrooms
- Heating & cooling: Central heating (electric); Central air conditioning
- Interior features: Ceiling fans
- Laundry & utility: Laundry located in the garage
Neighborhood map
What this means for you Summary
Snapshot
- This is a 2 × 3-bed/2.0-bath units multifamily listed at $382k. Condition is rated good.
Deal economics
- At list price, monthly cash flow is $111 ($1k/yr) — positive. Per door: $56/mo.
- The deal already cash-flows at list — no discount required.
- To meet the 1% rule (rent ≥ 1% of price), the offer needs to be $349k (8.8% below list).
- Recommended offer: $349k (8.8% below list) — sets the bar for 1% rule.
- Cap rate 6.6% vs local median 4.7% in Lehigh Acres — top-decile yield for the area; either an underpriced asset or a hidden risk that comps aren't pricing in. Stress-test before assuming the spread holds.
Location & tenants
- Location reads 59/100 on livability (#826 in FL) — a working-class tenant base; expect higher turnover. Strengths: cost of living A+, housing A+; Watch: crime C-, employment D+, amenities F.
- Lee (suburban): math 47% / reading 50% proficiency, ranked #42 of 73 in FL (top 58%) — families likely to look elsewhere, expect single-tenant / working-renter base with shorter leases.
- Zoned schools: Gateway Elementary School (math 58% / reading 49%, grade C, #949 of 2,144 statewide, top 45%, 840 students, 48% FRL); Oak Hammock Middle School (math 43% / reading 41%, grade D-, #340 of 571 statewide, top 61%, 1,563 students, 56% FRL); Lehigh Senior High School (math 23% / reading 45%, grade F, #394 of 667 statewide, top 60%, 2,476 students, 57% FRL) — zoned schools at 54% FRL track the district average.
- Market conditions: Rents falling (-7.0%/yr); 295 active listings in the ZIP; 4 comparable units currently listed for rent nearby; rentals at typical pace (median 26d on market — plan ~3-4 weeks tenant-placement turnaround); 15,411 units permitted in Lee County in 2024 (4,686 in 5+ unit buildings).
- At $3,487/mo this rent would consume 69% of the median local household income ($61k/yr) (locally 1142% of renters already pay >50% of income on rent) — very limited rent-growth headroom before tenants either downsize or default.
Forward outlook
- Local home prices are declining (-3.0%/yr); year-one equity from $3k of loan paydown is wiped out by about $11k of value loss. Plan a longer hold.
- Lee County population projected at +44% by 2050 — long-run rental-demand tailwind backs the buy-and-hold thesis.
Negotiation context
- Only 11 days on market — expect competitive offers; lowballing is unlikely to land.
Risks & watch-outs
- Climate carrying-cost: moderate flood risk; severe wind risk, 99% chance of damaging wind over 30y; extreme-heat days projected 7→29/yr by 2055 (HVAC capex compounding) — expect insurance premiums to compound above CPI over the hold.
Questions for the listing agent
- Can we see the unit-by-unit rent roll, current vacancy, and any below-market leases? What's the average tenancy length?
- What capital expenditures (roof, boiler, parking lot, exteriors) have been made in the last 5 years, and what's planned in the next 2?
- Is there a deadline driving the sale (1031 exchange, divorce, estate, relocation)? That informs how much negotiation room exists.
- Schools are D-rated, which usually means shorter tenancies and higher turnover. Who's the typical renter profile here, and what's been the actual vacancy rate?
- What's the average days-on-market for RENTAL listings here right now (not sales)? A rising rental-DOM trend means longer vacancies and softer asking-rent achievability than the comps imply.
- What's the recent tenant-quality profile in this submarket — average credit score on applications, eviction rate, late-payment / NSF rate, and stable-employment percentage? A property-management company in the area should have these aggregated.
- How much new apartment / multifamily construction is in the pipeline within 1–3 miles? Heavy new supply (>2% of stock underway) typically softens rents 12–24 months out; light construction supports rent growth.
Investment metrics
- 1% rule
- 0.91% ✗
- Cap rate
- 6.64%
- Cash-on-cash
- 1.25%
- DSCR
- 1.06
- GRM
- 9.1
CMA / ARV
- ARV (on-the-fly)
- $517,260
- Comps found
- 9
Show comp detail 9 sales within ~0.75 mi
| Address | Dist | Beds/Ba | Sqft | Sold | Price | $/sf | Match |
|---|---|---|---|---|---|---|---|
| 4909-4911 28th St SW | 0.09mi | 6/4.0 | 2,392 (+3%) | 9mo | $550,000 | $230 | 84 |
| 2413-2415 Ansel Ave S | 0.50mi | 6/4.0 | 2,398 (+3%) | 1mo | $460,000 | $192 | 71 |
| 2405/2407 Paul Ave S | 0.32mi | 6/4.0 | 2,352 (+1%) | 22mo | $445,000 | $189 | 65 |
| 4937/4939 Leonard Blvd S | 0.46mi | 6/4.0 | 2,238 (-4%) | 18mo | $400,000 | $179 | 57 |
| 4921 Golfview Blvd | 0.55mi | 6/4.0 | 2,362 (+1%) | 22mo | $435,000 | $184 | 54 |
| 2229/2231 Armour Rd | 0.70mi | 6/4.0 | 2,351 (+1%) | 20mo | $530,000 | $225 | 49 |
| 4452-4454 Golfview Blvd | 0.68mi | 6/4.0 | 2,400 (+3%) | 20mo | $550,000 | $229 | 47 |
| 2220 - 2222 Keith Ave S | 0.71mi | 6/4.0 | 2,350 (+1%) | 24mo | $540,000 | $230 | 46 |
| 4732-4734 29th St SW | 0.71mi | 6/4.0 | 2,500 (+7%) | 24mo | $555,000 | $222 | 35 |
Match score weights: distance 35% · size 25% · config 20% · recency 20%. Top-matched comps best support the ARV.
Projected returns pro-forma
-3.0% appreciation · 0.0% rent growth · sell at horizon
- IRR
- -17.7%
- Equity multiple
- 0.39×
- Total profit
- $-65,055
- Equity at exit
- $57,032
- IRR
- -17.0%
- Equity multiple
- 0.19×
- Total profit
- $-86,795
- Equity at exit
- $33,072
Cash invested: $107,100 (down + closing). Projections, not guarantees.
Landlord ↔ Tenant lean methodology
- Overall (STATE)
- 87 Strongly Landlord-Friendly
- State Florida
- 87 Strongly Landlord-Friendly · R+3
- County
- — inherits STATE
- City
- — inherits STATE
ZIP-level market 33973
- Home prices YoY
- -3.4%
- Rents YoY
- -7.0%
- Active inventory
- 295
- Price-to-rent
- 18.3×
Monthly cashflow live
- Estimated rent
- $3,487 high interval (Pro) →
- Mortgage (P&I)
- −$2,006
- Tax est. 1.5%
- −$478 /mo · $5,738/yr
- Insurance
- −$159
- HOA
- −$0
- Vacancy / Maint / Mgmt
- −$732
- Net cashflow
- $111
Break-even live
Sensitivity live
| Price | -10% $376 | -5% $244 | +0% $111 | +5% $-21 | +10% $-153 |
|---|---|---|---|---|---|
| Rent | -10% $-164 | -5% $-26 | +0% $111 | +5% $249 | +10% $387 |
| Rate | -1.0pp $304 | -0.5pp $209 | base $111 | +0.5pp $12 | +1.0pp $-89 |
2-unit breakdown (identical units grouped — click to expand)
| Units | Beds | Baths | Est. rent |
|---|---|---|---|
| 2× units | 3 | 2 | $3,488 |
| #1 | 3 | 2 | $1,744 |
| #2 | 3 | 2 | $1,744 |
| Total (2 units) | $3,487 | ||
UW: 25.0% down · 7.5% · 30yr · 1.5% tax · 5.0% vac · 8.0% maint · 8.0% mgmt
Financing live
Cash to close
- Down payment
- $95,625
- Closing costs
- $11,475
- Reserves months
- —
- Total cash needed
- —
Loan-product check · same deal, 3 products live
Conventional
25% down · 7.5% · 30yr
- Down + closing
- —
- Monthly P&I
- —
- Monthly cashflow
- —
- DSCR
- —
- Eligible?
- —
Personal DTI + credit; lowest rate.
DSCR
20% down · 8.5% · 30yr
- Down + closing
- —
- Monthly P&I
- —
- Monthly cashflow
- —
- DSCR
- —
- Eligible?
- —
No personal income docs; deal must DSCR.
Hard money
10% down · 12.0% · 12mo
- Down + closing
- —
- Monthly P&I
- —
- Monthly cashflow
- —
- DSCR
- —
- Eligible?
- —
Short-term bridge; refi at stabilization.
Rent comps 4 comps
| Address | Beds | Baths | Sqft | Rent | $/sqft | DOM | Units | Dist |
|---|---|---|---|---|---|---|---|---|
| 2216 Leda Ave S Lehigh Acres, FL | 5.0 | 3.0 | 2750 | $2,470 | $0.90 | 17d | 1 | 0.80mi |
| 5214 25th St SW Lehigh Acres, FL | 6.0 | 4.0 | 2316 | $1,600 | $0.69 | 25d | 1 | 1.07mi |
| 10849 Timber Creek Dr Fort Myers, FL | 5.0 | 4.5 | 3357 | $4,000 | $1.19 | 25d | 1 | 1.11mi |
| 1133 Ichabod Ave Lehigh Acres, FL | 6.0 | 4.0 | 2376 | $2,100 | $0.88 | 25d | 1 | 1.21mi |
Listing history 10 events
-
2026-06-17status $382,500 Pending 11 DOM
-
2026-06-17days on market $382,500 Active 11 DOM
-
2026-06-16days on market $382,500 Active 10 DOM
-
2026-06-15days on market $382,500 Active 9 DOM
-
2026-06-13days on market $382,500 Active 7 DOM
-
2026-06-10days on market $382,500 Active 4 DOM
-
2026-06-09days on market $382,500 Active 3 DOM
-
2026-06-08days on market $382,500 Active 2 DOM
-
2026-06-07remarks 699-char remark
-
2026-06-07$382,500 Active 1 DOM
ⓘ Source: listings_history table (triggers on properties + properties_extension) + one-shot
backfill from property_details.listing_events for pre-trigger history.
Climate risk First Street
- Flood 5/10 Major FEMA zone X (unshaded) · 66% chance over 30 yrs
- Wildfire 3/10 Moderate
- Heat 10/10 Extreme 7 d/yr ≥107°F today · 29 d/yr by 30 yrs out
- Wind 10/10 Extreme 99% chance of damaging wind over 30 yrs
- Air quality 2/10 Low 1 unhealthy d/yr today · 1 by 30 yrs out
Nearby sold comps map
Loading sold comps map…
Walkable amenities ~0.75 mi
Loading nearby amenities…
Taxation est. · year 1
- Rental income
- $41,844
- − Mortgage interest
- −$21,426
- − Property taxes
- −$5,738
- − Insurance
- −$1,912
- − Repairs & maintenance
- −$3,348
- − Management
- −$3,348
- − Depreciation
- −$11,127
- Taxable loss
- −$5,054
- Est. tax savings @ 24.0%
- +$1,213
- After-tax cash flow
- $2,549/yr
For passive investors: Depreciation is non-cash, so a rental often shows a tax loss while cash-flowing — sheltering income. Rental losses are passive: they offset passive income freely, and up to $25,000/yr can offset ordinary (W-2) income if you actively participate and your MAGI is under $100k (phasing out to $0 by $150k); unused losses carry forward. On sale, claimed depreciation is recaptured at up to 25%, and gains may owe capital-gains tax (a 1031 exchange can defer both). Figures are a year-1 estimate at your 24.0% rate — not tax advice; consult a CPA.
Condition & rehab AI · 13 photos
This well-maintained and updated two-unit property in Lehigh Acres offers a good investment opportunity with minimal repairs needed.
Value-add opportunities
- Both Landscaping — Enhances curb appeal and property value
- Both Painting exterior — Fresh paint can improve curb appeal and property value
- Both Landscaping and curb appeal — Improves property's visual appeal and can attract more tenants
Renovation cost estimate screening
Value-add ROI direction
- Both Landscaping — Enhances curb appeal and property value ↑
- Both Painting exterior — Fresh paint can improve curb appeal and property value ↑
- Both Landscaping and curb appeal — Improves property's visual appeal and can attract more tenants ↑
ⓘ Cost ranges are severity-bucket heuristics (US national rule-of-thumb). Get contractor quotes + a written scope before underwriting a rehab budget.
Schools (NCES district)
- District
- Lee
- NCES district ID
- 1201080
- Math proficiency
- 47% ▼ -11.00%
- Reading proficiency
- 50% ▼ -4.00%
- Median HH income
- $49,518
- Composite
- 41.49/100
- National rank
- #3458
- State rank
- #42 of 73 in FL
Livability — Lehigh Acres
- Score
- 59/100
- State rank
- #826
- US rank
- #20055
Category grades
Schools grade is shown separately in the Schools card above.
Census & demographics
- Census place
- Lehigh Acres, FL
- County
- Lee County · 788,662 people
- City population
- 130,638
- Metro
- Cape Coral-Fort Myers, FL
- Population (ZIP)
- 14,392
- Household income
- $60,530
- Rent vs Own
- Severe rent burden
- 1142.0
Population outlook (Lee County) Hauer SSP2
- Today (2025)
- 871,946 people
- By 2030
- 955,468 · +9.6%
- By 2040
- 1,113,587 · +27.7%
- By 2050
- 1,256,891 · +44.1%
- By 2075
- 1,560,270 · +78.9%
- By 2100
- 1,726,848 · +98.0%
Race, ethnicity, and origin ACS 2023
- Neighborhood character
- Diverse neighborhood (Simpson 0.67)
- Race & ethnicity
- Hispanic / Latino 41% Black 36% Two or more races 21% White 18%
- Hispanic origin (detail)
- Mexican 21% Puerto Rican 7% Cuban 4% Dominican 1%
- Common ancestry
- Hispanic 14% Russian 1% Estonian 1%
- Foreign-born
- 23% · Canada, China
- Languages at home
- 54% English-only · Spanish 31% French/Haitian/Cajun 13% Other Indo-European 1%
Political lean MEDSL · Lee
- 2024 margin
- Strong R (+28.4) · D 35.5% · R 63.9%
- 2008→2024 swing
- -18.0pp toward R · 2008: -10.4pp · 2024: -28.4pp
- All cycles
- 2024: R+28.4 2020: R+19.2 2016: R+20.4 2012: R+16.6 2008: R+10.4
Not yet ingested
- Civics
- —
Market trends
- HPI YoY
- ▼ -8.43%
- Current HPI
- 237.694
- Rent YoY
- ▼ -6.99%
- Metro
- Cape Coral-Fort Myers, FL
- State GDP YoY
- ▲ 3.28%
- F500 in state
- 36
Industry mix (Fortune 500 HQ in FL)
| Industry | F500 HQs | Revenue |
|---|---|---|
| Industrial Technology | 2 | $29B |
|
||
| Insurance | 2 | $17B |
|
||
| Retail | 1 | $60B |
|
||
| Technology Distribution | 1 | $58B |
|
||
| Homebuilding | 1 | $35B |
|
||
| Technology Manufacturing | 1 | $35B |
|
||
Price history
1 event — show timeline
- 2026-06-06 Listed $382,500 Stellar MLS as Distributed by MLS Grid
Cash-flow waterfall
monthlySold comps — $/sqft
last 12 mo · ≤1 miLoading sold comps…