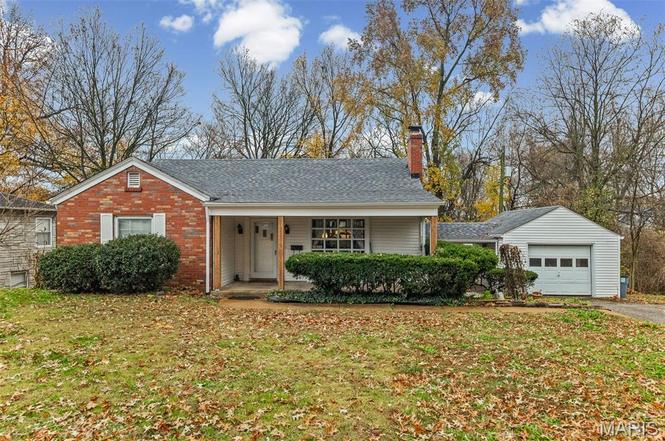
106 N 81st St · Belleville, IL
Flood risk 1/10 · Minimal
- FEMA flood zone
- X
- Chance of flooding over 30 yrs
- 0.0%
- Est. flood insurance / yr
- $473 – $860
Fire risk 1/10 · Minimal
- Est. fire insurance / yr
- $804 – $1,492
Heat risk 5/10 · Moderate
- Hot days now (above 107°F)
- 7 days/yr
- Hot days in 30 yrs
- 21 days/yr
Wind risk 2/10 · Minimal
- Chance of severe wind over 30 yrs
- 1.0%
Air-quality risk 3/10 · Minor
- Unhealthy air days now
- 2 days/yr
- Unhealthy air days in 30 yrs
- 4 days/yr
Risk factors via First Street. Map © Google.
Why this score? — see what drove the C+ grade
The composite is a weighted blend of 9 inputs, each scored 0–100. Each bar is that input's sub-score; the figure is the points it added to the 100-point composite (weight × sub-score).
- Cash flow +16.4/30.0
- ARV discount +15.0/15.0
- Appreciation +9.8/10.0
- 1% rule +5.9/10.0
- DSCR +5.1/10.0
- Livability +3.9/5.0
- Rent growth +2.5/5.0
- Condition / age +2.5/5.0
- Schools +2.2/10.0
$140,000
🖨 Deal sheet (PDF) 📄 Offer letter ✓ Due diligence
Listing remarks MLS
What a find! You will be amazed at the amount of space here! The main floor boasts a large living room with built ins, wood floors and a fireplace, formal dining room, kitchen with cozy breakfast nook, 3 bedrooms and 2 full baths. The master has his and her closets, bedroom 2 offers built ins and plenty of space and bedroom 3 has lovely hardwood floors. Finished walk out lower level offers a large rec room with tile floors, a wet bar/kitchenette and a 4th bedroom and 3/4 bath. Lots of outdoor space to enjoy.....inviting covered front porch, covered side porch between house and garage and huge covered porch overlooking the fenced yard. Main floor laundry. Move in ready!
Key facts
- 9,147 sq ft lot
- Garage
- Built 1949
Property features AI
Exterior
- Parking: Driveway; Oversized garage that faces the front; 1 garage space
- Utilities: Public water; Public sewer; Electric service by Ameren; Electricity, sewer and water connected
- Home design: Single-family residence; One level; Residential property
- Construction: Brick and brick veneer with vinyl siding; Has basement (partially finished, includes bathroom, storage, walk-out access)
- Exterior features: Covered front porch; Patio; Back yard; Adjoins wooded area; Chain link fencing
Interior
- Kitchen: Dishwasher; Disposal; Electric range; Refrigerator
- Bedrooms: 3 bedrooms (all on the main level)
- Bathrooms: 3 full bathrooms (2 on the main level, 1 in the lower level)
- Heating & cooling: Forced air heating; Central air conditioning (electric)
- Interior features: Bookcases; Ceiling fans; Storage; Living room fireplace
- Laundry & utility: Main-level laundry
Neighborhood map
What this means for you Summary
Snapshot
- This is a 3-bed/4.0-bath single-family listed at $140k.
Deal economics
- At list price, monthly cash flow is $79 ($949/yr) — positive.
- The deal already cash-flows at list — no discount required.
- Meets the 1% rule at list price ($2k rent vs $140k).
- Recommended offer: $123k (12.0% below list) — sets the bar for market timing.
Location & tenants
- Location reads 78/100 on livability (#142 in IL, #2,604 nationally) — a middle-class / working-renter tenant base. Strengths: commute A+, cost of living A+, housing A+; Watch: crime F, amenities D-.
- Belleville Twp Hsd 201 (suburban): math 21% / reading 28% proficiency, ranked #308 of 620 in IL (top 50%) — low school quality limits family demand, transient renter base, plan for 1-2y turnover.
- Zoned schools: Belleville High School-West (math 19% / reading 26%, grade F, #317 of 693 statewide, top 46%, 2,234 students, 0% FRL).
- Market conditions: 103 active listings in the ZIP; 2 comparable units currently listed for rent nearby; 783 units permitted in St. Clair County in 2024 (378 in 5+ unit buildings).
Forward outlook
- In year one you build about $14k of equity ($968 loan paydown + $13k appreciation (9.5% local appreciation)).
- St. Clair County population projected at -23% by 2050 — secular population decline; favor cash flow + early exit over multi-decade hold.
- At projected returns (9.5% appreciation + 3.0% rent growth), your $39k cash investment doubles in ~3 years — after that, you're playing with house money.
- By year 3, paydown + projected appreciation supports a ~$36k cash-out refi (75% LTV) — recoverable capital for the next deal without selling this one.
Negotiation context
- It's been on market 198 days — a 12% lower offer ($123k) is reasonable based on typical stale-listing flexibility.
- 3 sale attempts since 14y ago; this cycle's ask has dropped $40k (22%) from the opening price — seller is motivated, your offer sets the floor, not the list.
- Current owner paid $102k; 37% above their basis — modest negotiation headroom, anchor on the comps not their cost.
Risks & watch-outs
- Watch-outs: property tax is 2.8% of price; built in 1949 — expect roof / HVAC / electrical / plumbing capex.
- Climate carrying-cost: extreme-heat days projected 7→21/yr by 2055 (HVAC capex compounding) — expect insurance premiums to compound above CPI over the hold.
Questions for the listing agent
- It's been on market 198 days. Have you received any prior offers? Is the seller open to a 12% concession, seller financing, or rate buy-down credit?
- Built in 1949 — when were the roof, HVAC, electrical panel, plumbing, and water heater last replaced?
- Property tax is high relative to price — has the assessment been appealed recently, and will the sale trigger a re-assessment?
- Why hasn't it sold? Are there any deal-killer items the seller is aware of (foundation, flood, title, zoning, code violations)?
- Is there a deadline driving the sale (1031 exchange, divorce, estate, relocation)? That informs how much negotiation room exists.
- Crime grade is F in this area — have there been break-ins, vandalism, or insurance claims at this property in the last 3 years? What carrier currently insures it and at what premium?
- What's the average days-on-market for RENTAL listings here right now (not sales)? A rising rental-DOM trend means longer vacancies and softer asking-rent achievability than the comps imply.
- What's the recent tenant-quality profile in this submarket — average credit score on applications, eviction rate, late-payment / NSF rate, and stable-employment percentage? A property-management company in the area should have these aggregated.
- How much new for-sale + rental construction is in the pipeline within 1–3 miles? Heavy new supply typically softens prices + rents 12–24 months out; constrained supply supports both.
Investment metrics
- 1% rule
- 1.09% ✓
- Cap rate
- 6.97%
- Cash-on-cash
- 2.42%
- DSCR
- 1.11
- GRM
- 7.7
CMA / ARV
- ARV (on-the-fly)
- $199,584
- Comps found
- 12
Show comp detail 12 sales within ~0.75 mi
| Address | Dist | Beds/Ba | Sqft | Sold | Price | $/sf | Match |
|---|---|---|---|---|---|---|---|
| 28 S 86th St | 0.45mi | 3/1.0 | 1,842 (-0%) | 2mo | $219,900 | $119 | 65 |
| 23 N 78th St | 0.14mi | 4/2.0 (+1) | 1,680 (-9%) | 1mo | $182,000 | $108 | 65 |
| 7620 W Main St | 0.28mi | 4/2.0 (+1) | 1,672 (-10%) | 4mo | $240,000 | $144 | 54 |
| 6920 W A St | 0.67mi | 3/2.0 | 1,752 (-5%) | 2mo | $150,000 | $86 | 50 |
| 7304 Northern Dr | 0.59mi | 3/1.5 | 2,043 (+11%) | 2mo | $150,000 | $73 | 43 |
| 8706 W Main St | 0.50mi | 2/1.0 (-1) | 2,010 (+9%) | 3mo | $125,000 | $62 | 42 |
| 20 S 86th St | 0.43mi | 3/2.0 | 2,063 (+12%) | 12mo | $209,900 | $102 | 42 |
| 49 Lakeview Dr | 0.71mi | 3/2.5 | 1,720 (-7%) | 10mo | $265,000 | $154 | 41 |
| 8 Wesley Dr | 0.38mi | 3/1.5 | 2,084 (+13%) | 14mo | $237,500 | $114 | 40 |
| 24 Smalling Ct | 0.51mi | 3/1.5 | 1,570 (-15%) | 3mo | $240,000 | $153 | 38 |
| 110 N 74th St | 0.44mi | 2/1.5 (-1) | 1,636 (-12%) | 10mo | $165,000 | $101 | 37 |
| 14 S 88th St | 0.55mi | 3/1.5 | 1,583 (-14%) | 10mo | $130,000 | $82 | 32 |
Match score weights: distance 35% · size 25% · config 20% · recency 20%. Top-matched comps best support the ARV.
Projected returns pro-forma
9.5% appreciation · 3.0% rent growth · sell at horizon
- IRR
- 25.0%
- Equity multiple
- 2.95×
- Total profit
- $76,628
- Equity at exit
- $121,045
- IRR
- 22.2%
- Equity multiple
- 6.63×
- Total profit
- $220,787
- Equity at exit
- $255,817
Cash invested: $39,200 (down + closing). Projections, not guarantees.
Landlord ↔ Tenant lean methodology
- Overall (STATE)
- 43 Moderately Tenant-Leaning
- State Illinois
- 43 Moderately Tenant-Leaning · D+7
- County
- — inherits STATE
- City
- — inherits STATE
ZIP-level market 62223
- Home prices YoY
- 3.8%
- Active inventory
- 103
- Price-to-rent
- 7.7×
Monthly cashflow live
- Estimated rent
- $1,521 medium interval (Pro) →
- Mortgage (P&I)
- −$734
- Tax from tax record
- −$330 /mo · $3,957/yr
- Insurance
- −$58
- HOA
- −$0
- Vacancy / Maint / Mgmt
- −$319
- Net cashflow
- $79
Break-even live
Sensitivity live
| Price | -10% $158 | -5% $119 | +0% $79 | +5% $39 | +10% $0 |
|---|---|---|---|---|---|
| Rent | -10% $-41 | -5% $19 | +0% $79 | +5% $139 | +10% $199 |
| Rate | -1.0pp $150 | -0.5pp $115 | base $79 | +0.5pp $43 | +1.0pp $6 |
UW: 25.0% down · 7.5% · 30yr · 1.5% tax · 5.0% vac · 8.0% maint · 8.0% mgmt
Financing live
Cash to close
- Down payment
- $35,000
- Closing costs
- $4,200
- Reserves months
- —
- Total cash needed
- —
Loan-product check · same deal, 3 products live
Conventional
25% down · 7.5% · 30yr
- Down + closing
- —
- Monthly P&I
- —
- Monthly cashflow
- —
- DSCR
- —
- Eligible?
- —
Personal DTI + credit; lowest rate.
DSCR
20% down · 8.5% · 30yr
- Down + closing
- —
- Monthly P&I
- —
- Monthly cashflow
- —
- DSCR
- —
- Eligible?
- —
No personal income docs; deal must DSCR.
Hard money
10% down · 12.0% · 12mo
- Down + closing
- —
- Monthly P&I
- —
- Monthly cashflow
- —
- DSCR
- —
- Eligible?
- —
Short-term bridge; refi at stabilization.
Rent comps 2 comps
| Address | Beds | Baths | Sqft | Rent | $/sqft | DOM | Units | Dist |
|---|---|---|---|---|---|---|---|---|
| 18 Dorchester Dr Belleville, IL | 3.0 | 3.0 | 2112 | $1,650 | $0.78 | 2d | 1 | 0.90mi |
| 920 S 74th St Belleville, IL | 2.0 | 1.0 | 1300 | $1,400 | $1.08 | 13d | 1 | 1.12mi |
Listing history 25 events
-
2026-06-18days on market $140,000 Active 198 DOM
-
2026-06-17days on market $140,000 Active 197 DOM
-
2026-06-16days on market $140,000 Active 196 DOM
-
2026-06-15days on market $140,000 Active 195 DOM
-
2026-06-13days on market $140,000 Active 193 DOM
-
2026-06-09days on market $140,000 Active 189 DOM
-
2026-06-08days on market $140,000 Active 188 DOM
-
2026-06-07days on market $140,000 Active 187 DOM
-
2026-06-03days on market $140,000 Active 183 DOM
-
2026-06-02days on market $140,000 Active 182 DOM
-
2026-06-01days on market $140,000 Active 181 DOM
-
2026-05-31days on market $140,000 Active 180 DOM
-
2026-05-10price $140,000
-
2026-03-28price $150,000
-
2026-03-04price $159,900
-
2026-01-03price $169,900
-
2025-12-02$179,900 Active
-
2025-11-30historical $179,900
-
2025-09-17status Pending
-
2025-09-11$179,900 Active
-
2013-07-01soldstatus $102,500
-
2013-06-28soldstatus 680-char remark
Show marketing remark (680 chars)
What a find! You will be amazed at the amount of space here! The main floor boasts a large living room with built ins, wood floors and a fireplace, formal dining room, kitchen with cozy breakfast nook, 3 bedrooms and 2 full baths. The master has his and her closets, bedroom 2 offers built ins and plenty of space and bedroom 3 has lovely hardwood floors. Finished walk out lower level offers a large rec room with tile floors, a wet bar/kitchenette and a 4th bedroom and 3/4 bath. Lots of outdoor space to enjoy.....inviting covered front porch, covered side porch between house and garage and huge covered porch overlooking the fenced yard. Main floor laundry. Move in ready!
-
2012-09-14$104,900 680-char remark
Show marketing remark (680 chars)
What a find! You will be amazed at the amount of space here! The main floor boasts a large living room with built ins, wood floors and a fireplace, formal dining room, kitchen with cozy breakfast nook, 3 bedrooms and 2 full baths. The master has his and her closets, bedroom 2 offers built ins and plenty of space and bedroom 3 has lovely hardwood floors. Finished walk out lower level offers a large rec room with tile floors, a wet bar/kitchenette and a 4th bedroom and 3/4 bath. Lots of outdoor space to enjoy.....inviting covered front porch, covered side porch between house and garage and huge covered porch overlooking the fenced yard. Main floor laundry. Move in ready!
-
1992-07-24soldstatus $75,000
-
1992-07-24soldstatus $75,000
ⓘ Source: listings_history table (triggers on properties + properties_extension) + one-shot
backfill from property_details.listing_events for pre-trigger history.
Tax reassessment forecast IL · Partial reset (capped growth)
- Current annual tax
- $3,957 · $330/mo
- Projected year-2 tax
- $3,957 · $330/mo
- Expected delta
- $0/yr ($0/mo · 0.0%)
ⓘ Screening estimate from a state-policy table — verify with the county assessor before closing.
Climate risk First Street
- Flood 1/10 Low FEMA zone X · 0% chance over 30 yrs
- Wildfire 1/10 Low
- Heat 5/10 Major 7 d/yr ≥107°F today · 21 d/yr by 30 yrs out
- Wind 2/10 Low 100% chance of damaging wind over 30 yrs
- Air quality 3/10 Moderate 2 unhealthy d/yr today · 4 by 30 yrs out
Nearby sold comps map
Loading sold comps map…
Walkable amenities ~0.75 mi
Loading nearby amenities…
Taxation est. · year 1
- Rental income
- $18,248
- − Mortgage interest
- −$7,842
- − Property taxes
- −$3,957
- − Insurance
- −$700
- − Repairs & maintenance
- −$1,460
- − Management
- −$1,460
- − Depreciation
- −$4,073
- Taxable loss
- −$1,244
- Est. tax savings @ 24.0%
- +$298
- After-tax cash flow
- $1,247/yr
For passive investors: Depreciation is non-cash, so a rental often shows a tax loss while cash-flowing — sheltering income. Rental losses are passive: they offset passive income freely, and up to $25,000/yr can offset ordinary (W-2) income if you actively participate and your MAGI is under $100k (phasing out to $0 by $150k); unused losses carry forward. On sale, claimed depreciation is recaptured at up to 25%, and gains may owe capital-gains tax (a 1031 exchange can defer both). Figures are a year-1 estimate at your 24.0% rate — not tax advice; consult a CPA.
Schools (NCES district)
- District
- Belleville Twp Hsd 201
- NCES district ID
- 1705640
- Math proficiency
- 21% ▼ -8.00%
- Reading proficiency
- 28% ▼ -3.00%
- Median HH income
- $58,064
- Composite
- 22.39/100
- National rank
- #8115
- State rank
- #308 of 620 in IL
Livability — Belleville
- Score
- 78/100
- State rank
- #142
- US rank
- #2604
Category grades
Schools grade is shown separately in the Schools card above.
Census & demographics
- Census place
- Belleville, IL
- County
- Saint Clair County · 169,691 people
- City population
- 47,407
- Metro
- St. Louis, MO-IL
- Population (ZIP)
- 16,269
- Household income
- $73,700
- Rent vs Own
- Severe rent burden
- 656.0
Population outlook (St. Clair County) Hauer SSP2
- Today (2025)
- 250,366 people
- By 2030
- 240,511 · -3.9%
- By 2040
- 217,391 · -13.2%
- By 2050
- 192,699 · -23.0%
- By 2075
- 140,637 · -43.8%
- By 2100
- 100,499 · -59.9%
Race, ethnicity, and origin ACS 2023
- Neighborhood character
- Majority White (62%)
- Race & ethnicity
- White 62% Black 27% Two or more races 9% Hispanic / Latino 4%
- Common ancestry
- Romanian 3% Lithuanian 3% Slovak 2%
- Foreign-born
- 2% · Canada, Guatemala
- Languages at home
- 96% English-only · Spanish 2%
Political lean MEDSL · St. Clair
- 2024 margin
- Lean D (+7.9) · D 53.0% · R 45.1% · Other 1.8%
- 2008→2024 swing
- -14.6pp toward R · 2008: 22.4pp · 2024: 7.9pp
- All cycles
- 2024: D+7.9 2020: D+8.7 2016: D+5.6 2012: D+14.5 2008: D+22.4
Not yet ingested
- Civics
- —
Market trends
- HPI YoY
- ▲ 9.50%
- Current HPI
- 259.15
- Rent YoY
- —
- Metro
- St. Louis, MO-IL
- State GDP YoY
- ▲ 1.59%
- F500 in state
- 60
Industry mix (Fortune 500 HQ in IL)
| Industry | F500 HQs | Revenue |
|---|---|---|
| Insurance | 4 | $201B |
|
||
| Consumer Goods | 4 | $87B |
|
||
| Industrial Machinery | 3 | $64B |
|
||
| Healthcare | 2 | $55B |
|
||
| Retail / Pharmacy | 1 | $148B |
|
||
| Agriculture / Food | 1 | $86B |
|
||
Price history
+86.7% since first listed13 events — show timeline
- 2026-05-10 Price Changed $140,000 MARIS as Distributed by MLS Grid
- 2026-03-28 Price Changed $150,000 MARIS as Distributed by MLS Grid
- 2026-03-04 Price Changed $159,900 MARIS as Distributed by MLS Grid
- 2026-01-03 Price Changed $169,900 MARIS as Distributed by MLS Grid
- 2025-12-02 Listed $179,900 MARIS as Distributed by MLS Grid
- 2025-11-30 Coming Soon $179,900 MARIS as Distributed by MLS Grid
- 2025-09-17 Pending — MARIS as Distributed by MLS Grid
- 2025-09-11 Listed $179,900 MARIS as Distributed by MLS Grid
- 2013-07-01 Sold (Public Records) $102,500 Public Records
- 2013-06-28 Sold (MLS) — MARIS as Distributed by MLS Grid
- 2012-09-14 Listed $104,900 MARIS as Distributed by MLS Grid
- 1992-07-24 Sold (Public Records) $75,000 Public Records
- 1992-07-24 Sold (Public Records) $75,000 Public Records
Property tax history
+3.8%/yrLatest (2023): $3,957 · +11.3% YoY. Source: county tax records.
Cash-flow waterfall
monthlySold comps — $/sqft
last 12 mo · ≤1 miLoading sold comps…