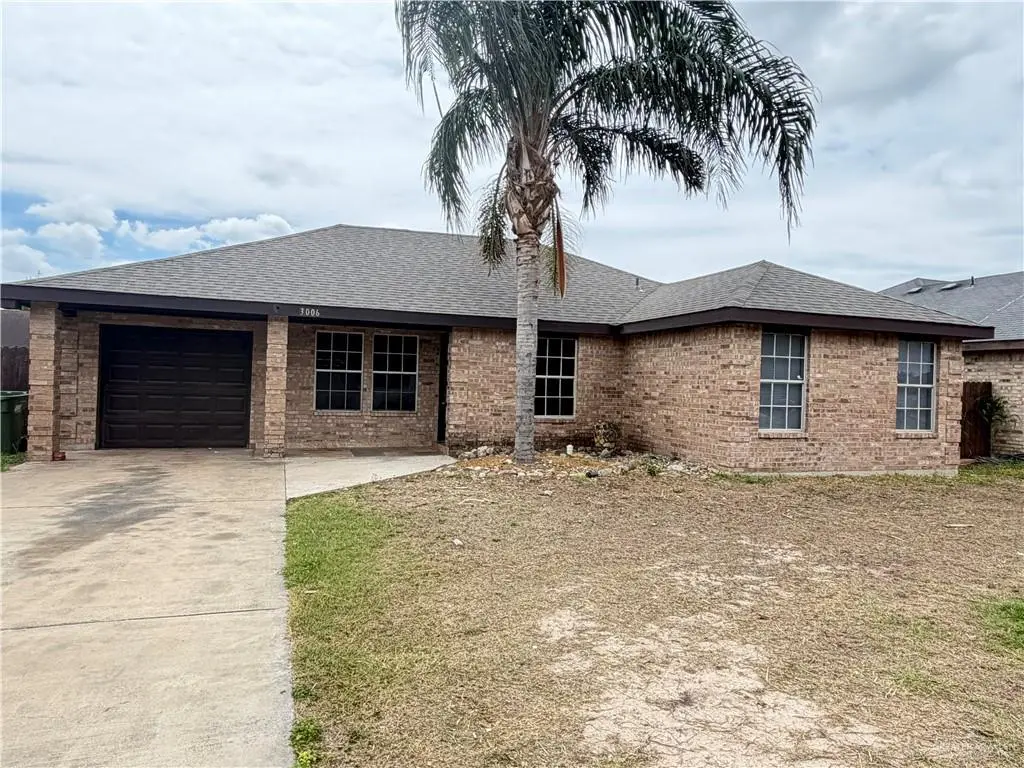
3006 Nogal St · Hidalgo, TX
Flood risk 1/10 · Minimal
- FEMA flood zone
- X (shaded)
- Chance of flooding over 30 yrs
- 0.0%
- Est. flood insurance / yr
- $507 – $1,088
Fire risk 3/10 · Minor
- Est. fire insurance / yr
- $1,222 – $2,270
Heat risk 9/10 · Severe
- Hot days now (above 111°F)
- 7 days/yr
- Hot days in 30 yrs
- 21 days/yr
Wind risk 8/10 · Major
- Chance of severe wind over 30 yrs
- 96.0%
Air-quality risk 1/10 · Minimal
- Unhealthy air days now
- 0 days/yr
- Unhealthy air days in 30 yrs
- 0 days/yr
Risk factors via First Street. Map © Google.
Why this score? — see what drove the B- grade
The composite is a weighted blend of 9 inputs, each scored 0–100. Each bar is that input's sub-score; the figure is the points it added to the 100-point composite (weight × sub-score).
- Cash flow +20.9/30.0
- ARV discount +11.1/15.0
- Appreciation +10.0/10.0
- DSCR +6.7/10.0
- 1% rule +6.0/10.0
- Livability +3.4/5.0
- Rent growth +2.5/5.0
- Schools +2.5/10.0
- Condition / age +2.5/5.0
$177,000
🖨 Deal sheet 📄 Offer letter ✓ Due diligence
Listing remarks
Perfect starter home, ready to move in. Home has a brand new roof and AC has been replaced. Featuring 4 bedrooms and 2 full bathrooms with ample backyard space. Valley view school district, and close to the international bridge.
Key facts
- 6,242 sq ft lot
- Garage
- Built 2001
Property features AI
Finance
- Other: Spa on property (heated)
- HOA & community: No homeowners association; Community features include sidewalks and other community amenities
Exterior
- Parking: Attached garage (1 garage space); Covered parking (2 spaces); Carport (1 space); Total of 2 parking spaces
- Security: Smoke detectors
- Utilities: Public water; City sewer; Paved road access
- Home design: Brick construction; Composition shingle roof; Slab foundation
- Construction: Brick exterior; Slab foundation; Composition shingle roof
- Exterior features: Chain link and wood fencing; Covered patio and patio slab; Patio
Interior
- Kitchen: Electric water heater; No conveying appliances
- Bedrooms: Primary bedroom with walk-in closet
- Flooring: Laminate flooring; Vinyl flooring
- Bathrooms: 2 full bathrooms
- Heating & cooling: Central heating; Central air conditioning
- Interior features: Granite countertops; Ceiling fans; Walk-in closets; Mini blinds and wood/faux blinds
- Laundry & utility: Laundry area located in the garage
Neighborhood map
What this means for you Summary
Snapshot
- This is a 3-bed/2.0-bath single-family listed at $177k.
Deal economics
- At list price, monthly cash flow is $246 ($3k/yr) — positive.
- The deal already cash-flows at list — no discount required.
- Meets the 1% rule at list price ($2k rent vs $177k).
- Recommended offer: $172k (3.0% below list) — sets the bar for market timing.
- Cap rate 8.0% vs local median 4.2% in Hidalgo — top-decile yield for the area; either an underpriced asset or a hidden risk that comps aren't pricing in. Stress-test before assuming the spread holds.
Location & tenants
- Location reads 68/100 on livability (#488 in TX) — a middle-class / working-renter tenant base. Strengths: cost of living A+, housing A+, crime A-; Watch: amenities F, commute F, employment F.
- Valley View ISD (suburban): math 24% / reading 38% proficiency, ranked #631 of 826 in TX (top 76%) — families likely to look elsewhere, expect single-tenant / working-renter base with shorter leases; 85% free/reduced lunch — lower-income household profile, screen leases tightly.
- Zoned schools: Wilbur E Lucas El (math 32% / reading 37%, grade F, #1,995 of 4,322 statewide, top 50%, 468 students, 94% FRL); Valley View J H (math 23% / reading 35%, grade F, #1,103 of 1,662 statewide, top 67%, 483 students, 95% FRL); Valley View H S (math 12% / reading 47%, grade F, #1,112 of 1,632 statewide, top 70%, 1,170 students, 96% FRL).
- Market conditions: 98 active listings in the ZIP; 1 comparable units currently listed for rent nearby; 7,378 units permitted in Hidalgo County in 2024 (641 in 5+ unit buildings).
Forward outlook
- In year one you build about $19k of equity ($1k loan paydown + $18k appreciation (10.0% local appreciation)).
- Hidalgo County population projected at +28% by 2050 — long-run rental-demand tailwind backs the buy-and-hold thesis.
- At projected returns (10.0% appreciation + 3.0% rent growth), your $50k cash investment doubles in ~3 years — after that, you're playing with house money.
- By year 2, paydown + projected appreciation supports a ~$30k cash-out refi (75% LTV) — recoverable capital for the next deal without selling this one.
Negotiation context
- It's been on market 52 days — a 3% lower offer ($172k) is reasonable based on typical stale-listing flexibility.
Risks & watch-outs
- Climate carrying-cost: severe wind risk, 96% chance of damaging wind over 30y; extreme-heat days projected 7→21/yr by 2055 (HVAC capex compounding) — expect insurance premiums to compound above CPI over the hold.
Questions for the listing agent
- It's been on market 52 days. Have you received any prior offers? Is the seller open to a 3% concession, seller financing, or rate buy-down credit?
- Is there a deadline driving the sale (1031 exchange, divorce, estate, relocation)? That informs how much negotiation room exists.
- Schools are D-rated, which usually means shorter tenancies and higher turnover. Who's the typical renter profile here, and what's been the actual vacancy rate?
- What's the average days-on-market for RENTAL listings here right now (not sales)? A rising rental-DOM trend means longer vacancies and softer asking-rent achievability than the comps imply.
- What's the recent tenant-quality profile in this submarket — average credit score on applications, eviction rate, late-payment / NSF rate, and stable-employment percentage? A property-management company in the area should have these aggregated.
- How much new for-sale + rental construction is in the pipeline within 1–3 miles? Heavy new supply typically softens prices + rents 12–24 months out; constrained supply supports both.
Investment metrics
- 1% rule
- 1.10% ✓
- Cap rate
- 7.96%
- Cash-on-cash
- 5.96%
- DSCR
- 1.27
- GRM
- 7.6
CMA / ARV
- ARV (on-the-fly)
- $192,503
- Comps found
- 12
Show comp detail 12 sales within ~0.75 mi
| Address | Dist | Beds/Ba | Sqft | Sold | Price | $/sf | Match |
|---|---|---|---|---|---|---|---|
| 3009 Laurel St | 0.07mi | 3/2.0 | 1,250 (+6%) | 6mo | $234,000 | $187 | 82 |
| 2616 Palo Blanco St | 0.25mi | 3/2.0 | 1,227 (+4%) | 19mo | $205,000 | $167 | 66 |
| 2900 E Palo Blanco St | 0.16mi | 3/2.5 | 1,348 (+14%) | 6mo | $232,900 | $173 | 62 |
| 707 Golfo St | 0.57mi | 3/1.0 | 1,178 (-0%) | 19mo | $140,000 | $119 | 53 |
| 2908 Monterrey St | 0.60mi | 3/2.0 | 1,263 (+7%) | 11mo | $155,000 | $123 | 51 |
| 1502 Las Palmas Ave | 0.65mi | 3/2.0 | 1,277 (+8%) | 11mo | $237,000 | $186 | 47 |
| 2406 Victoria St | 0.60mi | 3/1.5 | 1,275 (+8%) | 12mo | $208,000 | $163 | 47 |
| 2305 Monterrey St | 0.69mi | 3/2.0 | 1,231 (+4%) | 19mo | $172,000 | $140 | 45 |
| 2500 Victoria St | 0.59mi | 3/2.0 | 1,099 (-7%) | 20mo | $175,000 | $159 | 45 |
| 2513 Q St | 0.42mi | 3/2.0 | 1,347 (+14%) | 15mo | $215,000 | $160 | 44 |
| 2209 N 26th St | 0.58mi | 3/2.0 | 1,355 (+15%) | 18mo | $250,000 | $185 | 33 |
| 309 Sabinas St | 0.63mi | 3/2.0 | 1,344 (+14%) | 18mo | $175,000 | $130 | 32 |
Match score weights: distance 35% · size 25% · config 20% · recency 20%. Top-matched comps best support the ARV.
Projected returns pro-forma
10.0% appreciation · 3.0% rent growth · sell at horizon
- IRR
- 28.6%
- Equity multiple
- 3.26×
- Total profit
- $112,162
- Equity at exit
- $159,456
- IRR
- 24.9%
- Equity multiple
- 7.42×
- Total profit
- $318,104
- Equity at exit
- $343,872
Cash invested: $49,560 (down + closing). Projections, not guarantees.
Landlord ↔ Tenant lean methodology
- Overall (STATE)
- 87 Strongly Landlord-Friendly
- State Texas
- 87 Strongly Landlord-Friendly · R+5
- County
- — inherits STATE
- City
- — inherits STATE
ZIP-level market 78557
- Home prices YoY
- 17.9%
- Active inventory
- 98
- Price-to-rent
- 7.6×
Monthly cashflow live
- Estimated rent
- $1,950 medium interval (Pro) →
- Mortgage (P&I)
- −$928
- Tax from tax record
- −$292 /mo · $3,506/yr
- Insurance
- −$74
- HOA
- −$0
- Vacancy / Maint / Mgmt
- −$410
- Net cashflow
- $246
Break-even live
UW: 25.0% down · 7.5% · 30yr · 1.5% tax · 5.0% vac · 8.0% maint · 8.0% mgmt
Financing live
Cash to close
- Down payment
- $44,250
- Closing costs
- $5,310
- Reserves months
- —
- Total cash needed
- —
Loan-product check · same deal, 3 products live
Conventional
25% down · 7.5% · 30yr
- Down + closing
- —
- Monthly P&I
- —
- Monthly cashflow
- —
- DSCR
- —
- Eligible?
- —
Personal DTI + credit; lowest rate.
DSCR
20% down · 8.5% · 30yr
- Down + closing
- —
- Monthly P&I
- —
- Monthly cashflow
- —
- DSCR
- —
- Eligible?
- —
No personal income docs; deal must DSCR.
Hard money
10% down · 12.0% · 12mo
- Down + closing
- —
- Monthly P&I
- —
- Monthly cashflow
- —
- DSCR
- —
- Eligible?
- —
Short-term bridge; refi at stabilization.
Rent comps 1 comps
| Address | Beds | Baths | Sqft | Rent | $/sqft | DOM | Units | Dist |
|---|---|---|---|---|---|---|---|---|
| 2304 E Tamarindo Ave Hidalgo, TX | 3.0 | 2.0 | 1442 | $1,950 | $1.35 | 23d | 1 | 0.71mi |
Listing history 19 events
-
2026-06-19days on market $177,000 Active 52 DOM
-
2026-06-18days on market $177,000 Active 51 DOM
-
2026-06-17days on market $177,000 Active 50 DOM
-
2026-06-16days on market $177,000 Active 49 DOM
-
2026-06-15days on market $177,000 Active 48 DOM
-
2026-06-14days on market $177,000 Active 46 DOM
-
2026-06-12days on market $177,000 Active 45 DOM
-
2026-06-09days on market $177,000 Active 42 DOM
-
2026-06-08days on market $177,000 Active 41 DOM
-
2026-06-07pricedays on market $177,000 Active 40 DOM
-
2026-06-05days on market $184,000 Active 37 DOM
-
2026-06-03days on market $184,000 Active 36 DOM
-
2026-06-02days on market $184,000 Active 35 DOM
-
2026-06-01days on market $184,000 Active 34 DOM
-
2026-05-31days on market $184,000 Active 33 DOM
-
2026-05-30days on market $184,000 Active 32 DOM
-
2026-04-28$184,000 Active
-
2025-08-13soldstatus
-
2025-07-16soldstatus
ⓘ Source: listings_history table (triggers on properties + properties_extension) + one-shot
backfill from property_details.listing_events for pre-trigger history.
Tax reassessment forecast TX · Resets to sale price
- Current annual tax
- $3,506 · $292/mo
- Projected year-2 tax
- $3,506 · $292/mo
- Expected delta
- $0/yr ($0/mo · 0.0%)
ⓘ Screening estimate from a state-policy table — verify with the county assessor before closing.
Climate risk First Street
- Flood 1/10 Low FEMA zone X (shaded) · 0% chance over 30 yrs
- Wildfire 3/10 Moderate
- Heat 9/10 Extreme 7 d/yr ≥111°F today · 21 d/yr by 30 yrs out
- Wind 8/10 Severe 96% chance of damaging wind over 30 yrs
- Air quality 1/10 Low 0 unhealthy d/yr today · 0 by 30 yrs out
Nearby sold comps map
Loading sold comps map…
Walkable amenities ~0.75 mi
Loading nearby amenities…
Taxation est. · year 1
- Rental income
- $23,400
- − Mortgage interest
- −$9,915
- − Property taxes
- −$3,506
- − Insurance
- −$885
- − Repairs & maintenance
- −$1,872
- − Management
- −$1,872
- − Depreciation
- −$5,149
- Taxable income
- $201
- Est. tax owed @ 24.0%
- −$48
- After-tax cash flow
- $2,908/yr
For passive investors: Depreciation is non-cash, so a rental often shows a tax loss while cash-flowing — sheltering income. Rental losses are passive: they offset passive income freely, and up to $25,000/yr can offset ordinary (W-2) income if you actively participate and your MAGI is under $100k (phasing out to $0 by $150k); unused losses carry forward. On sale, claimed depreciation is recaptured at up to 25%, and gains may owe capital-gains tax (a 1031 exchange can defer both). Figures are a year-1 estimate at your 24.0% rate — not tax advice; consult a CPA.
Schools (NCES district)
- District
- Valley View ISD
- NCES district ID
- 4843800
- Math proficiency
- 24% ▼ -42.00%
- Reading proficiency
- 38% ▼ -16.00%
- Median HH income
- $33,158
- Composite
- 25.37/100
- National rank
- #7473
- State rank
- #631 of 826 in TX
Livability — Hidalgo
- Score
- 68/100
- State rank
- #488
- US rank
- #9681
Category grades
Schools grade is shown separately in the Schools card above.
Census & demographics
- Census place
- Hidalgo, TX
- City population
- 14,250
- Population (ZIP)
- 14,250
Population outlook (Hidalgo County) Hauer SSP2
- Today (2025)
- 955,232 people
- By 2030
- 1,009,774 · +5.7%
- By 2040
- 1,120,332 · +17.3%
- By 2050
- 1,225,036 · +28.2%
- By 2075
- 1,439,189 · +50.7%
- By 2100
- 1,533,429 · +60.5%
Race, ethnicity, and origin ACS 2023
- Neighborhood character
- Predominantly Hispanic (99%)
- Race & ethnicity
- Hispanic / Latino 99% Two or more races 47%
- Hispanic origin (detail)
- Mexican 93%
- Foreign-born
- 39% · Canada
- Languages at home
- 6% English-only · Spanish 94%
Political lean MEDSL · Hidalgo
- 2024 margin
- Toss-up / Even · D 48.1% · R 51.0%
- 2008→2024 swing
- -41.6pp toward R · 2008: 38.7pp · 2024: -2.9pp
- All cycles
- 2024: R+2.9 2020: D+17.1 2016: D+40.5 2012: D+41.8 2008: D+38.7
Not yet ingested
- Civics
- —
Market trends
- HPI YoY
- ▲ 34.26%
- Current HPI
- 225.701
- Rent YoY
- —
- Metro
- —
- State GDP YoY
- ▲ 3.95%
- F500 in state
- 110
Industry mix (Fortune 500 HQ in TX)
| Industry | F500 HQs | Revenue |
|---|---|---|
| Energy | 16 | $1,198B |
|
||
| Technology | 5 | $198B |
|
||
| Engineering / Construction | 4 | $72B |
|
||
| Energy Services | 3 | $60B |
|
||
| Utilities | 3 | $41B |
|
||
| Healthcare | 2 | $330B |
|
||
Price history
3 events — show timeline
- 2026-04-28 Listed $184,000 MCALLENMLS
- 2025-08-13 Sold (Public Records) — Public Records
- 2025-07-16 Sold (Public Records) — Public Records
Property tax history
+4.5%/yrLatest (2025): $3,506 · -3.0% YoY. Source: county tax records.
Cash-flow waterfall
monthlySold comps — $/sqft
last 12 mo · ≤1 miLoading sold comps…