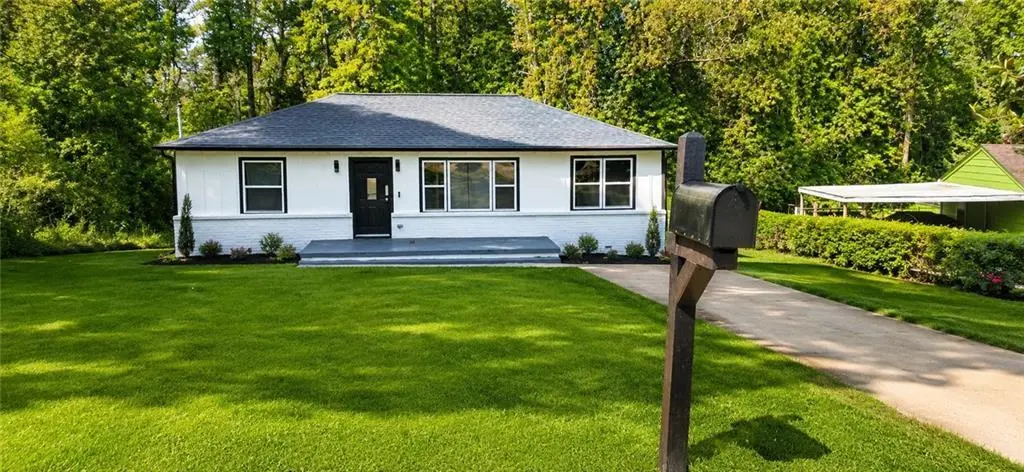
2554 Gordon Cir · Smyrna, GA
Flood risk 1/10 · Minimal
- FEMA flood zone
- X (unshaded)
- Chance of flooding over 30 yrs
- 0.0%
- Est. flood insurance / yr
- $507 – $1,088
Fire risk 1/10 · Minimal
- Est. fire insurance / yr
- $963 – $1,789
Heat risk 5/10 · Moderate
- Hot days now (above 103°F)
- 7 days/yr
- Hot days in 30 yrs
- 18 days/yr
Wind risk 5/10 · Moderate
- Chance of severe wind over 30 yrs
- 22.0%
Air-quality risk 4/10 · Minor
- Unhealthy air days now
- 6 days/yr
- Unhealthy air days in 30 yrs
- 7 days/yr
Risk factors via First Street. Map © Google.
Why this score? — see what drove the D+ grade
The composite is a weighted blend of 9 inputs, each scored 0–100. Each bar is that input's sub-score; the figure is the points it added to the 100-point composite (weight × sub-score).
- ARV discount +15.0/15.0
- Cash flow +13.3/30.0
- DSCR +4.0/10.0
- Schools +3.8/10.0
- Livability +3.8/5.0
- 1% rule +3.5/10.0
- Rent growth +2.9/5.0
- Condition / age +2.5/5.0
- Appreciation +0.0/10.0
$244,900
🖨 Deal sheet (PDF) 📄 Offer letter ✓ Due diligence
Listing remarks MLS
Opportunity awaits with this renovated bungalow located in the established Rose Garden Hills community. Being sold as-is, this property features numerous updates, including newer flooring, updated countertops, appliances, renovated bathrooms, and improvements to major systems, including electrical, plumbing, and roof replacement. Conveniently located less than three miles from Truist Park, The Battery Atlanta, and Dobbins Air Reserve Base, this property offers easy access to shopping, dining, entertainment, parks, trails, and major highways. Property is being sold as-is with no seller disclosures. Buyers are encouraged to conduct all due diligence and inspections prior to submitting an offer. Buyer name on contract must match the party closing. Please call 404.732.3538 for code entry. Schedule your showing today.
Key facts
- 6,716 sq ft lot
- 2 parking spots
- Built 1953
Property features AI
Exterior
- Parking: Driveway parking; 2 total parking spaces; Open parking available
- Utilities: Public water; Public sewer; Electric service with 220 volts; Electricity and natural gas available
- Home design: Single-story home
- Construction: Brick and HardiPlank exterior; Shingle roof; Block and brick/mortar foundation; Property listed as fixer
- Exterior features: Deck
Interior
- Kitchen: Eat-in kitchen; Dishwasher; Refrigerator
- Bedrooms: Master suite on the main level; 3 bedrooms on the main level
- Flooring: Luxury vinyl flooring
- Bathrooms: 2 full bathrooms; Master bath with double vanity and shower (no tub)
- Heating & cooling: Central heating; Central air conditioning
- Interior features: 9-ft ceilings on main level; Double-pane windows; No common walls
- Laundry & utility: Dedicated laundry room
Neighborhood map
What this means for you Summary
Snapshot
- This is a 2-bed/1.5-bath single-family listed at $245k.
Deal economics
- At list price, monthly cash flow is $2 ($24/yr) — positive.
- The deal already cash-flows at list — no discount required.
- To meet the 1% rule (rent ≥ 1% of price), the offer needs to be $209k (14.8% below list).
- Recommended offer: $209k (14.8% below list) — sets the bar for 1% rule.
- Cap rate 6.3% vs local median 3.5% in Smyrna — top-decile yield for the area; either an underpriced asset or a hidden risk that comps aren't pricing in. Stress-test before assuming the spread holds.
Location & tenants
- Location reads 76/100 on livability (#27 in GA, #3,621 nationally) — a middle-class / working-renter tenant base. Strengths: housing A+, employment A, commute A-; Watch: cost of living C-, amenities F.
- Cobb County (suburban): math 39% / reading 45% proficiency, ranked #25 of 174 in GA (top 14%) — families likely to look elsewhere, expect single-tenant / working-renter base with shorter leases.
- Zoned schools: Smyrna Elementary School (math 25% / reading 31%, grade F, #673 of 1,228 statewide, top 55%, 904 students, 54% FRL); Campbell Middle School (math 20% / reading 30%, grade F, #291 of 470 statewide, top 64%, 1,222 students, 55% FRL); Campbell High School (math 20% / reading 16%, grade F, #258 of 424 statewide, top 62%, 2,928 students, 48% FRL).
- Zoned-school proficiency averages 24% at this address vs 42% district-wide (-18 pts) — the specific schools serving this property underperform the Cobb County average; the district grade overstates school quality for this exact location.
- Market conditions: Rents rising (+1.4%/yr); 409 active listings in the ZIP; 40 comparable units currently listed for rent nearby; rentals at typical pace (median 21d on market — plan ~3-4 weeks tenant-placement turnaround); solid renter incomes; 1,625 units permitted in Cobb County in 2024 (389 in 5+ unit buildings).
Forward outlook
- Local home prices are declining (-3.0%/yr); year-one equity from $2k of loan paydown is wiped out by about $7k of value loss. Plan a longer hold.
- Cobb County population projected at +33% by 2050 — long-run rental-demand tailwind backs the buy-and-hold thesis.
Negotiation context
- It's been on market 17 days — a 2% lower offer ($241k) is reasonable based on typical stale-listing flexibility.
- 6 sale attempts since 3y ago with the ask held roughly flat each time — persistent listings suggest the price (not the market) is what's stuck; bring a comps-based counter.
Risks & watch-outs
- Watch-outs: built in 1953 — expect roof / HVAC / electrical / plumbing capex.
- Climate carrying-cost: moderate wind risk, 22% chance of damaging wind over 30y; extreme-heat days projected 7→18/yr by 2055 (HVAC capex compounding) — expect insurance premiums to compound above CPI over the hold.
Questions for the listing agent
- Built in 1953 — when were the roof, HVAC, electrical panel, plumbing, and water heater last replaced?
- Is there a deadline driving the sale (1031 exchange, divorce, estate, relocation)? That informs how much negotiation room exists.
- The area grade is low — what's the realistic commute time and amenity access for the typical tenant pool here? Any planned neighborhood developments (good or bad) we should know about?
- What's the average days-on-market for RENTAL listings here right now (not sales)? A rising rental-DOM trend means longer vacancies and softer asking-rent achievability than the comps imply.
- What's the recent tenant-quality profile in this submarket — average credit score on applications, eviction rate, late-payment / NSF rate, and stable-employment percentage? A property-management company in the area should have these aggregated.
- How much new for-sale + rental construction is in the pipeline within 1–3 miles? Heavy new supply typically softens prices + rents 12–24 months out; constrained supply supports both.
Investment metrics
- 1% rule
- 0.85% ✗
- Cap rate
- 6.30%
- Cash-on-cash
- 0.03%
- DSCR
- 1.00
- GRM
- 9.8
CMA / ARV
- ARV (on-the-fly)
- $424,482
- Comps found
- 12
Show comp detail 12 sales within ~0.75 mi
| Address | Dist | Beds/Ba | Sqft | Sold | Price | $/sf | Match |
|---|---|---|---|---|---|---|---|
| 2614 Spring Dr | 0.52mi | 3/1.0 (+1) | 1,536 (-5%) | 0mo | $315,000 | $205 | 60 |
| 1979 Turpin Rd SE | 0.22mi | 3/2.0 (+1) | 1,432 (-11%) | 4mo | $377,000 | $263 | 60 |
| 2613 Davenport St SE | 0.29mi | 3/2.0 (+1) | 1,407 (-13%) | 2mo | $310,000 | $220 | 57 |
| 2465 Spring Dr SE | 0.57mi | 3/2.0 (+1) | 1,542 (-4%) | 4mo | $419,400 | $272 | 55 |
| 2016 Spring Rd SE | 0.49mi | 3/2.5 (+1) | 1,497 (-7%) | 7mo | $380,000 | $254 | 50 |
| 1693 Donna Lynn Dr | 0.56mi | 3/2.0 (+1) | 1,724 (+7%) | 8mo | $492,000 | $285 | 49 |
| 1719 Spring St SE | 0.58mi | 3/2.0 (+1) | 1,514 (-6%) | 8mo | $525,000 | $347 | 49 |
| 2299 Brenda Dr SE | 0.60mi | 3/1.5 (+1) | 1,535 (-5%) | 12mo | $370,000 | $241 | 49 |
| 2801 Priestcliff Dr | 0.61mi | 3/2.5 (+1) | 1,819 (+13%) | 5mo | $415,000 | $228 | 37 |
| 2640 Spring Dr SE | 0.53mi | 3/3.0 (+1) | 1,850 (+15%) | 4mo | $415,000 | $224 | 36 |
| 2350 Brenda Dr SE | 0.67mi | 3/2.0 (+1) | 1,377 (-15%) | 12mo | $390,000 | $283 | 27 |
| 1865 Lochlomand Ln SE | 0.75mi | 3/2.0 (+1) | 1,375 (-15%) | 14mo | $455,000 | $331 | 22 |
Match score weights: distance 35% · size 25% · config 20% · recency 20%. Top-matched comps best support the ARV.
Projected returns pro-forma
-3.0% appreciation · 1.44% rent growth · sell at horizon
- IRR
- -18.0%
- Equity multiple
- 0.38×
- Total profit
- $-42,779
- Equity at exit
- $36,515
- IRR
- -13.4%
- Equity multiple
- 0.27×
- Total profit
- $-49,896
- Equity at exit
- $21,174
Cash invested: $68,572 (down + closing). Projections, not guarantees.
Landlord ↔ Tenant lean methodology
- Overall (STATE)
- 90 Strongly Landlord-Friendly
- State Georgia
- 90 Strongly Landlord-Friendly · R+3
- County
- — inherits STATE
- City
- — inherits STATE
ZIP-level market 30080
- Rents YoY
- 1.4%
- Active inventory
- 409
- Price-to-rent
- 9.8×
Monthly cashflow live
- Estimated rent
- $2,085 high interval (Pro) →
- Mortgage (P&I)
- −$1,284
- Tax from tax record
- −$259 /mo · $3,109/yr
- Insurance
- −$102
- HOA
- −$0
- Vacancy / Maint / Mgmt
- −$438
- Net cashflow
- $2
Break-even live
Sensitivity live
| Price | -10% $141 | -5% $71 | +0% $2 | +5% $-67 | +10% $-137 |
|---|---|---|---|---|---|
| Rent | -10% $-163 | -5% $-80 | +0% $2 | +5% $84 | +10% $167 |
| Rate | -1.0pp $125 | -0.5pp $64 | base $2 | +0.5pp $-61 | +1.0pp $-126 |
UW: 25.0% down · 7.5% · 30yr · 1.5% tax · 5.0% vac · 8.0% maint · 8.0% mgmt
Financing live
Cash to close
- Down payment
- $61,225
- Closing costs
- $7,347
- Reserves months
- —
- Total cash needed
- —
Loan-product check · same deal, 3 products live
Conventional
25% down · 7.5% · 30yr
- Down + closing
- —
- Monthly P&I
- —
- Monthly cashflow
- —
- DSCR
- —
- Eligible?
- —
Personal DTI + credit; lowest rate.
DSCR
20% down · 8.5% · 30yr
- Down + closing
- —
- Monthly P&I
- —
- Monthly cashflow
- —
- DSCR
- —
- Eligible?
- —
No personal income docs; deal must DSCR.
Hard money
10% down · 12.0% · 12mo
- Down + closing
- —
- Monthly P&I
- —
- Monthly cashflow
- —
- DSCR
- —
- Eligible?
- —
Short-term bridge; refi at stabilization.
Rent comps 40 comps
| Address | Beds | Baths | Sqft | Rent | $/sqft | DOM | Units | Dist |
|---|---|---|---|---|---|---|---|---|
| 2181 Gordon Cir SE Smyrna, GA | 3.0 | 1.0 | 1250 | $2,100 | $1.68 | 45d | 1 | 0.13mi |
| 2596 Bates St SE Smyrna, GA | 3.0 | 2.0 | 1320 | $2,695 | $2.04 | 25d | 1 | 0.13mi |
| 1836 Roswell St SE Unit 12406 Smyrna, GA | 2.0 | 2.0 | 1354 | $1,861 | $1.37 | 0d | 1 | 0.17mi |
| 2200 Woodlands Dr SE Smyrna, GA | 1.0–2.0 | 1.0–2.0 | 890 | $2,009 | $2.26 | 0d | 60 | 0.23mi |
| 53 Doranne Ct SE #53 Smyrna, GA | 2.0 | 2.0 | 1250 | $1,750 | $1.40 | 21d | 1 | 0.34mi |
| 1858 Shenandoah Valley Ln SE Smyrna, GA | 2.0 | 2.5 | 1220 | $3,850 | $3.16 | 45d | 1 | 0.37mi |
| 1539 Springleaf Ct SE Unit 1539 Smyrna, GA | 2.0 | 2.5 | 1386 | $1,925 | $1.39 | 45d | 1 | 0.39mi |
| 1836 Cumberland Valley Pl SE Smyrna, GA | 2.0 | 1.5 | 1152 | $1,650 | $1.43 | 45d | 1 | 0.40mi |
| 1819 Cumberland Valley Pl SE Smyrna, GA | 2.0 | 2.5 | 1152 | $1,550 | $1.35 | 45d | 1 | 0.41mi |
| 1695 Wynndowne Trl SE Smyrna, GA | 2.0 | 2.5 | 1054 | $3,300 | $3.13 | 45d | 1 | 0.41mi |
| 1822 Cumberland Valley Pl SE Smyrna, GA | 2.0 | 1.5 | 1250 | $1,700 | $1.36 | 45d | 1 | 0.41mi |
| 27 Matawan Cir SE Smyrna, GA | 2.0 | 2.0 | 1404 | $1,995 | $1.42 | 18d | 1 | 0.41mi |
| 27 Matawan Cir SE Smyrna, GA | 2.0 | 2.0 | 1404 | $2,100 | $1.50 | 4d | 1 | 0.41mi |
| 1820 Cumberland Valley Pl SE Smyrna, GA | 2.0 | 2.5 | 1152 | $3,750 | $3.26 | 45d | 1 | 0.41mi |
| 1425 Springleaf Cir SE Smyrna, GA | 2.0 | 2.5 | 1120 | $1,690 | $1.51 | 6d | 1 | 0.42mi |
| 1424 Springleaf Cir SE Smyrna, GA | 2.0 | 2.5 | 1120 | $1,550 | $1.38 | 16d | 1 | 0.43mi |
| 1802 Cumberland Valley Pl SE Smyrna, GA | 3.0 | 3.5 | 1451 | $4,650 | $3.20 | 0d | 1 | 0.44mi |
| 1668 Wynndowne Trl SE Smyrna, GA | 2.0 | 2.5 | 1054 | $1,400 | $1.33 | 6d | 1 | 0.45mi |
| 1677 Wynndowne Trl SE Smyrna, GA | 2.0 | 2.5 | 1054 | $1,950 | $1.85 | 25d | 1 | 0.45mi |
| 1675 Wynndowne Trl SE Smyrna, GA | 2.0 | 2.0 | 1070 | $1,800 | $1.68 | 11d | 1 | 0.45mi |
| 2085 Lake Park Dr SE Smyrna, GA | 1.0–2.0 | 1.0–2.0 | 965 | $2,340 | $2.42 | 0d | 118 | 0.49mi |
| 2170 Beech Valley Dr SE Smyrna, GA | 3.0 | 2.0 | 1270 | $2,550 | $2.01 | 14d | 1 | 0.50mi |
| 2170 Beech Valley Dr SE Smyrna, GA | 3.0 | 2.0 | 1270 | $2,550 | $2.01 | 0d | 1 | 0.50mi |
| 2815 Priestcliff Dr SE Smyrna, GA | 3.0 | 2.5 | 2038 | $2,800 | $1.37 | 45d | 1 | 0.54mi |
| 44 Rumson Ct SE Smyrna, GA | 2.0 | 2.0 | 1282 | $1,800 | $1.40 | 19d | 1 | 0.55mi |
| 206 Spring Heights Ln #206 Smyrna, GA | 2.0 | 2.5 | 1510 | $2,250 | $1.49 | 14d | 1 | 0.57mi |
| 510 Spring Heights Ln Smyrna, GA | 2.0 | 2.0 | 1278 | $1,900 | $1.49 | 14d | 1 | 0.58mi |
| 2465 Spring Dr SE Smyrna, GA | 3.0 | 2.0 | 1600 | $3,500 | $2.19 | 45d | 1 | 0.60mi |
| 411 Spring Heights Ln SE #4 Smyrna, GA | 2.0 | 2.0 | 1187 | $2,000 | $1.68 | 6d | 1 | 0.60mi |
| 410 Spring Heights Ln #410 Smyrna, GA | 2.0 | 2.0 | 1278 | $2,250 | $1.76 | 45d | 1 | 0.60mi |
| 2919 Lexington Trace Dr SE Smyrna, GA | 2.0 | 2.5 | 1292 | $2,250 | $1.74 | 45d | 1 | 0.60mi |
| 510 Spring Heights Ln SE #5 Smyrna, GA | 2.0 | 2.0 | 1278 | $1,900 | $1.49 | 25d | 1 | 0.61mi |
| 2121 Windy Hill Rd Marietta, GA | 1.0–2.0 | 1.0–1.5 | 965 | $1,527 | $1.58 | 0d | 41 | 0.68mi |
| 2871 Spring Villa Ln #2871 Smyrna, GA | 3.0 | 3.0 | 1500 | $2,100 | $1.40 | 45d | 1 | 0.70mi |
| 1907 Countryside Pl SE Smyrna, GA | 2.0 | 1.0 | 1097 | $1,595 | $1.45 | 22d | 1 | 0.75mi |
| 2815 Carolyn Dr SE Smyrna, GA | 3.0 | 2.0 | 1429 | $2,500 | $1.75 | 45d | 1 | 0.75mi |
| 1973 Brightleaf Way #147 Marietta, GA | 3.0 | 2.0 | 2137 | $2,595 | $1.21 | 45d | 1 | 0.83mi |
| 2200 Goodwood Blvd SE Smyrna, GA | 2.0 | 2.0 | 1984 | $2,650 | $1.34 | 5d | 1 | 0.83mi |
| 2198 Goodwood Blvd SE Smyrna, GA | 3.0 | 2.5 | 1494 | $2,695 | $1.80 | 18d | 1 | 0.84mi |
| 2198 Goodwood Blvd SE Smyrna, GA | 3.0 | 2.5 | 1494 | $2,695 | $1.80 | 0d | 1 | 0.84mi |
Listing history 12 events
-
2026-06-21days on market $244,900 Active 17 DOM
-
2026-06-18days on market $244,900 Active 14 DOM
-
2026-06-17days on market $244,900 Active 13 DOM
-
2026-06-16days on market $244,900 Active 12 DOM
-
2026-06-15days on market $244,900 Active 11 DOM
-
2026-06-13days on market $244,900 Active 9 DOM
-
2026-06-13days on market $244,900 Active 8 DOM
-
2026-06-09days on market $244,900 Active 5 DOM
-
2026-06-08remarks 699-char remark
-
2026-06-08days on market $244,900 Active 4 DOM
-
2026-06-07days on market $244,900 Active 3 DOM
-
2026-06-04$244,900 Active 1 DOM
ⓘ Source: listings_history table (triggers on properties + properties_extension) + one-shot
backfill from property_details.listing_events for pre-trigger history.
Tax reassessment forecast GA · Resets to sale price
- Current annual tax
- $3,109 · $259/mo
- Projected year-2 tax
- $3,109 · $259/mo
- Expected delta
- $0/yr ($0/mo · 0.0%)
ⓘ Screening estimate from a state-policy table — verify with the county assessor before closing.
Climate risk First Street
- Flood 1/10 Low FEMA zone X (unshaded) · 0% chance over 30 yrs
- Wildfire 1/10 Low
- Heat 5/10 Major 7 d/yr ≥103°F today · 18 d/yr by 30 yrs out
- Wind 5/10 Major 22% chance of damaging wind over 30 yrs
- Air quality 4/10 Moderate 6 unhealthy d/yr today · 7 by 30 yrs out
Nearby sold comps map
Loading sold comps map…
Walkable amenities ~0.75 mi
Loading nearby amenities…
Taxation est. · year 1
- Rental income
- $25,024
- − Mortgage interest
- −$13,718
- − Property taxes
- −$3,109
- − Insurance
- −$1,224
- − Repairs & maintenance
- −$2,002
- − Management
- −$2,002
- − Depreciation
- −$7,124
- Taxable loss
- −$4,156
- Est. tax savings @ 24.0%
- +$997
- After-tax cash flow
- $1,021/yr
For passive investors: Depreciation is non-cash, so a rental often shows a tax loss while cash-flowing — sheltering income. Rental losses are passive: they offset passive income freely, and up to $25,000/yr can offset ordinary (W-2) income if you actively participate and your MAGI is under $100k (phasing out to $0 by $150k); unused losses carry forward. On sale, claimed depreciation is recaptured at up to 25%, and gains may owe capital-gains tax (a 1031 exchange can defer both). Figures are a year-1 estimate at your 24.0% rate — not tax advice; consult a CPA.
Schools (NCES district)
- District
- Cobb County
- NCES district ID
- 1301290
- Math proficiency
- 39% ▼ -15.00%
- Reading proficiency
- 45% ▼ -10.00%
- Median HH income
- $68,845
- Composite
- 37.93/100
- National rank
- #4308
- State rank
- #25 of 174 in GA
Livability — Smyrna
- Score
- 76/100
- State rank
- #27
- US rank
- #3621
Category grades
Schools grade is shown separately in the Schools card above.
Census & demographics
- Census place
- Smyrna, GA
- County
- Cobb County · 777,758 people
- City population
- 80,612
- Metro
- Atlanta-Sandy Springs-Alpharetta, GA
- Population (ZIP)
- 53,316
- Household income
- $91,957
- Rent vs Own
- Severe rent burden
- 3023.0
Population outlook (Cobb County) Hauer SSP2
- Today (2025)
- 868,385 people
- By 2030
- 929,614 · +7.1%
- By 2040
- 1,047,533 · +20.6%
- By 2050
- 1,155,537 · +33.1%
- By 2075
- 1,405,030 · +61.8%
- By 2100
- 1,555,058 · +79.1%
Race, ethnicity, and origin ACS 2023
- Neighborhood character
- Highly diverse neighborhood (Simpson 0.71)
- Race & ethnicity
- White 38% Black 33% Hispanic / Latino 14% Two or more races 9% Asian 8%
- Hispanic origin (detail)
- Mexican 7% Puerto Rican 2%
- Common ancestry
- Slovak 2% Italian 2% Lithuanian 1%
- Foreign-born
- 16% · Canada, China, Jamaica
- Languages at home
- 78% English-only · Spanish 12% Other Indo-European 4% Other Asian/Pacific 2%
Political lean MEDSL · Cobb
- 2024 margin
- D (+14.9) · D 56.9% · R 42.0% · Other 1.1%
- 2008→2024 swing
- +24.3pp toward D · 2008: -9.4pp · 2024: 14.9pp
- All cycles
- 2024: D+14.9 2020: D+14.3 2016: D+2.1 2012: R+12.6 2008: R+9.4
Not yet ingested
- Civics
- —
Market trends
- HPI YoY
- ▼ -311.51%
- Current HPI
- 249.7217
- Rent YoY
- ▲ 1.44%
- Metro
- Atlanta-Sandy Springs-Alpharetta, GA
- State GDP YoY
- ▲ 2.66%
- F500 in state
- 28
Industry mix (Fortune 500 HQ in GA)
| Industry | F500 HQs | Revenue |
|---|---|---|
| Paper / Packaging | 2 | $29B |
|
||
| Retail | 1 | $160B |
|
||
| Transportation / Logistics | 1 | $91B |
|
||
| Airlines | 1 | $62B |
|
||
| Consumer Goods | 1 | $47B |
|
||
| Utilities | 1 | $25B |
|
||
Price history
-23.5% since first listed18 events — show timeline
- 2026-06-04 Listed $244,900 FMLS
- 2026-06-04 Coming Soon $244,900 FMLS
- 2026-06-02 Listed $244,900 GAMLS
- 2025-06-20 Listing Removed — GAMLS
- 2025-06-20 Listing Removed — FMLS
- 2025-05-30 Price Changed $409,000 GAMLS
- 2025-05-30 Price Changed $409,000 FMLS
- 2025-04-24 Listed $419,900 GAMLS
- 2025-04-18 Listed $419,900 FMLS
- 2024-02-26 Sold (Public Records) $272,500 Public Records
- 2023-05-05 Sold (MLS) $255,000 GAMLS
- 2023-05-05 Sold (MLS) $255,000 FMLS
- 2023-03-22 Pending — FMLS
- 2023-03-20 Contingent — FMLS
- 2023-03-08 Pending — FMLS
- 2023-03-08 Pending — GAMLS
- 2023-02-22 Listed $320,000 GAMLS
- 2023-02-22 Listed $320,000 FMLS
Property tax history
+4.9%/yrLatest (2025): $3,109 · +0.0% YoY. Source: county tax records.
Cash-flow waterfall
monthlySold comps — $/sqft
last 12 mo · ≤1 miLoading sold comps…