4454 Tucker Sq · Beacon Square, FL
Flood risk 10/10 · Severe
- FEMA flood zone
- AE
- Chance of flooding over 30 yrs
- 0.99%
- Est. flood insurance / yr
- $1,737 – $8,500
Fire risk 3/10 · Minor
- Est. fire insurance / yr
- $947 – $1,759
Heat risk 10/10 · Severe
- Hot days now (above 109°F)
- 7 days/yr
- Hot days in 30 yrs
- 25 days/yr
Wind risk 10/10 · Severe
- Chance of severe wind over 30 yrs
- 99.0%
Air-quality risk 2/10 · Minimal
- Unhealthy air days now
- 1 days/yr
- Unhealthy air days in 30 yrs
- 1 days/yr
Risk factors via First Street. Map © Google.
Why this score? — see what drove the B+ grade
The composite is a weighted blend of 9 inputs, each scored 0–100. Each bar is that input's sub-score; the figure is the points it added to the 100-point composite (weight × sub-score).
- Cash flow +28.6/30.0
- ARV discount +15.0/15.0
- DSCR +10.0/10.0
- 1% rule +9.1/10.0
- Schools +4.3/10.0
- Livability +3.3/5.0
- Rent growth +2.7/5.0
- Condition / age +2.5/5.0
- Appreciation +0.0/10.0
$118,000
🖨 Deal sheet (PDF) 📄 Offer letter ✓ Due diligence
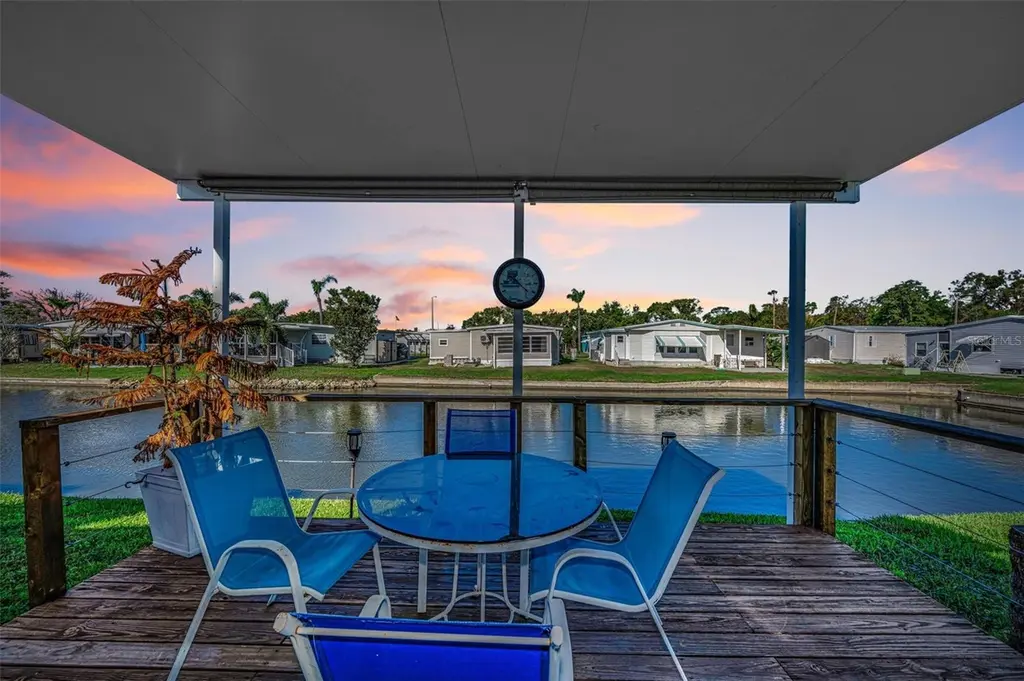
Listing remarks
Welcome to A Place in the Sun, a highly sought-after 55+ waterfront resident-owned community where you can enjoy the best of the Florida lifestyle with NO LOT RENT! You own the land share! This beautifully updated 2-bedroom, 2-bath Palm Harbor manufactured home offers breathtaking waterfront views, modern upgrades, and low-maintenance coastal living in a peaceful yet active community. Move-in ready and meticulously updated, this home features a bright open layout, stylish finishes, and energy-efficient mini-split heating and cooling systems to help keep utility costs low. Wake up to serene water views from the spacious primary bedroom, which opens into a sunny Florida room and flows seamle
Key facts
- Deeded land
- Front screened porch
- Clubhouse
Tags
Property features AI
Finance
- Other: Total annual fees $2,100; Furnished
- Financial info: Lease restrictions apply
- HOA & community: Has HOA (monthly fee $175); Association amenities include cable TV, clubhouse, pool, shuffleboard court, and lobby key requirements; Association fee includes cable TV, common area taxes, pool, internet, grounds maintenance, management, and trash; Buyer/association approval required; Senior community; Pets allowed with number and size limits; Deed restrictions; Golf carts allowed; Association recreation owned
Exterior
- Parking: Has carport (1 space)
- Security: Smoke detector(s)
- Utilities: Public water; Public sewer; Electricity connected; Water connected; Sewer connected; Cable connected; BB/HS internet available
- Home design: Manufactured home (double wide); Completed condition; One story; Faces east; Pillar/post/pier foundation
- Construction: Vinyl siding; Metal roof; Built by Palm Harbor Homes
- Exterior features: Covered patio/porch; Deck; Front porch; Screened porch; Awnings; Exterior lighting; Private mailbox; Rain gutters; Sidewalk; Sliding doors; Storage; Shed(s)
Interior
- Kitchen: Disposal; Exhaust fan; Ice maker; Microwave; Range; Refrigerator; Stone counters
- Bedrooms: 2 bedrooms
- Flooring: Carpet; Ceramic tile
- Bathrooms: 2 full bathrooms
- Heating & cooling: Heating: Other; Cooling: Mini-split unit(s)
- Interior features: Built-in features; High ceilings; Living room/dining room combo; Stone counters; Walk-in closet(s); Window treatments; Electric fireplace
- Laundry & utility: Washer; Dryer; Laundry closet; Inside laundry; Electric water heater; Water softener; Inside utility
Neighborhood map
What this means for you Summary
Snapshot
- This is a 2-bed/2.0-bath manufactured listed at $118k.
Deal economics
- At list price, monthly cash flow is $-38 ($-454/yr) — negative.
- To cash-flow at today's rent, offer at most $111k (5.7% below list).
- Meets the 1% rule at list price ($2k rent vs $118k).
- Recommended offer: $111k (6.0% below list) — sets the bar for market timing.
- Cap rate 10.2% vs local median 2.7% in Beacon Square — top-decile yield for the area; either an underpriced asset or a hidden risk that comps aren't pricing in. Stress-test before assuming the spread holds.
Location & tenants
- Location reads 66/100 on livability (#600 in FL) — a middle-class / working-renter tenant base. Strengths: cost of living A+, housing A+, health & safety B; Watch: employment D, amenities F, commute F.
- Pasco (suburban): math 50% / reading 52% proficiency, ranked #32 of 73 in FL (top 44%) — acceptable for families but not a draw, mixed tenant base, ~2y average lease.
- Zoned schools: Mittye P. Locke Elementary School (math 35% / reading 39%, grade F, #1,609 of 2,144 statewide, top 77%, 491 students, 89% FRL); Paul R. Smith Middle School (math 32% / reading 38%, grade F, #416 of 571 statewide, top 74%, 994 students, 82% FRL); Anclote High School (math 28% / reading 38%, grade F, #406 of 667 statewide, top 61%, 1,205 students, 77% FRL) — zoned schools average 83% FRL vs 48% district-wide (34 pts higher); higher-poverty schools than district average — tighter screening recommended.
- Zoned-school proficiency averages 35% at this address vs 51% district-wide (-16 pts) — the specific schools serving this property underperform the Pasco average; the district grade overstates school quality for this exact location.
- Market conditions: Rents flat; 644 active listings in the ZIP; 40 comparable units currently listed for rent nearby; rentals at typical pace (median 20d on market — plan ~3-4 weeks tenant-placement turnaround); 6,765 units permitted in Pasco County in 2024 (1,250 in 5+ unit buildings).
- This rent runs 35% of the median local income ($57k/yr) — at the standard rent-burdened threshold; future hikes will face affordability resistance.
Forward outlook
- Local home prices are declining (-3.0%/yr); year-one equity from $816 of loan paydown is wiped out by about $4k of value loss. Plan a longer hold.
- Pasco County population projected at +29% by 2050 — long-run rental-demand tailwind backs the buy-and-hold thesis.
Negotiation context
- It's been on market 86 days — a 6% lower offer ($111k) is reasonable based on typical stale-listing flexibility.
- 5 sale attempts since 20y ago with the ask held roughly flat each time — persistent listings suggest the price (not the market) is what's stuck; bring a comps-based counter.
Risks & watch-outs
- Watch-outs: flood insurance adds $427/mo.
- Climate carrying-cost: in FEMA flood zone AE (mandatory federal flood insurance); severe wind risk, 99% chance of damaging wind over 30y; extreme-heat days projected 7→25/yr by 2055 (HVAC capex compounding) — expect insurance premiums to compound above CPI over the hold.
Questions for the listing agent
- What do current leases actually rent for vs. the listed asking? Can we see a recent rent roll and the last 12 months of T-12 income?
- It's been on market 86 days. Have you received any prior offers? Is the seller open to a 6% concession, seller financing, or rate buy-down credit?
- What's the actual annual flood-insurance premium (NFIP or private), and is the property in a SFHA with mandatory coverage?
- What does the HOA fee cover, when was the last increase, and are there any pending special assessments or reserve-fund shortfalls?
- Why hasn't it sold? Are there any deal-killer items the seller is aware of (foundation, flood, title, zoning, code violations)?
- Is there a deadline driving the sale (1031 exchange, divorce, estate, relocation)? That informs how much negotiation room exists.
- Schools are F-rated, which usually means shorter tenancies and higher turnover. Who's the typical renter profile here, and what's been the actual vacancy rate?
- What's the average days-on-market for RENTAL listings here right now (not sales)? A rising rental-DOM trend means longer vacancies and softer asking-rent achievability than the comps imply.
- What's the recent tenant-quality profile in this submarket — average credit score on applications, eviction rate, late-payment / NSF rate, and stable-employment percentage? A property-management company in the area should have these aggregated.
- How much new for-sale + rental construction is in the pipeline within 1–3 miles? Heavy new supply typically softens prices + rents 12–24 months out; constrained supply supports both.
Investment metrics
- 1% rule
- 1.41% ✓
- Cap rate
- 10.25%
- Cash-on-cash
- 14.12%
- DSCR
- 1.63
- GRM
- 5.9
CMA / ARV
- ARV (on-the-fly)
- $164,304
- Comps found
- 1
Show comp detail 1 sale within ~0.75 mi
| Address | Dist | Beds/Ba | Sqft | Sold | Price | $/sf | Match |
|---|---|---|---|---|---|---|---|
| 4135 Pecan Dr | 0.68mi | 2/2.0 | 864 (-14%) | 13mo | $141,000 | $163 | 34 |
Match score weights: distance 35% · size 25% · config 20% · recency 20%. Top-matched comps best support the ARV.
Projected returns pro-forma
-3.0% appreciation · 0.72% rent growth · sell at horizon
- IRR
- -22.6%
- Equity multiple
- 0.25×
- Total profit
- $-24,900
- Equity at exit
- $17,594
- IRR
- -30.8%
- Equity multiple
- -0.15×
- Total profit
- $-37,940
- Equity at exit
- $10,202
Cash invested: $33,040 (down + closing). Projections, not guarantees.
Landlord ↔ Tenant lean methodology
- Overall (STATE)
- 87 Strongly Landlord-Friendly
- State Florida
- 87 Strongly Landlord-Friendly · R+3
- County
- — inherits STATE
- City
- — inherits STATE
ZIP-level market 34652
- Home prices YoY
- -26.1%
- Rents YoY
- 0.7%
- Active inventory
- 644
- Price-to-rent
- 5.9×
Monthly cashflow live
- Estimated rent
- $1,659 high interval (Pro) →
- Mortgage (P&I)
- −$619
- Tax from tax record
- −$79 /mo · $944/yr
- Insurance
- −$49
- Flood insurance flood zone
- −$427 /mo · $5,118/yr
- HOA
- −$175
- Vacancy / Maint / Mgmt
- −$348
- Net cashflow
- $-38
Break-even live
Sensitivity live
| Price | -10% $29 | -5% $-4 | +0% $-38 | +5% $-71 | +10% $-105 |
|---|---|---|---|---|---|
| Rent | -10% $-169 | -5% $-103 | +0% $-38 | +5% $28 | +10% $93 |
| Rate | -1.0pp $22 | -0.5pp $-8 | base $-38 | +0.5pp $-68 | +1.0pp $-100 |
UW: 25.0% down · 7.5% · 30yr · 1.5% tax · 5.0% vac · 8.0% maint · 8.0% mgmt
Financing live
Cash to close
- Down payment
- $29,500
- Closing costs
- $3,540
- Reserves months
- —
- Total cash needed
- —
Loan-product check · same deal, 3 products live
Conventional
25% down · 7.5% · 30yr
- Down + closing
- —
- Monthly P&I
- —
- Monthly cashflow
- —
- DSCR
- —
- Eligible?
- —
Personal DTI + credit; lowest rate.
DSCR
20% down · 8.5% · 30yr
- Down + closing
- —
- Monthly P&I
- —
- Monthly cashflow
- —
- DSCR
- —
- Eligible?
- —
No personal income docs; deal must DSCR.
Hard money
10% down · 12.0% · 12mo
- Down + closing
- —
- Monthly P&I
- —
- Monthly cashflow
- —
- DSCR
- —
- Eligible?
- —
Short-term bridge; refi at stabilization.
Rent comps 40 comps
| Address | Beds | Baths | Sqft | Rent | $/sqft | DOM | Units | Dist |
|---|---|---|---|---|---|---|---|---|
| 4408 Rustic Dr New Port Richey, FL | 2.0 | 1.0 | 1101 | $1,500 | $1.36 | 26d | 1 | 0.22mi |
| 4221 Touchton Pl New Port Richey, FL | 2.0 | 2.0 | 888 | $1,300 | $1.46 | 25d | 1 | 0.25mi |
| 4411 Rustic Dr Unit 1 New Port Richey, FL | 2.0 | 2.0 | 1050 | $1,450 | $1.38 | 14d | 1 | 0.25mi |
| 4540 Irene Loop New Port Richey, FL | 2.0 | 1.0 | 768 | $1,550 | $2.02 | 26d | 1 | 0.33mi |
| 4645 Irene Loop New Port Richey, FL | 3.0 | 1.0 | 1158 | $1,700 | $1.47 | 1d | 1 | 0.35mi |
| 4022 Davit Dr New Port Richey, FL | 2.0 | 2.0 | 1144 | $1,600 | $1.40 | 19d | 1 | 0.36mi |
| 4721 Naftis Ln New Port Richey, FL | 3.0 | 2.0 | 1104 | $1,700 | $1.54 | 14d | 1 | 0.36mi |
| 4031 Davit Dr New Port Richey, FL | 2.0 | 2.0 | 1144 | $1,600 | $1.40 | 19d | 1 | 0.37mi |
| 4122 Hampton Dr New Port Richey, FL | 2.0 | 2.0 | 1050 | $1,795 | $1.71 | 0d | 1 | 0.38mi |
| 4616 Irene Loop New Port Richey, FL | 2.0 | 1.0 | 898 | $1,600 | $1.78 | 21d | 1 | 0.39mi |
| 4282 Rudder Way New Port Richey, FL | 3.0 | 2.0 | 1454 | $2,000 | $1.38 | 26d | 1 | 0.40mi |
| 4282 Rudder Way New Port Richey, FL | 3.0 | 2.0 | 1310 | $2,000 | $1.53 | 5d | 1 | 0.40mi |
| 4124 Flamingo Dr New Port Richey, FL | 3.0 | 1.0 | 744 | $1,500 | $2.02 | 16d | 1 | 0.45mi |
| 4124 Flamingo Dr New Port Richey, FL | 3.0 | 1.0 | 744 | $1,500 | $2.02 | 5d | 1 | 0.45mi |
| 4852 Pompano Dr New Port Richey, FL | 2.0 | 2.0 | 1104 | $2,900 | $2.63 | 26d | 1 | 0.49mi |
| 4301 Straits Ln New Port Richey, FL | 3.0 | 1.5 | 1284 | $1,790 | $1.39 | 26d | 1 | 0.51mi |
| 3847 Lighthouse Way New Port Richey, FL | 2.0 | 2.0 | 1144 | $1,595 | $1.39 | 23d | 1 | 0.54mi |
| 5020 Vickers Dr New Port Richey, FL | 2.0 | 1.0 | 863 | $1,495 | $1.73 | 1d | 1 | 0.59mi |
| 4133 Grayton Dr New Port Richey, FL | 2.0 | 1.5 | 1068 | $1,727 | $1.62 | 6d | 1 | 0.62mi |
| 4554 Nimmer Dr New Port Richey, FL | 3.0 | 2.0 | 1180 | $1,600 | $1.36 | 16d | 1 | 0.63mi |
| 4548 Belfast Dr New Port Richey, FL | 3.0 | 1.0 | 1075 | $1,575 | $1.47 | 19d | 1 | 0.67mi |
| 4939 Floramar Ter New Port Richey, FL | 2.0 | 2.0 | 1050 | $1,600 | $1.52 | 3d | 2 | 0.69mi |
| 4939 Floramar Ter New Port Richey, FL | 2.0 | 2.0 | 1050 | $1,648 | $1.57 | 18d | 3 | 0.69mi |
| 4939 Floramar Ter New Port Richey, FL | 2.0 | 2.0 | 1050 | $1,675 | $1.60 | 26d | 2 | 0.69mi |
| 4117 Highland Loop New Port Richey, FL | 3.0 | 2.0 | 1384 | $1,599 | $1.16 | 14d | 1 | 0.72mi |
| 4834 Salem Dr New Port Richey, FL | 2.0 | 1.0 | 864 | $1,400 | $1.62 | 0d | 1 | 0.74mi |
| 4436 Floramar Ter New Port Richey, FL | 2.0 | 1.5 | 890 | $2,295 | $2.58 | 6d | 1 | 0.77mi |
| 4430 Floramar Ter New Port Richey, FL | 2.0 | 1.5 | 1094 | $2,500 | $2.29 | 4d | 1 | 0.77mi |
| 4518 Audrey Ln Unit 4551 New Port Richey, FL | 2.0 | 1.0 | 750 | $1,295 | $1.73 | 23d | 1 | 0.77mi |
| 4529 Audrey Ln New Port Richey, FL | 2.0 | 1.0 | 750 | $1,295 | $1.73 | 23d | 1 | 0.78mi |
| 4540 Audrey Ln New Port Richey, FL | 2.0 | 1.0 | 750 | $1,150 | $1.53 | 26d | 1 | 0.80mi |
| 4551 Audrey Ln NEW PRT RCHY, FL | 2.0 | 1.0 | 750 | $1,295 | $1.73 | 23d | 1 | 0.80mi |
| 5197 Silent Loop New Port Richey, FL | 2.0 | 2.0 | 956 | $2,200 | $2.30 | 5d | 1 | 0.83mi |
| 5197 Silent Loop #124 New Port Richey, FL | 2.0 | 2.0 | 956 | $2,200 | $2.30 | 26d | 1 | 0.83mi |
| 4754 Marine Pkwy Unit 2 New Port Richey, FL | 3.0 | 2.0 | 1312 | $1,750 | $1.33 | 16d | 1 | 0.84mi |
| 4754 Marine Pkwy Unit 102-I New Port Richey, FL | 2.0 | 2.0 | 1088 | $1,500 | $1.38 | 26d | 1 | 0.84mi |
| 4854 Marine Pkwy #103 New Port Richey, FL | 1.0 | 2.0 | 1088 | $1,500 | $1.38 | 26d | 1 | 0.84mi |
| 5132 Amulet Dr #107 New Port Richey, FL | 1.0 | 1.0 | 928 | $1,395 | $1.50 | 14d | 1 | 0.84mi |
| 4747 Azalea Dr #208 New Port Richey, FL | 2.0 | 2.0 | 1128 | $1,200 | $1.06 | 19d | 1 | 0.85mi |
| 5319 Drift Tide Dr New Port Richey, FL | 2.0 | 1.5 | 1142 | $1,500 | $1.31 | 12d | 1 | 0.85mi |
HOA detail
- Monthly dues
- $175 · $2,100/yr
- Likely covers
- water
Listing history 22 events
-
2026-06-18days on market $118,000 Active 86 DOM
-
2026-06-17days on market $118,000 Active 85 DOM
-
2026-06-16days on market $118,000 Active 84 DOM
-
2026-06-15days on market $118,000 Active 83 DOM
-
2026-06-13days on market $118,000 Active 81 DOM
-
2026-06-09days on market $118,000 Active 77 DOM
-
2026-06-08days on market $118,000 Active 76 DOM
-
2026-06-07days on market $118,000 Active 75 DOM
-
2026-06-04days on market $118,000 Active 72 DOM
-
2026-06-03days on market $118,000 Active 71 DOM
-
2026-06-02days on market $118,000 Active 70 DOM
-
2026-06-01days on market $118,000 Active 69 DOM
-
2026-05-31days on market $118,000 Active 68 DOM
-
2026-04-25price $118,000
-
2026-04-03status Active
-
2026-03-30status Pending
-
2026-03-20$120,000 Active
-
2014-12-02historical
-
2014-11-11$62,000 Active
-
2010-01-15historical
-
2008-11-03$69,900
-
2006-02-08$86,500
ⓘ Source: listings_history table (triggers on properties + properties_extension) + one-shot
backfill from property_details.listing_events for pre-trigger history.
Tax reassessment forecast FL · Resets to sale price
- Current annual tax
- $944 · $79/mo
- Projected year-2 tax
- $979 · $82/mo
- Expected delta
- +$35/yr (+$3/mo · 3.7%)
ⓘ Screening estimate from a state-policy table — verify with the county assessor before closing.
Climate risk First Street
- Flood 10/10 Extreme FEMA zone AE · 99% chance over 30 yrs
- Wildfire 3/10 Moderate
- Heat 10/10 Extreme 7 d/yr ≥109°F today · 25 d/yr by 30 yrs out
- Wind 10/10 Extreme 99% chance of damaging wind over 30 yrs
- Air quality 2/10 Low 1 unhealthy d/yr today · 1 by 30 yrs out
Nearby sold comps map
Loading sold comps map…
Walkable amenities ~0.75 mi
Loading nearby amenities…
Taxation est. · year 1
- Rental income
- $19,904
- − Mortgage interest
- −$6,610
- − Property taxes
- −$944
- − Insurance
- −$5,708
- − Repairs & maintenance
- −$1,592
- − Management
- −$1,592
- − HOA
- −$2,100
- − Depreciation
- −$3,433
- Taxable loss
- −$2,076
- Est. tax savings @ 24.0%
- +$498
- After-tax cash flow
- $44/yr
For passive investors: Depreciation is non-cash, so a rental often shows a tax loss while cash-flowing — sheltering income. Rental losses are passive: they offset passive income freely, and up to $25,000/yr can offset ordinary (W-2) income if you actively participate and your MAGI is under $100k (phasing out to $0 by $150k); unused losses carry forward. On sale, claimed depreciation is recaptured at up to 25%, and gains may owe capital-gains tax (a 1031 exchange can defer both). Figures are a year-1 estimate at your 24.0% rate — not tax advice; consult a CPA.
Schools (NCES district)
- District
- Pasco
- NCES district ID
- 1201530
- Math proficiency
- 50% ▼ -10.00%
- Reading proficiency
- 52% ▼ -5.00%
- Median HH income
- $45,039
- Composite
- 43.14/100
- National rank
- #3074
- State rank
- #32 of 73 in FL
Livability — Beacon Square
- Score
- 66/100
- State rank
- #600
- US rank
- #11494
Category grades
Schools grade is shown separately in the Schools card above.
Census & demographics
- Census place
- Beacon Square, FL
- County
- Pasco County · 524,098 people
- Metro
- Tampa-St. Petersburg-Clearwater, FL
- Population (ZIP)
- 27,444
- Household income
- $56,931
- Rent vs Own
- Severe rent burden
- 1190.0
Population outlook (Pasco County) Hauer SSP2
- Today (2025)
- 570,045 people
- By 2030
- 605,844 · +6.3%
- By 2040
- 674,806 · +18.4%
- By 2050
- 736,022 · +29.1%
- By 2075
- 862,900 · +51.4%
- By 2100
- 906,364 · +59.0%
Race, ethnicity, and origin ACS 2023
- Neighborhood character
- Predominantly White (78%)
- Race & ethnicity
- White 78% Hispanic / Latino 13% Two or more races 9% Black 4%
- Hispanic origin (detail)
- Mexican 3% Puerto Rican 4% Cuban 4%
- Common ancestry
- Romanian 4% Lithuanian 3% Slovak 2%
- Foreign-born
- 9% · Canada
- Languages at home
- 87% English-only · Spanish 9% Other Indo-European 1% Russian/Polish/Slavic 1%
Political lean MEDSL · Pasco
- 2024 margin
- Strong R (+25.2) · D 36.9% · R 62.1% · Other 1.0%
- 2008→2024 swing
- -21.6pp toward R · 2008: -3.6pp · 2024: -25.2pp
- All cycles
- 2024: R+25.2 2020: R+20.1 2016: R+21.6 2012: R+6.7 2008: R+3.6
Not yet ingested
- Civics
- —
Market trends
- HPI YoY
- ▼ -109.49%
- Current HPI
- 310.8347
- Rent YoY
- ▲ 0.72%
- Metro
- Tampa-St. Petersburg-Clearwater, FL
- State GDP YoY
- ▲ 3.28%
- F500 in state
- 36
Industry mix (Fortune 500 HQ in FL)
| Industry | F500 HQs | Revenue |
|---|---|---|
| Industrial Technology | 2 | $29B |
|
||
| Insurance | 2 | $17B |
|
||
| Retail | 1 | $60B |
|
||
| Technology Distribution | 1 | $58B |
|
||
| Homebuilding | 1 | $35B |
|
||
| Technology Manufacturing | 1 | $35B |
|
||
Price history
+36.4% since first listed9 events — show timeline
- 2026-04-25 Price Changed $118,000 Stellar MLS as Distributed by MLS Grid
- 2026-04-03 Relisted — Stellar MLS as Distributed by MLS Grid
- 2026-03-30 Pending — Stellar MLS as Distributed by MLS Grid
- 2026-03-20 Listed $120,000 Stellar MLS as Distributed by MLS Grid
- 2014-12-02 Listing Removed — Stellar MLS as Distributed by MLS Grid
- 2014-11-11 Listed $62,000 Stellar MLS as Distributed by MLS Grid
- 2010-01-15 Listing Removed — Stellar MLS as Distributed by MLS Grid
- 2008-11-03 Listed $69,900 Stellar MLS as Distributed by MLS Grid
- 2006-02-08 Listed $86,500 Stellar MLS as Distributed by MLS Grid
Property tax history
+14.4%/yrLatest (2025): $944 · +71.7% YoY. Source: county tax records.
Cash-flow waterfall
monthlySold comps — $/sqft
last 12 mo · ≤1 miLoading sold comps…