 Duplex
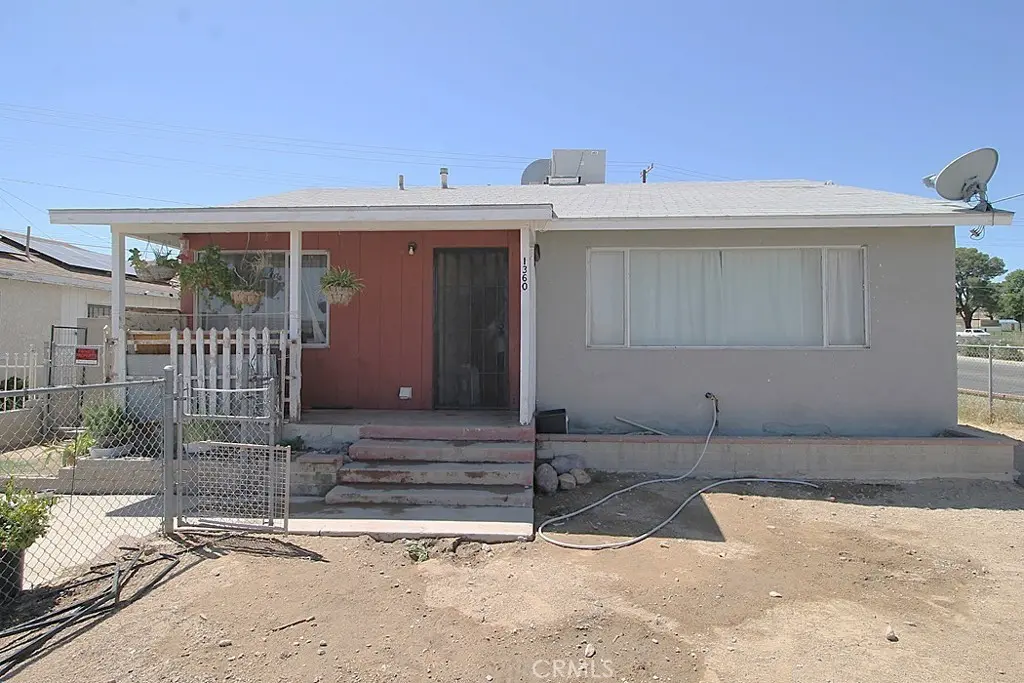
1360 Nancy · Barstow, CA
Flood risk 1/10 · Minimal
- FEMA flood zone
- X (unshaded)
- Chance of flooding over 30 yrs
- 0.0%
- Est. flood insurance / yr
- $507 – $1,088
Fire risk 3/10 · Minor
- Est. fire insurance / yr
- $659 – $1,223
Heat risk 8/10 · Major
- Hot days now (above 102°F)
- 7 days/yr
- Hot days in 30 yrs
- 21 days/yr
Wind risk 1/10 · Minimal
- Chance of severe wind over 30 yrs
- —
Air-quality risk 6/10 · Moderate
- Unhealthy air days now
- 11 days/yr
- Unhealthy air days in 30 yrs
- 15 days/yr
Risk factors via First Street. Map © Google.
Why this score? — see what drove the C- grade
The composite is a weighted blend of 9 inputs, each scored 0–100. Each bar is that input's sub-score; the figure is the points it added to the 100-point composite (weight × sub-score).
- Cash flow +22.6/30.0
- ARV discount +7.4/15.0
- DSCR +7.3/10.0
- 1% rule +4.8/10.0
- Livability +3.2/5.0
- Rent growth +3.1/5.0
- Condition / age +2.5/5.0
- Schools +1.4/10.0
- Appreciation +0.0/10.0
$267,000
🖨 Deal sheet 📄 Offer letter ✓ Due diligence
Multi-family units
County records classify this as Multi-Family (2-4 Unit). Listing-text estimate: 2 units. confirmed
Listing remarks
Two units, 2 bedroom, 1 bath, and the other unit is 1 bed, 1 bath. Not your average income property—this is the opportunity buyers have been waiting for. Owner-occupied and meticulously maintained, this duplex stands out from the rest. Located near two elementary schools and Foglesong Park, the property offers strong appeal for both homeowners and tenants alike. Whether you’re looking to live in one unit and offset your mortgage with rental income, or add a high-potential investment to your portfolio, this property delivers. With market rents, the return on investment could be exceptional. The front unit features two generously sized bedrooms and an updated walk-in shower. The b
Key facts
- 7,832 sq ft lot
- 2 garage spots
- Built 1922
Property features AI
Finance
- Other: Total building area: 1,520; Number of buildings: 1; Directions: From Main St to G Avenue. Property is east toward the elementary school
- Financial info: Gross income: $8,400; Net operating income: $8,400; Gross scheduled income listed as $700; Unit 2 rent currently $700; Total expenses: $1,440 (water/sewer $720; trash $720)
Exterior
- Parking: Attached garage(s); Two garage spaces total; Driveway (combination); Two total parking spaces
- Utilities: Public sewer; District/public water; One separate water meter; Two separate gas meters; Two separate electric meters
- Home design: Duplex with 2 total units; Single-story building; No common walls between units; No accessory dwelling unit
- Construction: One building; Year built per assessor (source: Assessor)
- Exterior features: No pool; Corner lot; Street lighting in the neighborhood
Interior
- Kitchen: Both units have ranges
- Bedrooms: Unit 1: 2 bedrooms (ground level); Unit 2: 1 bedroom (ground level)
- Bathrooms: Unit 1: 1 full bathroom; Unit 2: 1 full bathroom
- Heating & cooling: Wall heaters; Evaporative cooling; Two wall-mounted AC units
- Interior features: One-level layout; Front door entry
- Laundry & utility: Laundry located in the kitchen; Shared washer/dryer details not specified
Neighborhood map
What this means for you Summary
Snapshot
- This is a 1×2bd/1ba + 1×1bd/1ba units multifamily listed at $267k.
Deal economics
- At list price, monthly cash flow is $456 ($5k/yr) — positive. Per door: $228/mo.
- The deal already cash-flows at list — no discount required.
- To meet the 1% rule (rent ≥ 1% of price), the offer needs to be $262k (2.1% below list).
- Recommended offer: $259k (3.0% below list) — sets the bar for market timing.
- Cap rate 8.3% vs local median 4.6% in Barstow — top-decile yield for the area; either an underpriced asset or a hidden risk that comps aren't pricing in. Stress-test before assuming the spread holds.
Location & tenants
- Location reads 63/100 on livability (#444 in CA) — a middle-class / working-renter tenant base. Strengths: commute A+, housing A+; Watch: amenities C-, health & safety C-, schools F.
- Barstow Unified (town): math 11% / reading 22% proficiency, ranked #482 of 517 in CA (top 93%) — low school quality limits family demand, transient renter base, plan for 1-2y turnover; 68% free/reduced lunch — lower-income household profile, screen leases tightly.
- Market conditions: Rents rising (+2.3%/yr); 343 active listings in the ZIP; 5,458 units permitted in San Bernardino County in 2024 (1,500 in 5+ unit buildings).
- At $2,615/mo this rent would consume 51% of the median local household income ($62k/yr) (locally 1305% of renters already pay >50% of income on rent) — very limited rent-growth headroom before tenants either downsize or default.
Forward outlook
- Local home prices are declining (-3.0%/yr); year-one equity from $2k of loan paydown is wiped out by about $8k of value loss. Plan a longer hold.
- San Bernardino County population projected at +15% by 2050 — modest demand growth; plan on rents tracking national, not racing it.
Negotiation context
- It's been on market 34 days — a 3% lower offer ($259k) is reasonable based on typical stale-listing flexibility.
- Current owner paid $100k; list at $267k implies a 167% gain — meaningful room to come down on a strong offer.
Risks & watch-outs
- Watch-outs: built in 1922 — expect roof / HVAC / electrical / plumbing capex.
- Climate carrying-cost: extreme-heat days projected 7→21/yr by 2055 (HVAC capex compounding) — expect insurance premiums to compound above CPI over the hold.
Questions for the listing agent
- It's been on market 34 days. Have you received any prior offers? Is the seller open to a 3% concession, seller financing, or rate buy-down credit?
- Can we see the unit-by-unit rent roll, current vacancy, and any below-market leases? What's the average tenancy length?
- What capital expenditures (roof, boiler, parking lot, exteriors) have been made in the last 5 years, and what's planned in the next 2?
- Built in 1922 — when were the roof, HVAC, electrical panel, plumbing, and water heater last replaced?
- Is there a deadline driving the sale (1031 exchange, divorce, estate, relocation)? That informs how much negotiation room exists.
- Schools are F-rated, which usually means shorter tenancies and higher turnover. Who's the typical renter profile here, and what's been the actual vacancy rate?
- Crime grade is F in this area — have there been break-ins, vandalism, or insurance claims at this property in the last 3 years? What carrier currently insures it and at what premium?
- What's the average days-on-market for RENTAL listings here right now (not sales)? A rising rental-DOM trend means longer vacancies and softer asking-rent achievability than the comps imply.
- What's the recent tenant-quality profile in this submarket — average credit score on applications, eviction rate, late-payment / NSF rate, and stable-employment percentage? A property-management company in the area should have these aggregated.
- How much new apartment / multifamily construction is in the pipeline within 1–3 miles? Heavy new supply (>2% of stock underway) typically softens rents 12–24 months out; light construction supports rent growth.
Investment metrics
- 1% rule
- 0.98% ✗
- Cap rate
- 8.34%
- Cash-on-cash
- 7.31%
- DSCR
- 1.33
- GRM
- 8.5
CMA / ARV
- ARV (median comp)
- $266,547
- List price
- $267,000
- Delta
- 0.17%
- Verdict
- FAIR
- Comps
- 9 within 1.0 mi
Projected returns pro-forma
-3.0% appreciation · 2.32% rent growth · sell at horizon
- IRR
- -5.8%
- Equity multiple
- 0.78×
- Total profit
- $-16,135
- Equity at exit
- $39,811
- IRR
- 3.0%
- Equity multiple
- 1.21×
- Total profit
- $15,688
- Equity at exit
- $23,085
Cash invested: $74,760 (down + closing). Projections, not guarantees.
Landlord ↔ Tenant lean methodology
- Overall (STATE)
- 18 Strongly Tenant-Friendly
- State California
- 18 Strongly Tenant-Friendly · D+13
- County
- — inherits STATE
- City
- — inherits STATE
ZIP-level market 92311
- Home prices YoY
- -30.6%
- Rents YoY
- 2.3%
- Active inventory
- 343
- Price-to-rent
- 15.8×
Monthly cashflow live
- Estimated rent
- $2,615 high interval (Pro) →
- Mortgage (P&I)
- −$1,400
- Tax from tax record
- −$99 /mo · $1,187/yr
- Insurance
- −$111
- HOA
- −$0
- Vacancy / Maint / Mgmt
- −$549
- Net cashflow
- $456
Break-even live
2-unit breakdown (identical units grouped — click to expand)
| Units | Beds | Baths | Est. rent |
|---|---|---|---|
| 1× unit | 2 | 1 | $1,407 |
| 1× unit | 1 | 1 | $1,208 |
| Total (2 units) | $2,615 | ||
UW: 25.0% down · 7.5% · 30yr · 1.5% tax · 5.0% vac · 8.0% maint · 8.0% mgmt
Financing live
Cash to close
- Down payment
- $66,750
- Closing costs
- $8,010
- Reserves months
- —
- Total cash needed
- —
Loan-product check · same deal, 3 products live
Conventional
25% down · 7.5% · 30yr
- Down + closing
- —
- Monthly P&I
- —
- Monthly cashflow
- —
- DSCR
- —
- Eligible?
- —
Personal DTI + credit; lowest rate.
DSCR
20% down · 8.5% · 30yr
- Down + closing
- —
- Monthly P&I
- —
- Monthly cashflow
- —
- DSCR
- —
- Eligible?
- —
No personal income docs; deal must DSCR.
Hard money
10% down · 12.0% · 12mo
- Down + closing
- —
- Monthly P&I
- —
- Monthly cashflow
- —
- DSCR
- —
- Eligible?
- —
Short-term bridge; refi at stabilization.
Listing history 17 events
-
2026-06-18days on market $267,000 Active 34 DOM
-
2026-06-17days on market $267,000 Active 33 DOM
-
2026-06-16days on market $267,000 Active 32 DOM
-
2026-06-15days on market $267,000 Active 31 DOM
-
2026-06-13days on market $267,000 Active 29 DOM
-
2026-06-13days on market $267,000 Active 28 DOM
-
2026-06-09days on market $267,000 Active 25 DOM
-
2026-06-08days on market $267,000 Active 24 DOM
-
2026-06-07days on market $267,000 Active 23 DOM
-
2026-06-04days on market $267,000 Active 20 DOM
-
2026-06-03days on market $267,000 Active 19 DOM
-
2026-06-02days on market $267,000 Active 18 DOM
-
2026-06-01days on market $267,000 Active 17 DOM
-
2026-05-31days on market $267,000 Active 16 DOM
-
2026-05-15$267,000 Active 1016-char remark
-
2026-05-11historical $267,000 1016-char remark
-
2022-10-12soldstatus $100,000
ⓘ Source: listings_history table (triggers on properties + properties_extension) + one-shot
backfill from property_details.listing_events for pre-trigger history.
Tax reassessment forecast CA · Resets to sale price
- Current annual tax
- $1,187 · $99/mo
- Projected year-2 tax
- $2,029 · $169/mo
- Expected delta
- +$842/yr (+$70/mo · 71.0%)
ⓘ Screening estimate from a state-policy table — verify with the county assessor before closing.
Climate risk First Street
- Flood 1/10 Low FEMA zone X (unshaded) · 0% chance over 30 yrs
- Wildfire 3/10 Moderate
- Heat 8/10 Severe 7 d/yr ≥102°F today · 21 d/yr by 30 yrs out
- Wind 1/10 Low
- Air quality 6/10 Major 11 unhealthy d/yr today · 15 by 30 yrs out
Nearby sold comps map
Loading sold comps map…
Walkable amenities ~0.75 mi
Loading nearby amenities…
Taxation est. · year 1
- Rental income
- $31,380
- − Mortgage interest
- −$14,956
- − Property taxes
- −$1,187
- − Insurance
- −$1,335
- − Repairs & maintenance
- −$2,510
- − Management
- −$2,510
- − Depreciation
- −$7,767
- Taxable income
- $1,114
- Est. tax owed @ 24.0%
- −$267
- After-tax cash flow
- $5,199/yr
For passive investors: Depreciation is non-cash, so a rental often shows a tax loss while cash-flowing — sheltering income. Rental losses are passive: they offset passive income freely, and up to $25,000/yr can offset ordinary (W-2) income if you actively participate and your MAGI is under $100k (phasing out to $0 by $150k); unused losses carry forward. On sale, claimed depreciation is recaptured at up to 25%, and gains may owe capital-gains tax (a 1031 exchange can defer both). Figures are a year-1 estimate at your 24.0% rate — not tax advice; consult a CPA.
Schools (NCES district)
- District
- Barstow Unified
- NCES district ID
- 0604020
- Math proficiency
- 11% ▼ -7.00%
- Reading proficiency
- 22% ▼ -7.00%
- Median HH income
- $44,505
- Composite
- 14.44/100
- National rank
- #9430
- State rank
- #482 of 517 in CA
Livability — Barstow
- Score
- 63/100
- State rank
- #444
- US rank
- #15099
Category grades
Schools grade is shown separately in the Schools card above.
Census & demographics
- Census place
- Barstow, CA
- County
- San Bernardino County · 2,030,291 people
- City population
- 33,954
- Metro
- Riverside-San Bernardino-Ontario, CA
- Population (ZIP)
- 33,954
- Household income
- $61,862
- Rent vs Own
- Severe rent burden
- 1305.0
Population outlook (San Bernardino County) Hauer SSP2
- Today (2025)
- 2,300,329 people
- By 2030
- 2,378,907 · +3.4%
- By 2040
- 2,523,137 · +9.7%
- By 2050
- 2,642,388 · +14.9%
- By 2075
- 2,880,769 · +25.2%
- By 2100
- 2,909,436 · +26.5%
Race, ethnicity, and origin ACS 2023
- Neighborhood character
- Diverse neighborhood (Simpson 0.68)
- Race & ethnicity
- Hispanic / Latino 46% White 29% Two or more races 22% Black 15% Native American 3% Asian 2% Pacific Islander 1%
- Hispanic origin (detail)
- Mexican 39% Puerto Rican 2%
- Common ancestry
- Portuguese 1% Lithuanian 1% Italian 1%
- Foreign-born
- 9% · Canada, South Korea
- Languages at home
- 77% English-only · Spanish 20% Tagalog/Filipino 1% Other Indo-European 1%
Political lean MEDSL · San Bernardino
- 2024 margin
- Toss-up / Even · D 47.5% · R 49.7% · Other 2.8%
- 2008→2024 swing
- -8.5pp toward R · 2008: 6.3pp · 2024: -2.1pp
- All cycles
- 2024: R+2.1 2020: D+10.7 2016: D+9.8 2012: D+5.4 2008: D+6.3
Not yet ingested
- Civics
- —
Market trends
- HPI YoY
- ▼ -139.26%
- Current HPI
- 316.4858
- Rent YoY
- ▲ 2.32%
- Metro
- Riverside-San Bernardino-Ontario, CA
- State GDP YoY
- ▲ 3.21%
- F500 in state
- 116
Industry mix (Fortune 500 HQ in CA)
| Industry | F500 HQs | Revenue |
|---|---|---|
| Technology | 27 | $1,492B |
|
||
| Financial Services | 3 | $174B |
|
||
| Retail | 3 | $44B |
|
||
| Insurance | 3 | $26B |
|
||
| Media / Entertainment | 2 | $115B |
|
||
| Pharmaceuticals / Biotech | 2 | $62B |
|
||
Price history
+167.0% since first listed3 events — show timeline
- 2026-05-15 Listed $267,000 CRMLS
- 2026-05-11 Coming Soon $267,000 CRMLS
- 2022-10-12 Sold (Public Records) $100,000 Public Records
Property tax history
+6.0%/yrLatest (2025): $1,187 · +1.8% YoY. Source: county tax records.
Cash-flow waterfall
monthlySold comps — $/sqft
last 12 mo · ≤1 miLoading sold comps…