203 Sharer St · San Antonio, TX
Flood risk 1/10 · Minimal
- FEMA flood zone
- X (unshaded)
- Chance of flooding over 30 yrs
- 0.0%
- Est. flood insurance / yr
- $507 – $1,088
Fire risk 1/10 · Minimal
- Est. fire insurance / yr
- $1,222 – $2,270
Heat risk 8/10 · Major
- Hot days now (above 108°F)
- 7 days/yr
- Hot days in 30 yrs
- 22 days/yr
Wind risk 8/10 · Major
- Chance of severe wind over 30 yrs
- 80.0%
Air-quality risk 2/10 · Minimal
- Unhealthy air days now
- 1 days/yr
- Unhealthy air days in 30 yrs
- 2 days/yr
Risk factors via First Street. Map © Google.
Why this score? — see what drove the B+ grade
The composite is a weighted blend of 9 inputs, each scored 0–100. Each bar is that input's sub-score; the figure is the points it added to the 100-point composite (weight × sub-score).
- Cash flow +30.0/30.0
- 1% rule +10.0/10.0
- DSCR +10.0/10.0
- Appreciation +10.0/10.0
- ARV discount +7.5/15.0
- Livability +4.0/5.0
- Rent growth +2.7/5.0
- Condition / age +2.5/5.0
- Schools +1.4/10.0
$98,900
🖨 Deal sheet 📄 Offer letter ✓ Due diligence
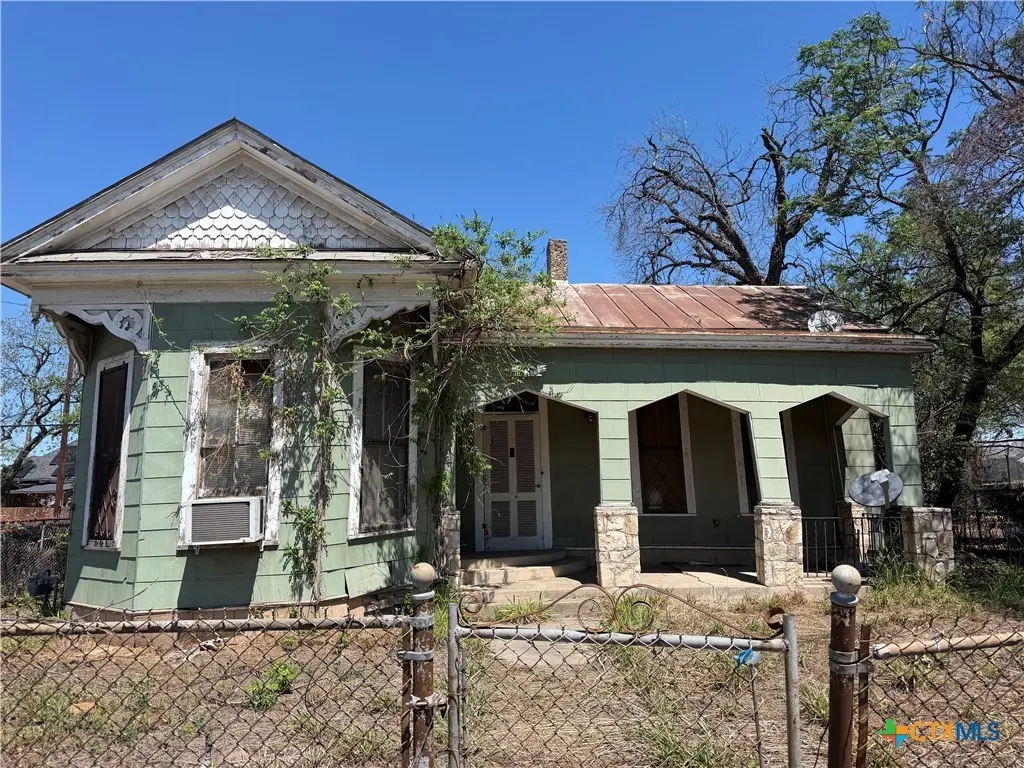
Listing remarks
Investor Special with Endless Potential! Situated on a desirable corner lot in a prime location with quick and convenient access to I-35, this 3-bedroom, 1-bath home presents an excellent opportunity for investors, flippers, or buyers looking to add their personal touch. With solid bones and plenty of possibilities, this property is ready to be transformed into something special. The corner lot offers added space, visibility, and flexibility, while the convenient location places you just minutes from Rivercenter Mall, Dining, Museums, The Zoo, The River walk, The Alamo, schools and major commuting routes. Whether you’re searching for your next investment project, rental property, or a
Key facts
- Quick access to i-35
- Near dining
- Near museums
Tags
Property features AI
Exterior
- Parking: Detached garage; Detached carport; 2-car garage space; 2-car carport space
- Utilities: Above-ground utilities; Electricity available and on property; Public water; Public sewer
- Home design: Single-story; Resale property; Pillar/post/pier foundation; Metal roof
- Construction: See remarks for construction materials; Year built per assessor
- Exterior features: Covered porch; Porch; Full chain-link fencing
Interior
- Kitchen: Dishwasher; Electric range
- Bedrooms: Other (1 total room listed)
- Flooring: Carpet; Combination flooring
- Bathrooms: 1 full bathroom
- Heating & cooling: Window unit heating; Wall/window unit cooling
- Interior features: Ceiling fans; High ceilings; Pull-down attic stairs; Shower only (separate shower)
- Laundry & utility: Laundry on main level
Neighborhood map
What this means for you Summary
Snapshot
- This is a 3-bed/1.0-bath single-family listed at $99k.
Deal economics
- At list price, monthly cash flow is $684 ($8k/yr) — positive.
- The deal already cash-flows at list — no discount required.
- Meets the 1% rule at list price ($2k rent vs $99k).
- Recommended offer: $97k (1.5% below list) — sets the bar for market timing.
- Cap rate 14.6% vs local median 3.8% in San Antonio — top-decile yield for the area; either an underpriced asset or a hidden risk that comps aren't pricing in. Stress-test before assuming the spread holds.
Location & tenants
- Location reads 80/100 on livability (#31 in TX, #1,616 nationally) — a professional / high-income tenant draw. Strengths: amenities A+, commute A+, cost of living A+; Watch: schools C-, crime F.
- San Antonio ISD (urban): math 12% / reading 22% proficiency, ranked #805 of 826 in TX (top 98%) — low school quality limits family demand, transient renter base, plan for 1-2y turnover; 80% free/reduced lunch — lower-income household profile, screen leases tightly.
- Market conditions: Rents flat; 27 active listings in the ZIP; 40 comparable units currently listed for rent nearby; rentals at typical pace (median 24d on market — plan ~3-4 weeks tenant-placement turnaround); 42% of comp listings sitting > 30 days — soft ceiling on asking rent; lower-income renter base — watch delinquency; 8,308 units permitted in Bexar County in 2024 (2,506 in 5+ unit buildings).
- At $1,883/mo this rent would consume 85% of the median local household income ($27k/yr) (locally 526% of renters already pay >50% of income on rent) — very limited rent-growth headroom before tenants either downsize or default.
Forward outlook
- In year one you build about $11k of equity ($684 loan paydown + $10k appreciation (10.0% local appreciation)).
- Bexar County population projected at +50% by 2050 — long-run rental-demand tailwind backs the buy-and-hold thesis.
- At projected returns (10.0% appreciation + 0.7% rent growth), your $28k cash investment doubles in ~2 years — after that, you're playing with house money.
- By year 4, paydown + projected appreciation supports a ~$37k cash-out refi (75% LTV) — recoverable capital for the next deal without selling this one.
Negotiation context
- It's been on market 16 days — a 2% lower offer ($97k) is reasonable based on typical stale-listing flexibility.
Risks & watch-outs
- Watch-outs: property tax is 3.0% of price; built in 1920 — expect roof / HVAC / electrical / plumbing capex.
- Climate carrying-cost: severe wind risk, 80% chance of damaging wind over 30y; extreme-heat days projected 7→22/yr by 2055 (HVAC capex compounding) — expect insurance premiums to compound above CPI over the hold.
Questions for the listing agent
- Built in 1920 — when were the roof, HVAC, electrical panel, plumbing, and water heater last replaced?
- Property tax is high relative to price — has the assessment been appealed recently, and will the sale trigger a re-assessment?
- Is there a deadline driving the sale (1031 exchange, divorce, estate, relocation)? That informs how much negotiation room exists.
- Crime grade is F in this area — have there been break-ins, vandalism, or insurance claims at this property in the last 3 years? What carrier currently insures it and at what premium?
- What's the average days-on-market for RENTAL listings here right now (not sales)? A rising rental-DOM trend means longer vacancies and softer asking-rent achievability than the comps imply.
- What's the recent tenant-quality profile in this submarket — average credit score on applications, eviction rate, late-payment / NSF rate, and stable-employment percentage? A property-management company in the area should have these aggregated.
- How much new for-sale + rental construction is in the pipeline within 1–3 miles? Heavy new supply typically softens prices + rents 12–24 months out; constrained supply supports both.
Investment metrics
- 1% rule
- 1.90% ✓
- Cap rate
- 14.59%
- Cash-on-cash
- 29.64%
- DSCR
- 2.32
- GRM
- 4.4
CMA / ARV
- ARV (on-the-fly)
- $206,640
- Comps found
- 12
Show comp detail 12 sales within ~0.75 mi
| Address | Dist | Beds/Ba | Sqft | Sold | Price | $/sf | Match |
|---|---|---|---|---|---|---|---|
| 132 Sharer | 0.03mi | 3/1.0 | 1,098 (-4%) | 4mo | $120,000 | $109 | 88 |
| 115 Sharer | 0.06mi | 3/2.0 | 1,245 (+8%) | 4mo | $316,000 | $254 | 75 |
| 906 E Carson St | 0.45mi | 2/1.0 (-1) | 1,178 (+3%) | 2mo | $307,000 | $261 | 68 |
| 1015 Rogers | 0.52mi | 4/1.0 (+1) | 1,136 (-1%) | 3mo | $76,019 | $67 | 67 |
| 1019 Nolan | 0.65mi | 3/1.0 | 1,184 (+3%) | 2mo | $210,000 | $177 | 63 |
| 2259 N Interstate 35 | 0.62mi | 3/1.0 | 1,198 (+4%) | 4mo | $124,200 | $104 | 61 |
| 1669 Olive Ibis | 0.30mi | 3/2.0 | 1,280 (+12%) | 4mo | $229,950 | $180 | 60 |
| 1629 Olive Ibis | 0.29mi | 3/2.0 | 1,280 (+12%) | 4mo | $229,950 | $180 | 60 |
| 1001 Mason | 0.46mi | 2/1.0 (-1) | 1,244 (+8%) | 2mo | $200,000 | $161 | 57 |
| 815 Burnet St | 0.57mi | 2/1.0 (-1) | 1,000 (-13%) | 0mo | $299,900 | $300 | 46 |
| 204 Gorman | 0.72mi | 2/2.0 (-1) | 1,054 (-8%) | 3mo | $245,000 | $232 | 41 |
| 1413 Burnet | 0.68mi | 2/2.0 (-1) | 1,005 (-12%) | 4mo | $250,000 | $249 | 35 |
Match score weights: distance 35% · size 25% · config 20% · recency 20%. Top-matched comps best support the ARV.
Projected returns pro-forma
10.0% appreciation · 0.7% rent growth · sell at horizon
- IRR
- 45.3%
- Equity multiple
- 4.37×
- Total profit
- $93,268
- Equity at exit
- $89,097
- IRR
- 38.3%
- Equity multiple
- 9.40×
- Total profit
- $232,749
- Equity at exit
- $192,141
Cash invested: $27,692 (down + closing). Projections, not guarantees.
Landlord ↔ Tenant lean methodology
- Overall (STATE)
- 87 Strongly Landlord-Friendly
- State Texas
- 87 Strongly Landlord-Friendly · R+5
- County
- — inherits STATE
- City
- — inherits STATE
ZIP-level market 78208
- Home prices YoY
- 3.2%
- Rents YoY
- 0.7%
- Active inventory
- 27
- Price-to-rent
- 4.4×
Monthly cashflow live
- Estimated rent
- $1,883 high interval (Pro) →
- Mortgage (P&I)
- −$519
- Tax from tax record
- −$244 /mo · $2,922/yr
- Insurance
- −$41
- HOA
- −$0
- Vacancy / Maint / Mgmt
- −$395
- Net cashflow
- $684
Break-even live
Sensitivity live
| Price | -10% $740 | -5% $712 | +0% $684 | +5% $656 | +10% $628 |
|---|---|---|---|---|---|
| Rent | -10% $535 | -5% $610 | +0% $684 | +5% $758 | +10% $833 |
| Rate | -1.0pp $734 | -0.5pp $709 | base $684 | +0.5pp $658 | +1.0pp $632 |
UW: 25.0% down · 7.5% · 30yr · 1.5% tax · 5.0% vac · 8.0% maint · 8.0% mgmt
Financing live
Cash to close
- Down payment
- $24,725
- Closing costs
- $2,967
- Reserves months
- —
- Total cash needed
- —
Loan-product check · same deal, 3 products live
Conventional
25% down · 7.5% · 30yr
- Down + closing
- —
- Monthly P&I
- —
- Monthly cashflow
- —
- DSCR
- —
- Eligible?
- —
Personal DTI + credit; lowest rate.
DSCR
20% down · 8.5% · 30yr
- Down + closing
- —
- Monthly P&I
- —
- Monthly cashflow
- —
- DSCR
- —
- Eligible?
- —
No personal income docs; deal must DSCR.
Hard money
10% down · 12.0% · 12mo
- Down + closing
- —
- Monthly P&I
- —
- Monthly cashflow
- —
- DSCR
- —
- Eligible?
- —
Short-term bridge; refi at stabilization.
Rent comps 40 comps
| Address | Beds | Baths | Sqft | Rent | $/sqft | DOM | Units | Dist |
|---|---|---|---|---|---|---|---|---|
| 1121 Willow St San Antonio, TX | 2.0 | 1.0 | 900 | $1,000 | $1.11 | 44d | 1 | 0.19mi |
| 1116 Muncey St Unit 2 San Antonio, TX | 3.0 | 2.0 | 896 | $1,500 | $1.67 | 16d | 1 | 0.23mi |
| 1116 Muncey St Unit 1 San Antonio, TX | 3.0 | 2.0 | 896 | $1,600 | $1.79 | 44d | 1 | 0.23mi |
| 1606 N Hackberry St #102 San Antonio, TX | 2.0 | 2.5 | 1474 | $2,500 | $1.70 | 11d | 1 | 0.29mi |
| 821 Burleson San Antonio, TX | 2.0 | 2.5 | 1456 | $1,629 | $1.12 | 44d | 1 | 0.29mi |
| 1219 Muncey San Antonio, TX | 2.0 | 2.0 | 944 | $1,350 | $1.43 | 24d | 1 | 0.30mi |
| 1123 N Olive St San Antonio, TX | 2.0 | 1.0 | 840 | $1,600 | $1.90 | 24d | 1 | 0.30mi |
| 330 E Carson St Unit 3103 San Antonio, TX | 2.0 | 2.5 | 1398 | $2,170 | $1.55 | 44d | 1 | 0.30mi |
| 330 E Carson St Unit 1201 San Antonio, TX | 2.0 | 2.0 | 1215 | $1,650 | $1.36 | 24d | 1 | 0.30mi |
| 330 E Carson St Unit 3103 San Antonio, TX | 2.0 | 2.5 | 1398 | $1,890 | $1.35 | 24d | 1 | 0.30mi |
| 330 E Carson St San Antonio, TX | 2.0 | 2.0 | 1398 | $1,890 | $1.35 | 20d | 1 | 0.30mi |
| 330 E Carson St Unit 2103 San Antonio, TX | 3.0 | 3.0 | 1428 | $1,930 | $1.35 | 24d | 1 | 0.30mi |
| 330 E Carson St San Antonio, TX | 2.0 | 2.0 | 1398 | $1,890 | $1.35 | 22d | 1 | 0.30mi |
| 330 E Carson St Unit 2103 San Antonio, TX | 3.0 | 3.0 | 1428 | $2,215 | $1.55 | 44d | 1 | 0.30mi |
| 410 E Carson St Unit 3 San Antonio, TX | 2.0 | 1.5 | 900 | $1,800 | $2.00 | 44d | 1 | 0.30mi |
| 201 E Carson St Unit 2 San Antonio, TX | 2.0 | 2.0 | 927 | $2,500 | $2.70 | 44d | 1 | 0.41mi |
| 1102 Burleson San Antonio, TX | 3.0 | 2.0 | 1400 | $2,500 | $1.79 | 24d | 1 | 0.43mi |
| 831 E Grayson St San Antonio, TX | 2.0 | 1.0 | 787 | $999 | $1.27 | 15d | 4 | 0.46mi |
| 819 E Grayson St San Antonio, TX | 1.0–2.0 | 1.0 | 825 | $999 | $1.21 | 24d | 4 | 0.46mi |
| 914 E Josephine St San Antonio, TX | 2.0 | 2.5 | 1420 | $2,450 | $1.73 | 44d | 1 | 0.48mi |
| 925 E Carson St Unit 710 San Antonio, TX | 2.0 | 2.0 | 1019 | $1,918 | $1.88 | 3d | 1 | 0.49mi |
| 1542 N Alamo St San Antonio, TX | 2.0 | 2.0 | 1013 | $2,485 | $2.45 | 44d | 1 | 0.50mi |
| 1542 N Alamo St San Antonio, TX | 1.0–2.0 | 1.0–2.0 | 852 | $2,000 | $2.35 | 4d | 2 | 0.50mi |
| 1203 Austin St San Antonio, TX | 1.0–2.0 | 1.0–2.0 | 933 | $2,334 | $2.50 | 2d | 43 | 0.51mi |
| 923 E Carson St San Antonio, TX | 2.0 | 1.0–2.0 | 859 | $2,459 | $2.86 | 2d | 38 | 0.52mi |
| 118 Canadian St San Antonio, TX | 3.0 | 2.0 | 1232 | $2,300 | $1.87 | 44d | 1 | 0.57mi |
| 1800 Broadway St San Antonio, TX | 2.0 | 1.0–2.5 | 1100 | $2,734 | $2.49 | 2d | 41 | 0.59mi |
| 1225 Burnet St Unit 101 San Antonio, TX | 3.0 | 2.0 | 1218 | $1,850 | $1.52 | 44d | 1 | 0.60mi |
| 1323 Lamar St #1 San Antonio, TX | 2.0 | 1.0 | 900 | $999 | $1.11 | 44d | 1 | 0.65mi |
| 1021 N Alamo St San Antonio, TX | 2.0 | 1.0 | 1202 | $2,000 | $1.66 | 44d | 1 | 0.66mi |
| 1915 Broadway Unit 710 San Antonio, TX | 2.0 | 2.0 | 1134 | $2,066 | $1.82 | 3d | 1 | 0.67mi |
| 704 N Cherry St Unit 704 San Antonio, TX | 2.0 | 2.5 | 1200 | $1,800 | $1.50 | 44d | 1 | 0.68mi |
| 1411 Lamar St San Antonio, TX | 2.0 | 1.0 | 700 | $1,125 | $1.61 | 44d | 1 | 0.70mi |
| 1412 Hays St San Antonio, TX | 3.0 | 1.0 | 1250 | $1,495 | $1.20 | 24d | 1 | 0.70mi |
| 503 Avenue A San Antonio, TX | 2.0 | 1.0–2.0 | 906 | $3,325 | $3.67 | 2d | 55 | 0.72mi |
| 603 N Mesquite St San Antonio, TX | 3.0 | 2.5 | 1333 | $1,750 | $1.31 | 24d | 1 | 0.74mi |
| 122 Roy Smith St San Antonio, TX | 3.0 | 1.0–3.0 | 996 | $3,299 | $3.31 | 3d | 18 | 0.75mi |
| 111 W Jones Ave San Antonio, TX | 2.0 | 1.0–2.0 | 773 | $2,689 | $3.48 | 2d | 17 | 0.75mi |
| 103 Saint Charles Unit NA San Antonio, TX | 2.0 | 2.0 | 995 | $1,300 | $1.31 | 44d | 1 | 0.77mi |
| 323 Gabriel Unit 1 201 San Antonio, TX | 2.0 | 2.5 | 1000 | $1,375 | $1.38 | 44d | 1 | 0.78mi |
Listing history 11 events
-
2026-06-18days on market $98,900 Active 16 DOM
-
2026-06-17days on market $98,900 Active 15 DOM
-
2026-06-16days on market $98,900 Active 14 DOM
-
2026-06-15days on market $98,900 Active 13 DOM
-
2026-06-13days on market $98,900 Active 11 DOM
-
2026-06-09days on market $98,900 Active 7 DOM
-
2026-06-08days on market $98,900 Active 6 DOM
-
2026-06-07days on market $98,900 Active 5 DOM
-
2026-06-04days on market $98,900 Active 2 DOM
-
2026-06-02remarks 693-char remark
-
2026-06-02$98,900 Active 1 DOM
ⓘ Source: listings_history table (triggers on properties + properties_extension) + one-shot
backfill from property_details.listing_events for pre-trigger history.
Tax reassessment forecast TX · Resets to sale price
- Current annual tax
- $2,922 · $244/mo
- Projected year-2 tax
- $2,922 · $244/mo
- Expected delta
- $0/yr ($0/mo · 0.0%)
ⓘ Screening estimate from a state-policy table — verify with the county assessor before closing.
Climate risk First Street
- Flood 1/10 Low FEMA zone X (unshaded) · 0% chance over 30 yrs
- Wildfire 1/10 Low
- Heat 8/10 Severe 7 d/yr ≥108°F today · 22 d/yr by 30 yrs out
- Wind 8/10 Severe 80% chance of damaging wind over 30 yrs
- Air quality 2/10 Low 1 unhealthy d/yr today · 2 by 30 yrs out
Nearby sold comps map
Loading sold comps map…
Walkable amenities ~0.75 mi
Loading nearby amenities…
Taxation est. · year 1
- Rental income
- $22,592
- − Mortgage interest
- −$5,540
- − Property taxes
- −$2,922
- − Insurance
- −$494
- − Repairs & maintenance
- −$1,807
- − Management
- −$1,807
- − Depreciation
- −$2,877
- Taxable income
- $7,144
- Est. tax owed @ 24.0%
- −$1,714
- After-tax cash flow
- $6,493/yr
For passive investors: Depreciation is non-cash, so a rental often shows a tax loss while cash-flowing — sheltering income. Rental losses are passive: they offset passive income freely, and up to $25,000/yr can offset ordinary (W-2) income if you actively participate and your MAGI is under $100k (phasing out to $0 by $150k); unused losses carry forward. On sale, claimed depreciation is recaptured at up to 25%, and gains may owe capital-gains tax (a 1031 exchange can defer both). Figures are a year-1 estimate at your 24.0% rate — not tax advice; consult a CPA.
Schools (NCES district)
- District
- San Antonio ISD
- NCES district ID
- 4838730
- Math proficiency
- 12% ▼ -21.00%
- Reading proficiency
- 22% ▼ -7.00%
- Median HH income
- $30,952
- Composite
- 13.57/100
- National rank
- #9512
- State rank
- #805 of 826 in TX
Livability — San Antonio
- Score
- 80/100
- State rank
- #31
- US rank
- #1616
Category grades
Schools grade is shown separately in the Schools card above.
Census & demographics
- Census place
- San Antonio, TX
- County
- Bexar County · 1,990,555 people
- City population
- 1,806,925
- Metro
- San Antonio-New Braunfels, TX
- Population (ZIP)
- 3,861
- Household income
- $26,595
- Rent vs Own
- Severe rent burden
- 526.0
Population outlook (Bexar County) Hauer SSP2
- Today (2025)
- 2,336,851 people
- By 2030
- 2,560,728 · +9.6%
- By 2040
- 3,020,569 · +29.3%
- By 2050
- 3,493,522 · +49.5%
- By 2075
- 4,668,459 · +99.8%
- By 2100
- 5,533,242 · +136.8%
Race, ethnicity, and origin ACS 2023
- Neighborhood character
- Majority Hispanic (63%)
- Race & ethnicity
- Hispanic / Latino 63% Black 25% Two or more races 22% White 10%
- Hispanic origin (detail)
- Mexican 55%
- Common ancestry
- Serbian 1% Romanian 1% Lithuanian 1%
- Foreign-born
- 10% · Canada, Jamaica
- Languages at home
- 69% English-only · Spanish 30% Russian/Polish/Slavic 1%
Political lean MEDSL · Bexar
- 2024 margin
- Lean D (+9.8) · D 54.3% · R 44.6% · Other 1.1%
- 2008→2024 swing
- +4.2pp toward D · 2008: 5.6pp · 2024: 9.8pp
- All cycles
- 2024: D+9.8 2020: D+18.2 2016: D+13.5 2012: D+4.6 2008: D+5.6
Not yet ingested
- Civics
- —
Market trends
- HPI YoY
- ▲ 13.53%
- Current HPI
- 432.482
- Rent YoY
- ▲ 0.70%
- Metro
- San Antonio-New Braunfels, TX
- State GDP YoY
- ▲ 3.95%
- F500 in state
- 110
Industry mix (Fortune 500 HQ in TX)
| Industry | F500 HQs | Revenue |
|---|---|---|
| Energy | 16 | $1,198B |
|
||
| Technology | 5 | $198B |
|
||
| Engineering / Construction | 4 | $72B |
|
||
| Energy Services | 3 | $60B |
|
||
| Utilities | 3 | $41B |
|
||
| Healthcare | 2 | $330B |
|
||
Price history
3 events — show timeline
- 2026-06-02 Listed $98,900 CTXMLS
- 2025-10-27 Sold (Public Records) — Public Records
- 2002-11-15 Sold (Public Records) — Public Records
Property tax history
+6.4%/yrLatest (2025): $2,922 · +10.0% YoY. Source: county tax records.
Cash-flow waterfall
monthlySold comps — $/sqft
last 12 mo · ≤1 miLoading sold comps…