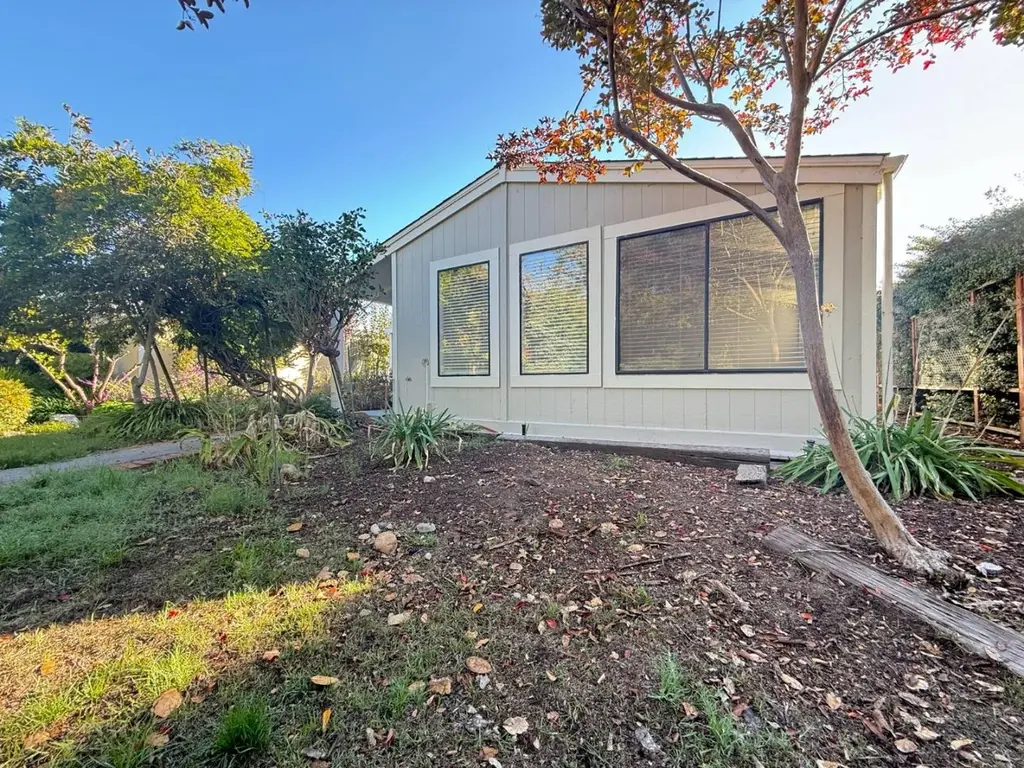
56 Guadalajara Dr #56 · Sonoma, CA
Flood risk 4/10 · Minor
- FEMA flood zone
- X (unshaded)
- Chance of flooding over 30 yrs
- 0.23%
- Est. flood insurance / yr
- $507 – $1,088
Fire risk 6/10 · Moderate
- Est. fire insurance / yr
- $659 – $1,223
Heat risk 4/10 · Minor
- Hot days now (above 95°F)
- 7 days/yr
- Hot days in 30 yrs
- 15 days/yr
Wind risk 1/10 · Minimal
- Chance of severe wind over 30 yrs
- —
Air-quality risk 9/10 · Severe
- Unhealthy air days now
- 19 days/yr
- Unhealthy air days in 30 yrs
- 19 days/yr
Risk factors via First Street. Map © Google.
Why this score? — see what drove the C grade
The composite is a weighted blend of 9 inputs, each scored 0–100. Each bar is that input's sub-score; the figure is the points it added to the 100-point composite (weight × sub-score).
- Cash flow +27.9/30.0
- DSCR +9.9/10.0
- 1% rule +7.7/10.0
- Condition / age +3.8/5.0
- Livability +3.7/5.0
- Schools +3.4/10.0
- Rent growth +2.7/5.0
- ARV discount +0.0/15.0
- Appreciation +0.0/10.0
$269,900
🖨 Deal sheet 📄 Offer letter ✓ Due diligence
Listing remarks MLS
Welcome to your new home in the peaceful senior, 55+, community of Pueblo Serena Mobile Home Park! This well-maintained 1973 mobile home offers 2 spacious bedrooms and 2 full bathrooms, perfect for comfortable living and entertaining. Step into a large, inviting living room filled with natural light, ideal for relaxing or hosting guests. The kitchen is fully equipped with a refrigerator, microwave, dishwasher, and a stove/oven, making meal prep a breeze. Both bedrooms are generously sized, and the bathrooms offer ample space and convenience. Whether you're downsizing, starting fresh, or just looking for a great place to call home, this one has the space and layout to fit your lifestyle.
Key facts
- Built 1973
- Listed 111 days
Neighborhood map
What this means for you Summary
Snapshot
- This is a 2-bed/2.0-bath manufactured listed at $270k. Condition is rated good.
Deal economics
- At list price, monthly cash flow is $834 ($10k/yr) — positive.
- The deal already cash-flows at list — no discount required.
- Meets the 1% rule at list price ($3k rent vs $270k).
- Recommended offer: $246k (9.0% below list) — sets the bar for market timing.
- Cap rate 10.0% vs local median 1.4% in Sonoma — top-decile yield for the area; either an underpriced asset or a hidden risk that comps aren't pricing in. Stress-test before assuming the spread holds.
Location & tenants
- Location reads 74/100 on livability (#146 in CA, #4,943 nationally) — a middle-class / working-renter tenant base. Strengths: amenities A+, employment A+, health & safety A+; Watch: commute F, cost of living F.
- Sonoma Valley Unified (town): math 27% / reading 42% proficiency, ranked #849 of 1,400 in CA (top 61%) — families likely to look elsewhere, expect single-tenant / working-renter base with shorter leases.
- Market conditions: Rents flat; 263 active listings in the ZIP; 17 comparable units currently listed for rent nearby; rentals at typical pace (median 21d on market — plan ~3-4 weeks tenant-placement turnaround); solid renter incomes; 1,039 units permitted in Sonoma County in 2024 (185 in 5+ unit buildings).
- This rent runs 39% of the median local income ($105k/yr) — at the standard rent-burdened threshold; future hikes will face affordability resistance.
Forward outlook
- Local home prices are declining (-3.0%/yr); year-one equity from $2k of loan paydown is wiped out by about $8k of value loss. Plan a longer hold.
- Sonoma County population projected at +8% by 2050 — modest demand growth; plan on rents tracking national, not racing it.
Negotiation context
- It's been on market 111 days — a 9% lower offer ($246k) is reasonable based on typical stale-listing flexibility.
- 3 sale attempts with the ask held roughly flat each time — persistent listings suggest the price (not the market) is what's stuck; bring a comps-based counter.
Risks & watch-outs
- Climate carrying-cost: major wildfire risk — expect insurance premiums to compound above CPI over the hold.
Questions for the listing agent
- It's been on market 111 days. Have you received any prior offers? Is the seller open to a 9% concession, seller financing, or rate buy-down credit?
- Built in 1973 — when were the roof, HVAC, electrical panel, plumbing, and water heater last replaced?
- Why hasn't it sold? Are there any deal-killer items the seller is aware of (foundation, flood, title, zoning, code violations)?
- Is there a deadline driving the sale (1031 exchange, divorce, estate, relocation)? That informs how much negotiation room exists.
- What's the average days-on-market for RENTAL listings here right now (not sales)? A rising rental-DOM trend means longer vacancies and softer asking-rent achievability than the comps imply.
- What's the recent tenant-quality profile in this submarket — average credit score on applications, eviction rate, late-payment / NSF rate, and stable-employment percentage? A property-management company in the area should have these aggregated.
- How much new for-sale + rental construction is in the pipeline within 1–3 miles? Heavy new supply typically softens prices + rents 12–24 months out; constrained supply supports both.
Investment metrics
- 1% rule
- 1.27% ✓
- Cap rate
- 10.00%
- Cash-on-cash
- 13.25%
- DSCR
- 1.59
- GRM
- 6.6
CMA / ARV
- ARV (median comp)
- $193,028
- List price
- $269,900
- Delta
- 39.82%
- Verdict
- OVERPRICED
- Comps
- 10 within 1.0 mi
Show comp detail 7 sales within ~0.75 mi
| Address | Dist | Beds/Ba | Sqft | Sold | Price | $/sf | Match |
|---|---|---|---|---|---|---|---|
| 109 Merida Dr | 0.17mi | 3/2.0 (+1) | 1,440 (0%) | 3mo | $250,000 | $174 | 85 |
| 118 Pepito Dr | 0.18mi | 2/2.0 | 1,440 (0%) | 10mo | $235,000 | $163 | 84 |
| 74 Guaymas Dr | 0.08mi | 3/2.0 (+1) | 1,470 (+2%) | 9mo | $267,500 | $182 | 80 |
| 6 Chico Dr | 0.17mi | 2/2.0 | 1,500 (+4%) | 21mo | $240,000 | $160 | 68 |
| 102 Hermosillo Dr | 0.12mi | 2/2.0 | 1,344 (-7%) | 20mo | $339,000 | $252 | 67 |
| 220 Cazares Cir | 0.21mi | 2/2.0 | 1,490 (+4%) | 23mo | $300,000 | $201 | 66 |
| 34 Mazatlan Dr | 0.07mi | 3/2.0 (+1) | 1,344 (-7%) | 20mo | $339,000 | $252 | 64 |
Match score weights: distance 35% · size 25% · config 20% · recency 20%. Top-matched comps best support the ARV.
Projected returns pro-forma
-3.0% appreciation · 0.79% rent growth · sell at horizon
- IRR
- 0.7%
- Equity multiple
- 1.03×
- Total profit
- $2,019
- Equity at exit
- $40,243
- IRR
- 8.0%
- Equity multiple
- 1.55×
- Total profit
- $41,205
- Equity at exit
- $23,336
Cash invested: $75,572 (down + closing). Projections, not guarantees.
Landlord ↔ Tenant lean methodology
- Overall (STATE)
- 18 Strongly Tenant-Friendly
- State California
- 18 Strongly Tenant-Friendly · D+13
- County
- — inherits STATE
- City
- — inherits STATE
ZIP-level market 95476
- Rents YoY
- 0.8%
- Active inventory
- 263
- Price-to-rent
- 6.6×
Monthly cashflow live
- Estimated rent
- $3,417 high interval (Pro) →
- Mortgage (P&I)
- −$1,415
- Tax est. 1.5%
- −$337 /mo · $4,048/yr
- Insurance
- −$112
- HOA
- −$0
- Vacancy / Maint / Mgmt
- −$718
- Net cashflow
- $834
Break-even live
UW: 25.0% down · 7.5% · 30yr · 1.5% tax · 5.0% vac · 8.0% maint · 8.0% mgmt
Financing live
Cash to close
- Down payment
- $67,475
- Closing costs
- $8,097
- Reserves months
- —
- Total cash needed
- —
Loan-product check · same deal, 3 products live
Conventional
25% down · 7.5% · 30yr
- Down + closing
- —
- Monthly P&I
- —
- Monthly cashflow
- —
- DSCR
- —
- Eligible?
- —
Personal DTI + credit; lowest rate.
DSCR
20% down · 8.5% · 30yr
- Down + closing
- —
- Monthly P&I
- —
- Monthly cashflow
- —
- DSCR
- —
- Eligible?
- —
No personal income docs; deal must DSCR.
Hard money
10% down · 12.0% · 12mo
- Down + closing
- —
- Monthly P&I
- —
- Monthly cashflow
- —
- DSCR
- —
- Eligible?
- —
Short-term bridge; refi at stabilization.
Rent comps 17 comps
| Address | Beds | Baths | Sqft | Rent | $/sqft | DOM | Units | Dist |
|---|---|---|---|---|---|---|---|---|
| 751 Juniper Ct Sonoma, CA | 2.0 | 2.0 | 1550 | $3,900 | $2.52 | 43d | 1 | 0.15mi |
| 655 W Spain St Sonoma, CA | 2.0 | 2.5 | 1349 | $3,525 | $2.61 | 13d | 1 | 0.51mi |
| 434 Bernice Ln Unit 1546207P Sonoma, CA | 2.0 | 2.0 | 979 | $4,564 | $4.66 | 13d | 1 | 0.53mi |
| 790 2nd St W Sonoma, CA | 1.0–2.0 | 1.0–1.5 | 975 | $2,660 | $2.73 | 13d | 3 | 0.64mi |
| 340 Church St Sonoma, CA | 3.0 | 2.5 | 1282 | $3,750 | $2.93 | 43d | 1 | 0.67mi |
| 663 Spring Ln Sonoma, CA | 2.0 | 1.0 | 1050 | $3,200 | $3.05 | 43d | 1 | 0.70mi |
| 210 Tuscany Pl Sonoma, CA | 1.0–2.0 | 1.0–2.0 | 1200 | $2,750 | $2.29 | 13d | 1 | 0.73mi |
| 208 Todd Ave Sonoma, CA | 3.0 | 2.5 | 1384 | $3,800 | $2.75 | 13d | 1 | 0.82mi |
| 21 Ramon St Sonoma, CA | 2.0 | 2.0 | 1440 | $2,250 | $1.56 | 23d | 1 | 0.83mi |
| 1211 Broadway Unit 1213 Sonoma, CA | 2.0 | 2.5 | 1200 | $3,600 | $3.00 | 23d | 1 | 0.86mi |
| 1207 Broadway Sonoma, CA | 2.0 | 2.5 | 1200 | $3,600 | $3.00 | 23d | 1 | 0.87mi |
| 1207 Broadway Unit 1209 Sonoma, CA | 2.0 | 2.5 | 1200 | $3,750 | $3.12 | 43d | 1 | 0.87mi |
| 19019 5th St W Sonoma, CA | 3.0 | 2.0 | 1286 | $3,400 | $2.64 | 13d | 1 | 1.03mi |
| 336 Las Casitas Ct Sonoma, CA | 2.0 | 1.5 | 1158 | $2,500 | $2.16 | 43d | 1 | 1.26mi |
| 126 Blue Wing Dr Sonoma, CA | 2.0 | 2.0 | 1156 | $2,975 | $2.57 | 13d | 2 | 1.27mi |
| 126 Blue Wing Dr #11 Sonoma, CA | 2.0 | 2.0 | 1156 | $3,200 | $2.77 | 13d | 1 | 1.28mi |
| 492 Chase St Sonoma, CA | 3.0 | 2.0 | 1694 | $4,750 | $2.80 | 21d | 1 | 1.32mi |
Listing history 20 events
-
2026-06-18days on market $269,900 Active 111 DOM
-
2026-06-17days on market $269,900 Active 110 DOM
-
2026-06-16days on market $269,900 Active 109 DOM
-
2026-06-15days on market $269,900 Active 108 DOM
-
2026-06-14days on market $269,900 Active 106 DOM
-
2026-06-13days on market $269,900 Active 105 DOM
-
2026-06-10days on market $269,900 Active 103 DOM
-
2026-06-09days on market $269,900 Active 102 DOM
-
2026-06-08days on market $269,900 Active 101 DOM
-
2026-06-07days on market $269,900 Active 100 DOM
-
2026-06-05days on market $269,900 Active 97 DOM
-
2026-06-03days on market $269,900 Active 96 DOM
-
2026-06-02days on market $269,900 Active 95 DOM
-
2026-06-01days on market $269,900 Active 94 DOM
-
2026-05-31days on market $269,900 Active 93 DOM
-
2026-05-30days on market $269,900 Active 92 DOM
-
2026-02-27$269,900 Active 695-char remark
Show marketing remark (695 chars)
Welcome to your new home in the peaceful senior, 55+, community of Pueblo Serena Mobile Home Park! This well-maintained 1973 mobile home offers 2 spacious bedrooms and 2 full bathrooms, perfect for comfortable living and entertaining. Step into a large, inviting living room filled with natural light, ideal for relaxing or hosting guests. The kitchen is fully equipped with a refrigerator, microwave, dishwasher, and a stove/oven, making meal prep a breeze. Both bedrooms are generously sized, and the bathrooms offer ample space and convenience. Whether you're downsizing, starting fresh, or just looking for a great place to call home, this one has the space and layout to fit your lifestyle.
-
2025-09-02historical
-
2025-04-22Active
ⓘ Source: listings_history table (triggers on properties + properties_extension) + one-shot
backfill from property_details.listing_events for pre-trigger history.
Climate risk First Street
- Flood 4/10 Moderate FEMA zone X (unshaded) · 23% chance over 30 yrs
- Wildfire 6/10 Major
- Heat 4/10 Moderate 7 d/yr ≥95°F today · 15 d/yr by 30 yrs out
- Wind 1/10 Low
- Air quality 9/10 Extreme 19 unhealthy d/yr today · 19 by 30 yrs out
Nearby sold comps map
Loading sold comps map…
Walkable amenities ~0.75 mi
Loading nearby amenities…
Taxation est. · year 1
- Rental income
- $41,005
- − Mortgage interest
- −$15,119
- − Property taxes
- −$4,048
- − Insurance
- −$1,350
- − Repairs & maintenance
- −$3,280
- − Management
- −$3,280
- − Depreciation
- −$7,852
- Taxable income
- $6,076
- Est. tax owed @ 24.0%
- −$1,458
- After-tax cash flow
- $8,553/yr
For passive investors: Depreciation is non-cash, so a rental often shows a tax loss while cash-flowing — sheltering income. Rental losses are passive: they offset passive income freely, and up to $25,000/yr can offset ordinary (W-2) income if you actively participate and your MAGI is under $100k (phasing out to $0 by $150k); unused losses carry forward. On sale, claimed depreciation is recaptured at up to 25%, and gains may owe capital-gains tax (a 1031 exchange can defer both). Figures are a year-1 estimate at your 24.0% rate — not tax advice; consult a CPA.
Condition & rehab AI · 12 photos
This well-maintained 1973 mobile home in a peaceful senior community offers a good starting point for potential buyers or renters. With some cosmetic updates and improvements, it can be transformed into a move-in-ready property with increased value.
Value-add opportunities
- Both Painting the exterior and interior walls — Fresh paint can enhance the home's curb appeal and interior aesthetics.
- Both Landscaping improvements — A well-maintained yard can increase both resale and rental value.
- Both HVAC inspection and maintenance — A functional HVAC system is essential for comfort and energy efficiency.
- Both Kitchen updates (new countertops, appliances) — Modernizing the kitchen can significantly increase the home's value and appeal to potential buyers/renters.
Renovation cost estimate screening
Value-add ROI direction
- Both Painting the exterior and interior walls — Fresh paint can enhance the home's curb appeal and interior aesthetics. ↑
- Both Landscaping improvements — A well-maintained yard can increase both resale and rental value. ↑
- Both HVAC inspection and maintenance — A functional HVAC system is essential for comfort and energy efficiency. ↑
- Both Kitchen updates (new countertops, appliances) — Modernizing the kitchen can significantly increase the home's value and appeal to potential buyers/renters. ↑
ⓘ Cost ranges are severity-bucket heuristics (US national rule-of-thumb). Get contractor quotes + a written scope before underwriting a rehab budget.
Schools (NCES district)
- District
- Sonoma Valley Unified
- NCES district ID
- 0637200
- Math proficiency
- 27% ▼ -1.00%
- Reading proficiency
- 42% ▲ 1.00%
- Median HH income
- $63,880
- Composite
- 33.88/100
- National rank
- #10355
- State rank
- #849 of 1400 in CA
Livability — Sonoma
- Score
- 74/100
- State rank
- #146
- US rank
- #4943
Category grades
Schools grade is shown separately in the Schools card above.
Census & demographics
- Census place
- Sonoma, CA
- County
- Sonoma County · 449,805 people
- City population
- 35,196
- Metro
- Santa Rosa-Petaluma, CA
- Population (ZIP)
- 35,196
- Household income
- $105,374
- Rent vs Own
- Severe rent burden
- 1218.0
Population outlook (Sonoma County) Hauer SSP2
- Today (2025)
- 539,935 people
- By 2030
- 554,870 · +2.8%
- By 2040
- 573,262 · +6.2%
- By 2050
- 580,715 · +7.6%
- By 2075
- 579,229 · +7.3%
- By 2100
- 547,835 · +1.5%
Race, ethnicity, and origin ACS 2023
- Neighborhood character
- Predominantly White (66%)
- Race & ethnicity
- White 66% Hispanic / Latino 28% Two or more races 13% Asian 2% Black 1%
- Hispanic origin (detail)
- Mexican 23%
- Common ancestry
- Italian 5% Lithuanian 4% Portuguese 3%
- Foreign-born
- 16% · Canada, Dominican Republic
- Languages at home
- 75% English-only · Spanish 21% Other Indo-European 1% Other Asian/Pacific 0%
Political lean MEDSL · Sonoma
- 2024 margin
- Solid D (+46.2) · D 71.4% · R 25.2% · Other 3.3%
- 2008→2024 swing
- -3.4pp toward R · 2008: 49.6pp · 2024: 46.2pp
- All cycles
- 2024: D+46.2 2020: D+51.5 2016: D+47.9 2012: D+44.9 2008: D+49.6
Not yet ingested
- Civics
- —
Market trends
- HPI YoY
- ▼ -1116.03%
- Current HPI
- 236.6408
- Rent YoY
- ▲ 0.79%
- Metro
- Santa Rosa-Petaluma, CA
- State GDP YoY
- ▲ 3.21%
- F500 in state
- 116
Industry mix (Fortune 500 HQ in CA)
| Industry | F500 HQs | Revenue |
|---|---|---|
| Technology | 27 | $1,492B |
|
||
| Financial Services | 3 | $174B |
|
||
| Retail | 3 | $44B |
|
||
| Insurance | 3 | $26B |
|
||
| Media / Entertainment | 2 | $115B |
|
||
| Pharmaceuticals / Biotech | 2 | $62B |
|
||
Price history
+0.0% since first listed4 events — show timeline
- 2026-02-27 Listed $269,900 MLSListings
- 2026-02-27 Listed $269,900 bridgeMLS, Bay East AOR, or Contra Costa AOR
- 2025-09-02 Listing Removed — bridgeMLS, Bay East AOR, or Contra Costa AOR
- 2025-04-22 Listed — bridgeMLS, Bay East AOR, or Contra Costa AOR
Cash-flow waterfall
monthlySold comps — $/sqft
last 12 mo · ≤1 miLoading sold comps…