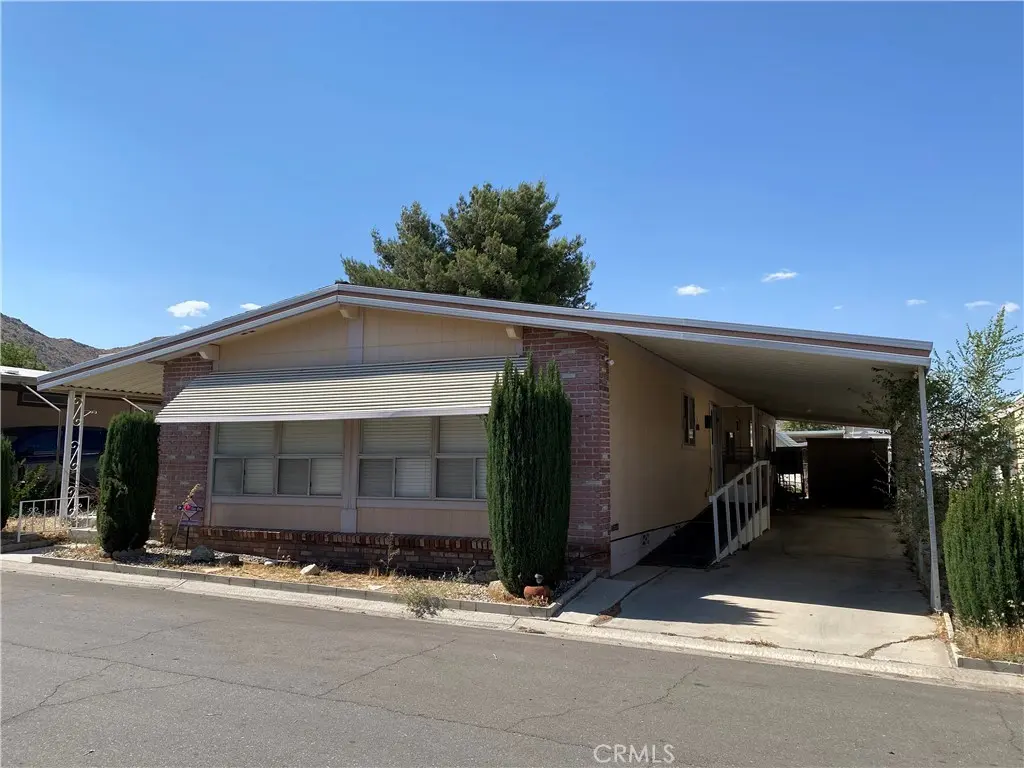
20683 Waalew Rd Unit B161 · Apple Valley, CA
Flood risk 1/10 · Minimal
- FEMA flood zone
- X (unshaded)
- Chance of flooding over 30 yrs
- 0.0%
- Est. flood insurance / yr
- $507 – $1,088
Fire risk 6/10 · Moderate
- Est. fire insurance / yr
- $659 – $1,223
Heat risk 7/10 · Major
- Hot days now (above 100°F)
- 1 days/yr
- Hot days in 30 yrs
- 2 days/yr
Wind risk 1/10 · Minimal
- Chance of severe wind over 30 yrs
- —
Air-quality risk 9/10 · Severe
- Unhealthy air days now
- 21 days/yr
- Unhealthy air days in 30 yrs
- 26 days/yr
Risk factors via First Street. Map © Google.
Why this score? — see what drove the C+ grade
The composite is a weighted blend of 9 inputs, each scored 0–100. Each bar is that input's sub-score; the figure is the points it added to the 100-point composite (weight × sub-score).
- Cash flow +30.0/30.0
- DSCR +10.0/10.0
- 1% rule +8.6/10.0
- Rent growth +3.9/5.0
- Schools +3.1/10.0
- Livability +3.1/5.0
- Condition / age +2.5/5.0
- ARV discount +0.7/15.0
- Appreciation +0.0/10.0
$125,000
🖨 Deal sheet (PDF) 📄 Offer letter ✓ Due diligence
Listing remarks
Welcome To Your Oasis, Located Across From The Lake And Pool In The Desirable Los Ranchos Mobile Home Park In Apple Valley. This Spacious 2-Bedroom, 2-Bath Home Offers Approximately 1,488 Square Feet Of Comfortable Living Space, Blending Generous Room Sizes With A Relaxed Lifestyle That Makes High Desert Living So Appealing. As You Arrive, You'll Appreciate Convenient Covered Parking. Step Inside And Discover A Bright, Open Floor Plan Designed For Both Everyday Comfort And Easy Entertaining. The Expansive Living Room And Family Room Provides The Perfect Setting For Relaxing Evenings, Holiday Gatherings, Or Simply Enjoying Time With Family And Friends. Large Windows Invite Natural Light Thro
Key facts
- 3,542 sq ft lot
- 2 parking spots
- Community pool
Property features AI
Finance
- Other: Park name: Los Ranchos; Manager approval required for park residency; Two pads in the multi-unit setup; Pets allowed; Rent includes gas, electric, water, sewer, trash, pool and all utilities (when rented)
- Financial info: Land lease of $1,000 per month (seller source); land lease applies
- HOA & community: Part of Los Ranchos association; Association amenities include pool, clubhouse, gym/exercise room, onsite property management, maintenance of grounds, trash, water, sewer, electricity, gas; pets permitted (call for rules)
Exterior
- Parking: Two covered carport spaces (tandem/attached); Driveway parking (concrete); Additional parking spaces; RV potential; Guest parking by community center
- Security: Smoke detector and fire/smoke detection system; Carbon monoxide detectors; Resident manager on site
- Utilities: Public/district water; Public sewer; Standard electric service; Natural gas connected; Electricity and sewer connected; Water connected
- Home design: Double-wide mobile home (77 model); One story; No interior steps; ramp at main level; 2+ access exits; Entry at level 1
- Construction: Shingle roof; Wood and brick construction; Brick & mortar perimeter skirt; Permanent foundation with pillar/post/pier
- Exterior features: Covered front porch and patio; Patio; Covered exterior areas; In-ground community pool (fenced); Shed on property; Lot is level with street and paved; Lot shape is rectangular; Close to clubhouse; Lot has lake rights and beach access; fishing in community; lot across the road from lake/ocean; Has view
Interior
- Kitchen: Kitchen open to family room; Convection oven; Gas cooktop; Electric oven; Range/stove hood; Dishwasher; Garbage disposal; Pots & pan drawers
- Bedrooms: Primary bedroom on main floor; All bedrooms on main floor; Primary suite
- Flooring: Vinyl flooring; Carpet
- Bathrooms: Two full bathrooms; Main floor full bath; Soaking tub; Separate tub and walk-in shower; Double sinks in primary bath; Exhaust fan(s); Linen closet/storage
- Heating & cooling: Central cooling; Central furnace heating
- Interior features: Open floor plan; Built-in storage; Ceiling fan; Wood product walls; Laminate counters; Mirrored closet doors; Blinds; Storage space
- Laundry & utility: Laundry inside in individual room; Washer included; Dryer included; Washer hookup; Electric dryer hookup
Neighborhood map
What this means for you Summary
Snapshot
- This is a 2-bed/2.0-bath manufactured listed at $125k.
Deal economics
- At list price, monthly cash flow is $610 ($7k/yr) — positive.
- The deal already cash-flows at list — no discount required.
- Meets the 1% rule at list price ($2k rent vs $125k).
- Cap rate 12.1% vs local median 3.5% in Apple Valley — top-decile yield for the area; either an underpriced asset or a hidden risk that comps aren't pricing in. Stress-test before assuming the spread holds.
Location & tenants
- Location reads 61/100 on livability (#532 in CA) — a middle-class / working-renter tenant base. Strengths: housing A+, commute B+; Watch: employment D+, crime D-, amenities F.
- Apple Valley Unified (suburban): math 25% / reading 40% proficiency, ranked #955 of 1,400 in CA (top 68%) — families likely to look elsewhere, expect single-tenant / working-renter base with shorter leases; 60% free/reduced lunch — lower-income household profile, screen leases tightly.
- Zoned schools: Vanguard Preparatory (1,135 students, 69% FRL); Granite Hills High (1,759 students, 71% FRL).
- Market conditions: Rents rising fast (+5.5%/yr); 537 active listings in the ZIP; 4 comparable units currently listed for rent nearby; rentals lingering (median 46d on market — plan ~5-8 weeks vacancy on turnover, expect pricing pressure); 50% of comp listings sitting > 30 days — soft ceiling on asking rent; solid renter incomes; 5,458 units permitted in San Bernardino County in 2024 (1,500 in 5+ unit buildings).
Forward outlook
- Local home prices are declining (-3.0%/yr); year-one equity from $864 of loan paydown is wiped out by about $4k of value loss. Plan a longer hold.
- San Bernardino County population projected at +15% by 2050 — modest demand growth; plan on rents tracking national, not racing it.
- At projected returns (-3.0% appreciation + 5.5% rent growth), your $35k cash investment doubles in ~6 years — after that, you're playing with house money.
Negotiation context
- Only 8 days on market — expect competitive offers; lowballing is unlikely to land.
Risks & watch-outs
- Climate carrying-cost: major wildfire risk; extreme-heat days projected 1→2/yr by 2055 (HVAC capex compounding) — expect insurance premiums to compound above CPI over the hold.
Questions for the listing agent
- Built in 1977 — when were the roof, HVAC, electrical panel, plumbing, and water heater last replaced?
- Is there a deadline driving the sale (1031 exchange, divorce, estate, relocation)? That informs how much negotiation room exists.
- Schools are F-rated, which usually means shorter tenancies and higher turnover. Who's the typical renter profile here, and what's been the actual vacancy rate?
- Crime grade is D in this area — have there been break-ins, vandalism, or insurance claims at this property in the last 3 years? What carrier currently insures it and at what premium?
- What's the average days-on-market for RENTAL listings here right now (not sales)? A rising rental-DOM trend means longer vacancies and softer asking-rent achievability than the comps imply.
- What's the recent tenant-quality profile in this submarket — average credit score on applications, eviction rate, late-payment / NSF rate, and stable-employment percentage? A property-management company in the area should have these aggregated.
- How much new for-sale + rental construction is in the pipeline within 1–3 miles? Heavy new supply typically softens prices + rents 12–24 months out; constrained supply supports both.
Investment metrics
- 1% rule
- 1.36% ✓
- Cap rate
- 12.15%
- Cash-on-cash
- 20.91%
- DSCR
- 1.93
- GRM
- 6.1
CMA / ARV
- ARV (on-the-fly)
- $108,624
- Comps found
- 12
Show comp detail 12 sales within ~0.75 mi
| Address | Dist | Beds/Ba | Sqft | Sold | Price | $/sf | Match |
|---|---|---|---|---|---|---|---|
| 20683 Waalew Rd Unit B169 | 0.00mi | 2/2.0 | 1,520 (+2%) | 0mo | $108,000 | $71 | 96 |
| 20683 Waalew Rd Unit B2 | 0.09mi | 2/2.0 | 1,488 (0%) | 9mo | $65,000 | $44 | 88 |
| 20683 Waalew SPC B54 Rd Unit B54 | 0.00mi | 3/2.0 (+1) | 1,440 (-3%) | 9mo | $130,600 | $91 | 82 |
| 20843 WAALEW Rd Unit C48 | 0.27mi | 3/2.0 (+1) | 1,512 (+2%) | 4mo | $135,000 | $89 | 76 |
| 20843 Waalew Rd Unit C83 | 0.35mi | 3/2.0 (+1) | 1,512 (+2%) | 3mo | $92,000 | $61 | 74 |
| 20683 Waalew Rd Unit B4 | 0.00mi | 3/2.0 (+1) | 1,608 (+8%) | 10mo | $67,500 | $42 | 73 |
| 20843 Waalew Rd Unit C80 | 0.35mi | 3/2.0 (+1) | 1,512 (+2%) | 9mo | $140,000 | $93 | 69 |
| 20843 Waalew Rd Unit C116 | 0.35mi | 3/2.0 (+1) | 1,529 (+3%) | 9mo | $160,000 | $105 | 66 |
| 20843 Waalew Rd #C136 | 0.35mi | 3/2.0 (+1) | 1,593 (+7%) | 2mo | $110,710 | $69 | 66 |
| 20843 Waalew Rd Unit C60 | 0.35mi | 3/2.0 (+1) | 1,549 (+4%) | 9mo | $120,000 | $77 | 64 |
| 20843 Waalew Unit C34 | 0.35mi | 3/2.0 (+1) | 1,680 (+13%) | 0mo | $45,000 | $27 | 57 |
| 20843 Waalew Rd Unit C44 | 0.35mi | 3/2.0 (+1) | 1,296 (-13%) | 8mo | $95,000 | $73 | 50 |
Match score weights: distance 35% · size 25% · config 20% · recency 20%. Top-matched comps best support the ARV.
Projected returns pro-forma
-3.0% appreciation · 5.48% rent growth · sell at horizon
- IRR
- 15.8%
- Equity multiple
- 1.65×
- Total profit
- $22,859
- Equity at exit
- $18,638
- IRR
- 26.0%
- Equity multiple
- 3.53×
- Total profit
- $88,390
- Equity at exit
- $10,808
Cash invested: $35,000 (down + closing). Projections, not guarantees.
Landlord ↔ Tenant lean methodology
- Overall (STATE)
- 18 Strongly Tenant-Friendly
- State California
- 18 Strongly Tenant-Friendly · D+13
- County
- — inherits STATE
- City
- — inherits STATE
ZIP-level market 92307
- Rents YoY
- 5.5%
- Active inventory
- 537
- Price-to-rent
- 6.1×
Monthly cashflow live
- Estimated rent
- $1,694 medium interval (Pro) →
- Mortgage (P&I)
- −$656
- Tax from tax record
- −$21 /mo · $253/yr
- Insurance
- −$52
- HOA
- −$0
- Vacancy / Maint / Mgmt
- −$356
- Net cashflow
- $610
Break-even live
Sensitivity live
| Price | -10% $681 | -5% $645 | +0% $610 | +5% $431 | +10% $388 |
|---|---|---|---|---|---|
| Rent | -10% $476 | -5% $543 | +0% $610 | +5% $677 | +10% $744 |
| Rate | -1.0pp $673 | -0.5pp $642 | base $610 | +0.5pp $577 | +1.0pp $544 |
UW: 25.0% down · 7.5% · 30yr · 1.5% tax · 5.0% vac · 8.0% maint · 8.0% mgmt
Financing live
Cash to close
- Down payment
- $31,250
- Closing costs
- $3,750
- Reserves months
- —
- Total cash needed
- —
Loan-product check · same deal, 3 products live
Conventional
25% down · 7.5% · 30yr
- Down + closing
- —
- Monthly P&I
- —
- Monthly cashflow
- —
- DSCR
- —
- Eligible?
- —
Personal DTI + credit; lowest rate.
DSCR
20% down · 8.5% · 30yr
- Down + closing
- —
- Monthly P&I
- —
- Monthly cashflow
- —
- DSCR
- —
- Eligible?
- —
No personal income docs; deal must DSCR.
Hard money
10% down · 12.0% · 12mo
- Down + closing
- —
- Monthly P&I
- —
- Monthly cashflow
- —
- DSCR
- —
- Eligible?
- —
Short-term bridge; refi at stabilization.
Rent comps 4 comps
| Address | Beds | Baths | Sqft | Rent | $/sqft | DOM | Units | Dist |
|---|---|---|---|---|---|---|---|---|
| 21225 Wigwam Rd Unit 2 Apple Valley, CA | 2.0 | 1.0 | 934 | $1,200 | $1.28 | 45d | 1 | 1.02mi |
| 15866 Sago Rd Apple Valley, CA | 2.0 | 2.0 | 996 | $1,750 | $1.76 | 26d | 1 | 1.12mi |
| 15728 Sago Rd Unit 1 Apple Valley, CA | 2.0 | 2.0 | 950 | $1,600 | $1.68 | 26d | 1 | 1.26mi |
| 20414 Zuni Rd Unit 1 Apple Valley, CA | 3.0 | 2.0 | 1250 | $1,700 | $1.36 | 45d | 1 | 1.30mi |
Listing history 7 events
-
2026-06-21days on market $125,000 Active 8 DOM
-
2026-06-18days on market $125,000 Active 5 DOM
-
2026-06-17days on market $125,000 Active 4 DOM
-
2026-06-16days on market $125,000 Active 3 DOM
-
2026-06-15days on market $125,000 Active 2 DOM
-
2026-06-13remarks 699-char remark
-
2026-06-13$125,000 Active 1 DOM
ⓘ Source: listings_history table (triggers on properties + properties_extension) + one-shot
backfill from property_details.listing_events for pre-trigger history.
Tax reassessment forecast CA · Resets to sale price
- Current annual tax
- $253 · $21/mo
- Projected year-2 tax
- $950 · $79/mo
- Expected delta
- +$697/yr (+$58/mo · 274.9%)
ⓘ Screening estimate from a state-policy table — verify with the county assessor before closing.
Climate risk First Street
- Flood 1/10 Low FEMA zone X (unshaded) · 0% chance over 30 yrs
- Wildfire 6/10 Major
- Heat 7/10 Severe 1 d/yr ≥100°F today · 2 d/yr by 30 yrs out
- Wind 1/10 Low
- Air quality 9/10 Extreme 21 unhealthy d/yr today · 26 by 30 yrs out
Nearby sold comps map
Loading sold comps map…
Walkable amenities ~0.75 mi
Loading nearby amenities…
Taxation est. · year 1
- Rental income
- $20,332
- − Mortgage interest
- −$7,002
- − Property taxes
- −$253
- − Insurance
- −$625
- − Repairs & maintenance
- −$1,627
- − Management
- −$1,627
- − Depreciation
- −$3,636
- Taxable income
- $5,562
- Est. tax owed @ 24.0%
- −$1,335
- After-tax cash flow
- $5,983/yr
For passive investors: Depreciation is non-cash, so a rental often shows a tax loss while cash-flowing — sheltering income. Rental losses are passive: they offset passive income freely, and up to $25,000/yr can offset ordinary (W-2) income if you actively participate and your MAGI is under $100k (phasing out to $0 by $150k); unused losses carry forward. On sale, claimed depreciation is recaptured at up to 25%, and gains may owe capital-gains tax (a 1031 exchange can defer both). Figures are a year-1 estimate at your 24.0% rate — not tax advice; consult a CPA.
Schools (NCES district)
- District
- Apple Valley Unified
- NCES district ID
- 0600017
- Math proficiency
- 25% ▬ 0.00%
- Reading proficiency
- 40% ▬ 0.00%
- Median HH income
- $49,264
- Composite
- 30.91/100
- National rank
- #11351
- State rank
- #955 of 1400 in CA
Livability — Apple Valley
- Score
- 61/100
- State rank
- #532
- US rank
- #17800
Category grades
Schools grade is shown separately in the Schools card above.
Census & demographics
- Census place
- Apple Valley, CA
- County
- San Bernardino County · 2,030,291 people
- City population
- 83,889
- Metro
- Riverside-San Bernardino-Ontario, CA
- Population (ZIP)
- 41,180
- Household income
- $77,106
- Rent vs Own
- Severe rent burden
- 1069.0
Population outlook (San Bernardino County) Hauer SSP2
- Today (2025)
- 2,300,329 people
- By 2030
- 2,378,907 · +3.4%
- By 2040
- 2,523,137 · +9.7%
- By 2050
- 2,642,388 · +14.9%
- By 2075
- 2,880,769 · +25.2%
- By 2100
- 2,909,436 · +26.5%
Race, ethnicity, and origin ACS 2023
- Neighborhood character
- Diverse neighborhood (Simpson 0.63)
- Race & ethnicity
- White 47% Hispanic / Latino 38% Two or more races 22% Black 5% Asian 3% Native American 2%
- Hispanic origin (detail)
- Mexican 34% Puerto Rican 1%
- Common ancestry
- Lithuanian 3% Italian 3% Slovak 2%
- Foreign-born
- 10% · Canada, China
- Languages at home
- 75% English-only · Spanish 20% Arabic 1% Other Indo-European 1%
Political lean MEDSL · San Bernardino
- 2024 margin
- Toss-up / Even · D 47.5% · R 49.7% · Other 2.8%
- 2008→2024 swing
- -8.5pp toward R · 2008: 6.3pp · 2024: -2.1pp
- All cycles
- 2024: R+2.1 2020: D+10.7 2016: D+9.8 2012: D+5.4 2008: D+6.3
Not yet ingested
- Civics
- —
Market trends
- HPI YoY
- ▼ -262.21%
- Current HPI
- 347.8498
- Rent YoY
- ▲ 5.48%
- Metro
- Riverside-San Bernardino-Ontario, CA
- State GDP YoY
- ▲ 3.21%
- F500 in state
- 116
Industry mix (Fortune 500 HQ in CA)
| Industry | F500 HQs | Revenue |
|---|---|---|
| Technology | 27 | $1,492B |
|
||
| Financial Services | 3 | $174B |
|
||
| Retail | 3 | $44B |
|
||
| Insurance | 3 | $26B |
|
||
| Media / Entertainment | 2 | $115B |
|
||
| Pharmaceuticals / Biotech | 2 | $62B |
|
||
Price history
1 event — show timeline
- 2026-06-13 Listed $125,000 CRMLS
Property tax history
-0.6%/yrLatest (2025): $253 · +1.6% YoY. Source: county tax records.
Cash-flow waterfall
monthlySold comps — $/sqft
last 12 mo · ≤1 miLoading sold comps…