727 Oak St · Adrian, MI
Flood risk 1/10 · Minimal
- FEMA flood zone
- X (unshaded)
- Chance of flooding over 30 yrs
- 0.0%
- Est. flood insurance / yr
- $473 – $860
Fire risk 3/10 · Minor
- Est. fire insurance / yr
- $784 – $1,456
Heat risk 3/10 · Minor
- Hot days now (above 98°F)
- 7 days/yr
- Hot days in 30 yrs
- 16 days/yr
Wind risk 2/10 · Minimal
- Chance of severe wind over 30 yrs
- —
Air-quality risk 2/10 · Minimal
- Unhealthy air days now
- 1 days/yr
- Unhealthy air days in 30 yrs
- 1 days/yr
Risk factors via First Street. Map © Google.
Why this score? — see what drove the B+ grade
The composite is a weighted blend of 9 inputs, each scored 0–100. Each bar is that input's sub-score; the figure is the points it added to the 100-point composite (weight × sub-score).
- Cash flow +30.0/30.0
- ARV discount +15.0/15.0
- 1% rule +10.0/10.0
- DSCR +10.0/10.0
- Livability +3.5/5.0
- Rent growth +2.5/5.0
- Schools +2.5/10.0
- Condition / age +2.5/5.0
- Appreciation +0.0/10.0
$69,900
🖨 Deal sheet 📄 Offer letter ✓ Due diligence
Listing remarks MLS
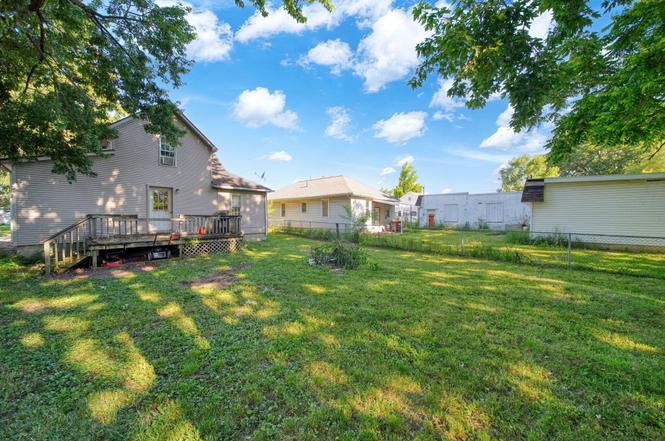
Welcome to 727 Oak Street, a classic Michigan bungalow loaded with character and just waiting for the right owner to bring it back to life. This 3-bedroom, 1-bath home offers a fantastic layout with a spacious living room featuring original charm, an eat-in kitchen with painted cabinetry, a gas range, stainless steel refrigerator, and a cozy built-in breakfast nook perfect for family meals. The bedrooms provide flexible space for a growing family, guests, or a home office, while the full bathroom is ready for a fresh update. A large enclosed back porch adds bonus square footage and could easily be transformed into a sunroom, mudroom, or extra storage with a little finishing work. The home does need updates throughout, including flooring, paint, and bathroom renovation. Sitting on a nice lot with mature trees and a driveway for off-street parking, this property is a great candidate for a fix and flip, a rental hold, or a homeower.
Key facts
- Painted cabinetry
- Eat-in kitchen
- Gas range
Tags
Property features AI
Finance
- Other: Living area approximately 894; Lot size approximately 0.11 acres
- Financial info: Not specified
- HOA & community: Not specified
Exterior
- Parking: Not specified
- Security: Not specified
- Utilities: Public water
- Home design: Single-family residence; Residential property
- Construction: Built in 1940
- Exterior features: Vinyl siding
Interior
- Kitchen: Not specified
- Bedrooms: Not specified
- Flooring: Not specified
- Bathrooms: 1 full bathroom
- Heating & cooling: Forced air heating
- Interior features: Total of 3 rooms; Michigan-style basement
- Laundry & utility: Not specified
Neighborhood map
What this means for you Summary
Snapshot
- This is a 3-bed/1.0-bath single-family listed at $70k.
Deal economics
- At list price, monthly cash flow is $553 ($7k/yr) — positive.
- The deal already cash-flows at list — no discount required.
- Meets the 1% rule at list price ($1k rent vs $70k).
- Cap rate 15.8% vs local median 5.7% in Adrian — top-decile yield for the area; either an underpriced asset or a hidden risk that comps aren't pricing in. Stress-test before assuming the spread holds.
Location & tenants
- Location reads 69/100 on livability (#342 in MI) — a middle-class / working-renter tenant base. Strengths: cost of living A+, housing A+, health & safety A+; Watch: amenities D, crime F, commute F.
- Adrian School District (town): math 25% / reading 35% proficiency, ranked #370 of 540 in MI (top 68%) — families likely to look elsewhere, expect single-tenant / working-renter base with shorter leases.
- Market conditions: 214 active listings in the ZIP; 2 comparable units currently listed for rent nearby; 137 units permitted in Lenawee County in 2024 (0 in 5+ unit buildings).
Forward outlook
- Local home prices are declining (-3.0%/yr); year-one equity from $483 of loan paydown is wiped out by about $2k of value loss. Plan a longer hold.
- Lenawee County population projected at -18% by 2050 — secular population decline; favor cash flow + early exit over multi-decade hold.
- At projected returns (-3.0% appreciation + 3.0% rent growth), your $20k cash investment doubles in ~4 years — after that, you're playing with house money.
Negotiation context
- Only 3 days on market — expect competitive offers; lowballing is unlikely to land.
- 7 sale attempts since 17y ago with the ask held roughly flat each time — persistent listings suggest the price (not the market) is what's stuck; bring a comps-based counter.
- Current owner paid $15k; list at $70k implies a 366% gain — meaningful room to come down on a strong offer.
Risks & watch-outs
- Watch-outs: built in 1940 — expect roof / HVAC / electrical / plumbing capex.
Questions for the listing agent
- Built in 1940 — when were the roof, HVAC, electrical panel, plumbing, and water heater last replaced?
- Is there a deadline driving the sale (1031 exchange, divorce, estate, relocation)? That informs how much negotiation room exists.
- Crime grade is F in this area — have there been break-ins, vandalism, or insurance claims at this property in the last 3 years? What carrier currently insures it and at what premium?
- What's the average days-on-market for RENTAL listings here right now (not sales)? A rising rental-DOM trend means longer vacancies and softer asking-rent achievability than the comps imply.
- What's the recent tenant-quality profile in this submarket — average credit score on applications, eviction rate, late-payment / NSF rate, and stable-employment percentage? A property-management company in the area should have these aggregated.
- How much new for-sale + rental construction is in the pipeline within 1–3 miles? Heavy new supply typically softens prices + rents 12–24 months out; constrained supply supports both.
Investment metrics
- 1% rule
- 1.96% ✓
- Cap rate
- 15.78%
- Cash-on-cash
- 33.88%
- DSCR
- 2.51
- GRM
- 4.3
CMA / ARV
- ARV (on-the-fly)
- $109,068
- Comps found
- 12
Show comp detail 12 sales within ~0.75 mi
| Address | Dist | Beds/Ba | Sqft | Sold | Price | $/sf | Match |
|---|---|---|---|---|---|---|---|
| 536 Tabor St | 0.28mi | 2/1.0 (-1) | 965 (+8%) | 8mo | $117,500 | $122 | 62 |
| 547 Tabor St | 0.24mi | 2/1.0 (-1) | 974 (+9%) | 11mo | $55,000 | $56 | 59 |
| 209 Sarah St | 0.50mi | 2/1.0 (-1) | 916 (+2%) | 11mo | $116,000 | $127 | 58 |
| 839 Dennis St | 0.66mi | 2/1.0 (-1) | 938 (+5%) | 3mo | $90,000 | $96 | 54 |
| 224 Berry St | 0.56mi | 4/1.5 (+1) | 938 (+5%) | 8mo | $130,000 | $139 | 52 |
| 831 E Maumee St | 0.57mi | 3/1.0 | 1,008 (+13%) | 1mo | $143,900 | $143 | 52 |
| 1046 Railroad St | 0.28mi | 2/1.0 (-1) | 1,008 (+13%) | 14mo | $60,000 | $60 | 49 |
| 210 Elm St | 0.65mi | 2/1.0 (-1) | 950 (+6%) | 12mo | $33,000 | $35 | 44 |
| 1169 Division St | 0.75mi | 2/1.0 (-1) | 975 (+9%) | 2mo | $160,000 | $164 | 44 |
| 121 W Beecher St | 0.70mi | 3/1.0 | 1,000 (+12%) | 6mo | $60,000 | $60 | 42 |
| 1025 Frank St | 0.47mi | 2/1.0 (-1) | 1,002 (+12%) | 14mo | $111,300 | $111 | 42 |
| 1157 Division St | 0.73mi | 3/1.0 | 975 (+9%) | 12mo | $120,000 | $123 | 41 |
Match score weights: distance 35% · size 25% · config 20% · recency 20%. Top-matched comps best support the ARV.
Projected returns pro-forma
-3.0% appreciation · 3.0% rent growth · sell at horizon
- IRR
- 29.3%
- Equity multiple
- 2.22×
- Total profit
- $23,917
- Equity at exit
- $10,422
- IRR
- 36.6%
- Equity multiple
- 4.39×
- Total profit
- $66,342
- Equity at exit
- $6,044
Cash invested: $19,572 (down + closing). Projections, not guarantees.
Landlord ↔ Tenant lean methodology
- Overall (STATE)
- 62 Landlord-Friendly
- State Michigan
- 62 Landlord-Friendly · EVEN
- County
- — inherits STATE
- City
- — inherits STATE
ZIP-level market 49221
- Active inventory
- 214
- Price-to-rent
- 4.3×
Monthly cashflow live
- Estimated rent
- $1,368 medium interval (Pro) →
- Mortgage (P&I)
- −$367
- Tax from tax record
- −$132 /mo · $1,586/yr
- Insurance
- −$29
- HOA
- −$0
- Vacancy / Maint / Mgmt
- −$287
- Net cashflow
- $553
Break-even live
UW: 25.0% down · 7.5% · 30yr · 1.5% tax · 5.0% vac · 8.0% maint · 8.0% mgmt
Financing live
Cash to close
- Down payment
- $17,475
- Closing costs
- $2,097
- Reserves months
- —
- Total cash needed
- —
Loan-product check · same deal, 3 products live
Conventional
25% down · 7.5% · 30yr
- Down + closing
- —
- Monthly P&I
- —
- Monthly cashflow
- —
- DSCR
- —
- Eligible?
- —
Personal DTI + credit; lowest rate.
DSCR
20% down · 8.5% · 30yr
- Down + closing
- —
- Monthly P&I
- —
- Monthly cashflow
- —
- DSCR
- —
- Eligible?
- —
No personal income docs; deal must DSCR.
Hard money
10% down · 12.0% · 12mo
- Down + closing
- —
- Monthly P&I
- —
- Monthly cashflow
- —
- DSCR
- —
- Eligible?
- —
Short-term bridge; refi at stabilization.
Rent comps 2 comps
| Address | Beds | Baths | Sqft | Rent | $/sqft | DOM | Units | Dist |
|---|---|---|---|---|---|---|---|---|
| 413 E Maple Ave Unit 2 Adrian, MI | 2.0 | 1.0 | 652 | $1,200 | $1.84 | 23d | 1 | 0.83mi |
| 413 E Maple Ave Unit 1 Adrian, MI | 2.0 | 1.0 | 826 | $1,500 | $1.82 | 23d | 1 | 0.83mi |
Listing history 4 events
-
2026-06-18days on market $69,900 Active 3 DOM
-
2026-06-17days on market $69,900 Active 2 DOM
-
2026-06-16remarks 699-char remark
-
2026-06-16$69,900 Active 1 DOM
ⓘ Source: listings_history table (triggers on properties + properties_extension) + one-shot
backfill from property_details.listing_events for pre-trigger history.
Tax reassessment forecast MI · Partial reset (capped growth)
- Current annual tax
- $1,586 · $132/mo
- Projected year-2 tax
- $1,586 · $132/mo
- Expected delta
- $0/yr ($0/mo · -0.0%)
ⓘ Screening estimate from a state-policy table — verify with the county assessor before closing.
Climate risk First Street
- Flood 1/10 Low FEMA zone X (unshaded) · 0% chance over 30 yrs
- Wildfire 3/10 Moderate
- Heat 3/10 Moderate 7 d/yr ≥98°F today · 16 d/yr by 30 yrs out
- Wind 2/10 Low
- Air quality 2/10 Low 1 unhealthy d/yr today · 1 by 30 yrs out
Nearby sold comps map
Loading sold comps map…
Walkable amenities ~0.75 mi
Loading nearby amenities…
Taxation est. · year 1
- Rental income
- $16,412
- − Mortgage interest
- −$3,915
- − Property taxes
- −$1,586
- − Insurance
- −$350
- − Repairs & maintenance
- −$1,313
- − Management
- −$1,313
- − Depreciation
- −$2,033
- Taxable income
- $5,902
- Est. tax owed @ 24.0%
- −$1,416
- After-tax cash flow
- $5,215/yr
For passive investors: Depreciation is non-cash, so a rental often shows a tax loss while cash-flowing — sheltering income. Rental losses are passive: they offset passive income freely, and up to $25,000/yr can offset ordinary (W-2) income if you actively participate and your MAGI is under $100k (phasing out to $0 by $150k); unused losses carry forward. On sale, claimed depreciation is recaptured at up to 25%, and gains may owe capital-gains tax (a 1031 exchange can defer both). Figures are a year-1 estimate at your 24.0% rate — not tax advice; consult a CPA.
Schools (NCES district)
- District
- Adrian School District
- NCES district ID
- 2601950
- Math proficiency
- 25% ▼ -1.00%
- Reading proficiency
- 35% ▼ -2.00%
- Median HH income
- $41,288
- Composite
- 25.33/100
- National rank
- #7480
- State rank
- #370 of 540 in MI
Livability — Adrian
- Score
- 69/100
- State rank
- #342
- US rank
- #8722
Category grades
Schools grade is shown separately in the Schools card above.
Census & demographics
- Census place
- Adrian, MI
- City population
- 41,041
- Population (ZIP)
- 41,041
Population outlook (Lenawee County) Hauer SSP2
- Today (2025)
- 95,497 people
- By 2030
- 92,722 · -2.9%
- By 2040
- 85,641 · -10.3%
- By 2050
- 77,971 · -18.4%
- By 2075
- 60,043 · -37.1%
- By 2100
- 41,468 · -56.6%
Race, ethnicity, and origin ACS 2023
- Neighborhood character
- Predominantly White (77%)
- Race & ethnicity
- White 77% Hispanic / Latino 14% Two or more races 8% Black 4%
- Hispanic origin (detail)
- Mexican 12%
- Common ancestry
- Romanian 3% Lithuanian 3% Italian 2%
- Foreign-born
- 3% · Canada
- Languages at home
- 93% English-only · Spanish 6% Arabic 1%
Political lean MEDSL · Lenawee
- 2024 margin
- Strong R (+23.0) · D 37.8% · R 60.8% · Other 1.4%
- 2008→2024 swing
- -28.1pp toward R · 2008: 5.1pp · 2024: -23.0pp
- All cycles
- 2024: R+23.0 2020: R+19.9 2016: R+21.1 2012: R+1.3 2008: D+5.1
Not yet ingested
- Civics
- —
Market trends
- HPI YoY
- ▼ -143.64%
- Current HPI
- 237.3796
- Rent YoY
- —
- Metro
- —
- State GDP YoY
- ▲ 1.37%
- F500 in state
- 28
Industry mix (Fortune 500 HQ in MI)
| Industry | F500 HQs | Revenue |
|---|---|---|
| Automotive Parts | 3 | $48B |
|
||
| Automotive | 2 | $372B |
|
||
| Chemicals | 1 | $45B |
|
||
| Automotive Retail | 1 | $29B |
|
||
| Healthcare / Medical Devices | 1 | $23B |
|
||
| Automotive Technology | 1 | $20B |
|
||
Price history
+141.9% since first listed12 events — show timeline
- 2026-06-15 Listed $69,900 REALCOMP
- 2026-06-15 Listed $69,900 SW Michigan MLS
- 2026-06-15 Listed $69,900 MiRealSource-MiMLS
- 2015-06-01 Listing Removed — MiRealSource-MiMLS
- 2015-06-01 Listing Removed — REALCOMP
- 2015-03-12 Listed $39,900 MiRealSource-MiMLS
- 2015-03-12 Listed $39,900 REALCOMP
- 2011-01-03 Sold (MLS) $15,000 REALCOMP
- 2011-01-03 Sold (MLS) $15,000 MiRealSource-MiMLS
- 2010-12-30 Listing Removed — MiRealSource-MiMLS
- 2009-01-21 Listed $28,900 REALCOMP
- 2009-01-21 Listed $28,900 MiRealSource-MiMLS
Property tax history
+3.5%/yrLatest (2025): $1,586 · +2.3% YoY. Source: county tax records.
Cash-flow waterfall
monthlySold comps — $/sqft
last 12 mo · ≤1 miLoading sold comps…