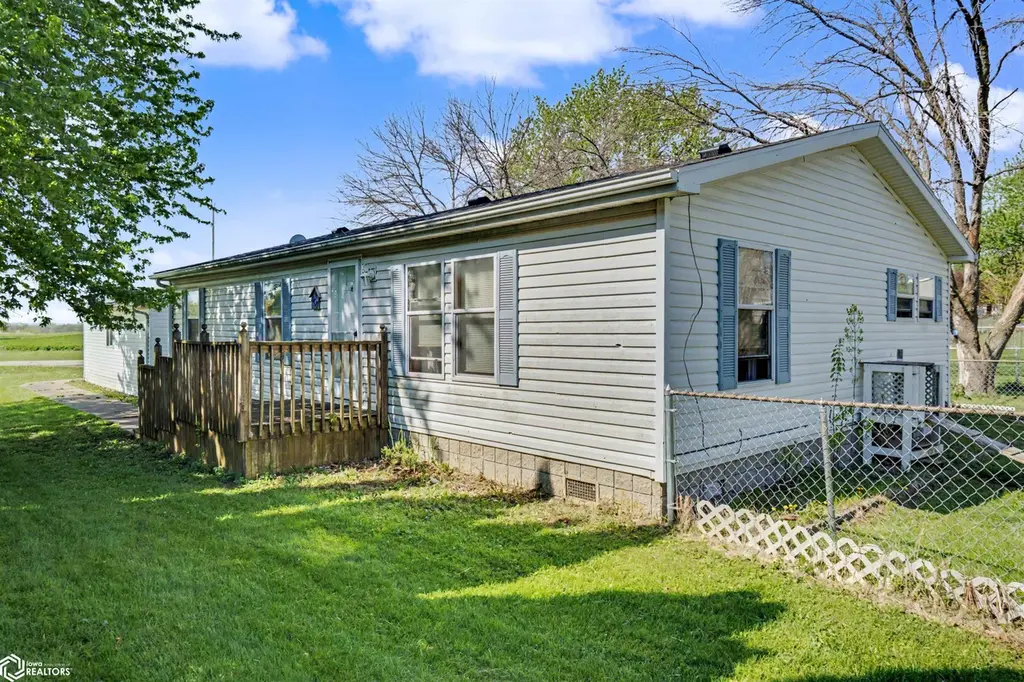
407 S Main St · Albion, IA
Flood risk 1/10 · Minimal
- FEMA flood zone
- X (unshaded)
- Chance of flooding over 30 yrs
- 0.0%
- Est. flood insurance / yr
- $507 – $1,088
Fire risk 4/10 · Minor
- Est. fire insurance / yr
- $902 – $1,676
Heat risk 3/10 · Minor
- Hot days now (above 103°F)
- 7 days/yr
- Hot days in 30 yrs
- 15 days/yr
Wind risk 2/10 · Minimal
- Chance of severe wind over 30 yrs
- —
Air-quality risk 1/10 · Minimal
- Unhealthy air days now
- 0 days/yr
- Unhealthy air days in 30 yrs
- 0 days/yr
Risk factors via First Street. Map © Google.
Why this score? — see what drove the A- grade
The composite is a weighted blend of 9 inputs, each scored 0–100. Each bar is that input's sub-score; the figure is the points it added to the 100-point composite (weight × sub-score).
- Cash flow +30.0/30.0
- ARV discount +15.0/15.0
- 1% rule +10.0/10.0
- DSCR +10.0/10.0
- Appreciation +5.5/10.0
- Schools +4.3/10.0
- Livability +3.2/5.0
- Rent growth +2.5/5.0
- Condition / age +2.5/5.0
$68,000
🖨 Deal sheet 📄 Offer letter ✓ Due diligence
Listing remarks MLS
Affordable Living. take a look at this 3 bedroom, 2 bath built in 2002! Open floor plan with vaulted ceilings, master bedroom with bath featuring garden tub, sky light & walk in closet PLUS 2 stall garage and SO MUCH MORE!! Call today.
Key facts
- Main floor laundry
- Full bath
- Walk in closet
Tags
Property features AI
Finance
- Other: Lot size: 0.24 acres
Exterior
- Parking: Detached 2-car garage
- Utilities: Public water; Public sewer; Electric with circuit breakers
- Home design: Single-family residence; Residential property
- Construction: Vinyl siding
- Exterior features: Shingle roof
Interior
- Bathrooms: 1 full bathroom; 1 three-quarter bathroom
- Interior features: Central air conditioning; Forced air heating
Neighborhood map
What this means for you Summary
Snapshot
- This is a 3-bed/2.0-bath single-family listed at $68k.
Deal economics
- At list price, monthly cash flow is $388 ($5k/yr) — positive.
- The deal already cash-flows at list — no discount required.
- Meets the 1% rule at list price ($1k rent vs $68k).
Location & tenants
- Location reads 65/100 on livability (#582 in IA) — a middle-class / working-renter tenant base. Strengths: cost of living A+, housing A+; Watch: schools F, amenities F, commute F.
- Marshalltown Community School District (town): math 50% / reading 52% proficiency, ranked #278 of 289 in IA (top 96%) — acceptable for families but not a draw, mixed tenant base, ~2y average lease; 60% free/reduced lunch — lower-income household profile, screen leases tightly.
- Market conditions: 8 active listings in the ZIP; 35 units permitted in Marshall County in 2024 (0 in 5+ unit buildings).
Forward outlook
- In year one you build about $1k of equity ($470 loan paydown + $624 appreciation (0.9% local appreciation)).
- Marshall County population projected at +8% by 2050 — modest demand growth; plan on rents tracking national, not racing it.
- At projected returns (0.9% appreciation + 3.0% rent growth), your $19k cash investment doubles in ~4 years — after that, you're playing with house money.
Negotiation context
- Only 2 days on market — expect competitive offers; lowballing is unlikely to land.
- 2 sale attempts since 12y ago with the ask held roughly flat each time — persistent listings suggest the price (not the market) is what's stuck; bring a comps-based counter.
Questions for the listing agent
- Is there a deadline driving the sale (1031 exchange, divorce, estate, relocation)? That informs how much negotiation room exists.
- Schools are F-rated, which usually means shorter tenancies and higher turnover. Who's the typical renter profile here, and what's been the actual vacancy rate?
- What's the average days-on-market for RENTAL listings here right now (not sales)? A rising rental-DOM trend means longer vacancies and softer asking-rent achievability than the comps imply.
- What's the recent tenant-quality profile in this submarket — average credit score on applications, eviction rate, late-payment / NSF rate, and stable-employment percentage? A property-management company in the area should have these aggregated.
- How much new for-sale + rental construction is in the pipeline within 1–3 miles? Heavy new supply typically softens prices + rents 12–24 months out; constrained supply supports both.
Investment metrics
- 1% rule
- 1.55% ✓
- Cap rate
- 13.14%
- Cash-on-cash
- 24.46%
- DSCR
- 2.09
- GRM
- 5.4
CMA / ARV
- ARV (median comp)
- $125,457
- List price
- $68,000
- Delta
- -45.80%
- Verdict
- UNDERPRICED
- Comps
- 9 within 1.0 mi
Show comp detail 2 sales within ~0.75 mi
| Address | Dist | Beds/Ba | Sqft | Sold | Price | $/sf | Match |
|---|---|---|---|---|---|---|---|
| 407 S Main St | 0.00mi | 3/2.0 | 1,144 (0%) | 0mo | $70,000 | $61 | 100 |
| 105 S Dubuque St | 0.23mi | 3/1.5 | 1,288 (+13%) | 3mo | $159,000 | $123 | 64 |
Match score weights: distance 35% · size 25% · config 20% · recency 20%. Top-matched comps best support the ARV.
Projected returns pro-forma
0.92% appreciation · 3.0% rent growth · sell at horizon
- IRR
- 26.5%
- Equity multiple
- 2.35×
- Total profit
- $25,720
- Equity at exit
- $22,923
- IRR
- 29.3%
- Equity multiple
- 4.50×
- Total profit
- $66,662
- Equity at exit
- $30,238
Cash invested: $19,040 (down + closing). Projections, not guarantees.
Landlord ↔ Tenant lean methodology
- Overall (STATE)
- 83 Strongly Landlord-Friendly
- State Iowa
- 83 Strongly Landlord-Friendly · R+6
- County
- — inherits STATE
- City
- — inherits STATE
ZIP-level market 50005
- Home prices YoY
- 0.9%
- Active inventory
- 8
- Price-to-rent
- 5.4×
Monthly cashflow live
- Estimated rent
- $1,053 medium interval (Pro) →
- Mortgage (P&I)
- −$357
- Tax from tax record
- −$58 /mo · $702/yr
- Insurance
- −$28
- HOA
- −$0
- Vacancy / Maint / Mgmt
- −$221
- Net cashflow
- $388
Break-even live
UW: 25.0% down · 7.5% · 30yr · 1.5% tax · 5.0% vac · 8.0% maint · 8.0% mgmt
Financing live
Cash to close
- Down payment
- $17,000
- Closing costs
- $2,040
- Reserves months
- —
- Total cash needed
- —
Loan-product check · same deal, 3 products live
Conventional
25% down · 7.5% · 30yr
- Down + closing
- —
- Monthly P&I
- —
- Monthly cashflow
- —
- DSCR
- —
- Eligible?
- —
Personal DTI + credit; lowest rate.
DSCR
20% down · 8.5% · 30yr
- Down + closing
- —
- Monthly P&I
- —
- Monthly cashflow
- —
- DSCR
- —
- Eligible?
- —
No personal income docs; deal must DSCR.
Hard money
10% down · 12.0% · 12mo
- Down + closing
- —
- Monthly P&I
- —
- Monthly cashflow
- —
- DSCR
- —
- Eligible?
- —
Short-term bridge; refi at stabilization.
Listing history 4 events
-
2026-05-04status Pending 387-char remark
-
2026-05-01$68,000 Active 387-char remark
-
2014-09-23soldstatus $55,000 241-char remark
Show marketing remark (241 chars)
Affordable Living. take a look at this 3 bedroom, 2 bath built in 2002! Open floor plan with vaulted ceilings, master bedroom with bath featuring garden tub, sky light & walk in closet PLUS 2 stall garage and SO MUCH MORE!! Call today.
-
2014-06-24$59,900 241-char remark
Show marketing remark (241 chars)
Affordable Living. take a look at this 3 bedroom, 2 bath built in 2002! Open floor plan with vaulted ceilings, master bedroom with bath featuring garden tub, sky light & walk in closet PLUS 2 stall garage and SO MUCH MORE!! Call today.
ⓘ Source: listings_history table (triggers on properties + properties_extension) + one-shot
backfill from property_details.listing_events for pre-trigger history.
Tax reassessment forecast IA · Partial reset (capped growth)
- Current annual tax
- $702 · $58/mo
- Projected year-2 tax
- $885 · $74/mo
- Expected delta
- +$183/yr (+$15/mo · 26.0%)
ⓘ Screening estimate from a state-policy table — verify with the county assessor before closing.
Climate risk First Street
- Flood 1/10 Low FEMA zone X (unshaded) · 0% chance over 30 yrs
- Wildfire 4/10 Moderate
- Heat 3/10 Moderate 7 d/yr ≥103°F today · 15 d/yr by 30 yrs out
- Wind 2/10 Low
- Air quality 1/10 Low 0 unhealthy d/yr today · 0 by 30 yrs out
Nearby sold comps map
Loading sold comps map…
Walkable amenities ~0.75 mi
Loading nearby amenities…
Taxation est. · year 1
- Rental income
- $12,632
- − Mortgage interest
- −$3,809
- − Property taxes
- −$702
- − Insurance
- −$340
- − Repairs & maintenance
- −$1,011
- − Management
- −$1,011
- − Depreciation
- −$1,978
- Taxable income
- $3,781
- Est. tax owed @ 24.0%
- −$908
- After-tax cash flow
- $3,750/yr
For passive investors: Depreciation is non-cash, so a rental often shows a tax loss while cash-flowing — sheltering income. Rental losses are passive: they offset passive income freely, and up to $25,000/yr can offset ordinary (W-2) income if you actively participate and your MAGI is under $100k (phasing out to $0 by $150k); unused losses carry forward. On sale, claimed depreciation is recaptured at up to 25%, and gains may owe capital-gains tax (a 1031 exchange can defer both). Figures are a year-1 estimate at your 24.0% rate — not tax advice; consult a CPA.
Schools (NCES district)
- District
- Marshalltown Community School District
- NCES district ID
- 1918720
- Math proficiency
- 50% ▼ -8.00%
- Reading proficiency
- 52% ▬ 0.00%
- Median HH income
- $47,877
- Composite
- 43.41/100
- National rank
- #3015
- State rank
- #278 of 289 in IA
Livability — Albion
- Score
- 65/100
- State rank
- #582
- US rank
- #13234
Category grades
Schools grade is shown separately in the Schools card above.
Census & demographics
- Census place
- Albion, IA
- Population (ZIP)
- 830
Population outlook (Marshall County) Hauer SSP2
- Today (2025)
- 41,166 people
- By 2030
- 41,477 · +0.8%
- By 2040
- 42,548 · +3.4%
- By 2050
- 44,472 · +8.0%
- By 2075
- 52,719 · +28.1%
- By 2100
- 60,912 · +48.0%
Race, ethnicity, and origin ACS 2023
- Neighborhood character
- Predominantly White (68%)
- Race & ethnicity
- White 68% Asian 26% Hispanic / Latino 3% Native American 2% Two or more races 2%
- Common ancestry
- Portuguese 6% Lithuanian 2% Iranian 1%
- Foreign-born
- 23% · Vietnam, Canada
- Languages at home
- 75% English-only · Vietnamese 24% Spanish 2%
Political lean MEDSL · Marshall
- 2024 margin
- R (+15.6) · D 41.4% · R 57.0% · Other 1.6%
- 2008→2024 swing
- -24.9pp toward R · 2008: 9.3pp · 2024: -15.6pp
- All cycles
- 2024: R+15.6 2020: R+7.7 2016: R+8.5 2012: D+8.9 2008: D+9.3
Not yet ingested
- Civics
- —
Market trends
- HPI YoY
- ▲ 0.92%
- Current HPI
- 106.3038
- Rent YoY
- —
- Metro
- —
- State GDP YoY
- ▲ 2.48%
- F500 in state
- 4
Industry mix (Fortune 500 HQ in IA)
| Industry | F500 HQs | Revenue |
|---|---|---|
| Financial Services | 1 | $16B |
|
||
| Retail / Convenience | 1 | $15B |
|
||
Price history
+16.9% since first listed6 events — show timeline
- 2026-06-04 Sold (Public Records) $70,000 Public Records
- 2026-06-04 Sold (MLS) $70,000 IAR
- 2026-05-04 Pending — IAR
- 2026-05-01 Listed $68,000 IAR
- 2014-09-23 Sold (MLS) $55,000 IAR
- 2014-06-24 Listed $59,900 IAR
Property tax history
-5.2%/yrLatest (2025): $702 · +11.8% YoY. Source: county tax records.
Cash-flow waterfall
monthlySold comps — $/sqft
last 12 mo · ≤1 miLoading sold comps…