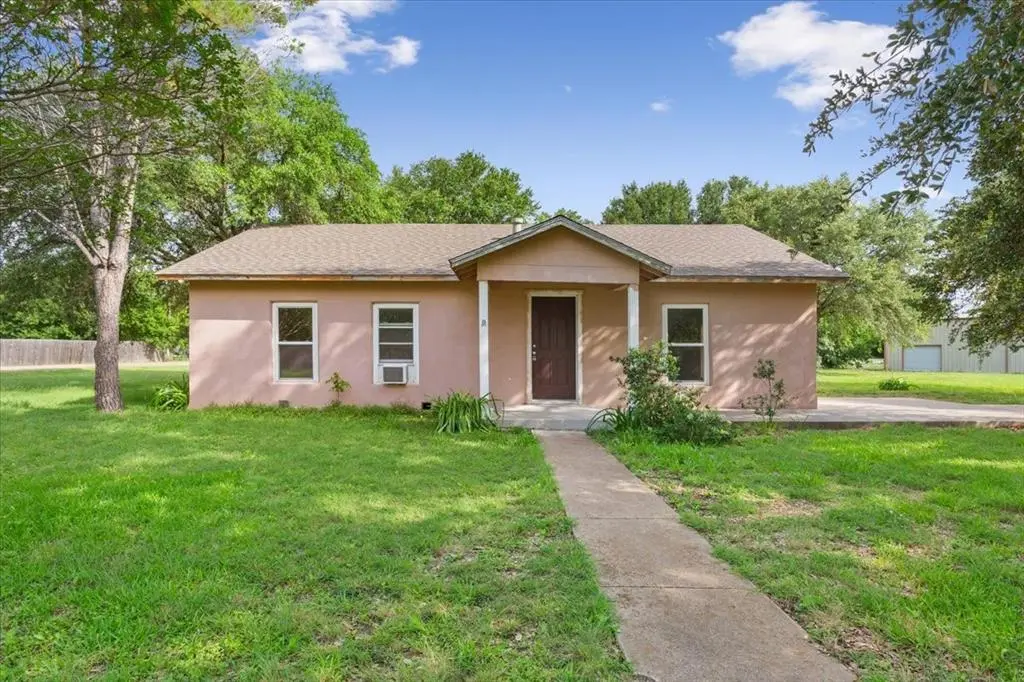
1084 Speegle Rd · Willow Grove, TX
Flood risk 1/10 · Minimal
- FEMA flood zone
- X (unshaded)
- Chance of flooding over 30 yrs
- 0.0%
- Est. flood insurance / yr
- $507 – $1,088
Fire risk 5/10 · Moderate
- Est. fire insurance / yr
- $1,222 – $2,270
Heat risk 7/10 · Major
- Hot days now (above 109°F)
- 7 days/yr
- Hot days in 30 yrs
- 24 days/yr
Wind risk 6/10 · Moderate
- Chance of severe wind over 30 yrs
- 62.0%
Air-quality risk 2/10 · Minimal
- Unhealthy air days now
- 0 days/yr
- Unhealthy air days in 30 yrs
- 1 days/yr
Risk factors via First Street. Map © Google.
Why this score? — see what drove the C+ grade
The composite is a weighted blend of 9 inputs, each scored 0–100. Each bar is that input's sub-score; the figure is the points it added to the 100-point composite (weight × sub-score).
- Cash flow +26.1/30.0
- DSCR +8.8/10.0
- ARV discount +7.5/15.0
- 1% rule +7.2/10.0
- Schools +5.2/10.0
- Rent growth +2.7/5.0
- Livability +2.5/5.0
- Condition / age +2.5/5.0
- Appreciation +0.0/10.0
$132,000
🖨 Deal sheet 📄 Offer letter ✓ Due diligence
Listing remarks
Priced to sell! This 2-bedroom, 1-bath home sits on just over an acre in Midway ISD. This property was in progress of a remodel when the owner had to step away. Being sold, As-is, it awaits the new owner to take it to the final product. Take advantage of this head start by adding flooring, kitchen cabinets, appliances and customizations exactly as you like to maximize ROI.
Key facts
- 1.06 acre lot
- Built 1945
- Listed 5 days
Property features AI
Finance
- Other: Probate listing; Possession at closing/funding or other
- Financial info: Listing accepts Cash, Conventional, FHA-203K
- HOA & community: No association
Exterior
- Parking: Driveway parking
- Utilities: City water; Electricity connected; Septic system
- Home design: Single-family residence; Residential property; One story; No attached units; No accessory unit; No known restrictions
- Construction: Stucco exterior; Shingle roof; Pillar/post/pier foundation; Built in 1945 (preowned)
- Exterior features: Front porch; RV hookup; Chain link and partial fencing; Workshop with electric on property; Easements for utilities; Many trees, irregular acreage
Interior
- Kitchen: Eat-in kitchen; Appliances: none or other (no standard appliances listed)
- Bedrooms: 2 bedrooms (both on main level); Primary bedroom on main level
- Flooring: See remarks for flooring details
- Bathrooms: 1 full bathroom with separate shower and linen closet
- Heating & cooling: Window unit(s) for cooling
- Interior features: Eat-in kitchen; One-level layout; 5 total rooms; 1 living area; 1 dining area
- Laundry & utility: Washer hookup on site; Other laundry features
Neighborhood map
What this means for you Summary
Snapshot
- This is a 2-bed/2.0-bath single-family listed at $132k.
Deal economics
- At list price, monthly cash flow is $333 ($4k/yr) — positive.
- The deal already cash-flows at list — no discount required.
- Meets the 1% rule at list price ($2k rent vs $132k).
Location & tenants
- Location reads: area grade C — affects rentability + tenant quality, not the cash-flow math above.
- Midway ISD (other): math 61% / reading 58% proficiency, ranked #56 of 826 in TX (top 7%) — acceptable for families but not a draw, mixed tenant base, ~2y average lease.
- Zoned schools: South Bosque El (math 75% / reading 76%, grade A, #73 of 4,322 statewide, top 2%, 595 students, 13% FRL).
- Zoned-school proficiency averages 76% at this address vs 60% district-wide (+16 pts) — the actual schools serving this property are materially stronger than the Midway ISD average implies; a family-tenant draw the district grade alone would hide.
- Market conditions: Rents flat; 308 active listings in the ZIP; 1 comparable units currently listed for rent nearby; solid renter incomes; 1,014 units permitted in McLennan County in 2024 (200 in 5+ unit buildings).
Forward outlook
- Local home prices are declining (-3.0%/yr); year-one equity from $913 of loan paydown is wiped out by about $4k of value loss. Plan a longer hold.
- McLennan County population projected at +17% by 2050 — long-run rental-demand tailwind backs the buy-and-hold thesis.
Negotiation context
- Only 5 days on market — expect competitive offers; lowballing is unlikely to land.
- 2 sale attempts since 6y ago with the ask held roughly flat each time — persistent listings suggest the price (not the market) is what's stuck; bring a comps-based counter.
Risks & watch-outs
- Watch-outs: built in 1945 — expect roof / HVAC / electrical / plumbing capex.
- Climate carrying-cost: major wind risk, 62% chance of damaging wind over 30y; moderate wildfire risk; extreme-heat days projected 7→24/yr by 2055 (HVAC capex compounding) — expect insurance premiums to compound above CPI over the hold.
Questions for the listing agent
- Built in 1945 — when were the roof, HVAC, electrical panel, plumbing, and water heater last replaced?
- Is there a deadline driving the sale (1031 exchange, divorce, estate, relocation)? That informs how much negotiation room exists.
- What's the average days-on-market for RENTAL listings here right now (not sales)? A rising rental-DOM trend means longer vacancies and softer asking-rent achievability than the comps imply.
- What's the recent tenant-quality profile in this submarket — average credit score on applications, eviction rate, late-payment / NSF rate, and stable-employment percentage? A property-management company in the area should have these aggregated.
- How much new for-sale + rental construction is in the pipeline within 1–3 miles? Heavy new supply typically softens prices + rents 12–24 months out; constrained supply supports both.
Investment metrics
- 1% rule
- 1.22% ✓
- Cap rate
- 9.32%
- Cash-on-cash
- 10.81%
- DSCR
- 1.48
- GRM
- 6.8
CMA / ARV
No comps found within radius.
Projected returns pro-forma
-3.0% appreciation · 0.71% rent growth · sell at horizon
- IRR
- -2.8%
- Equity multiple
- 0.90×
- Total profit
- $-3,775
- Equity at exit
- $19,682
- IRR
- 4.1%
- Equity multiple
- 1.27×
- Total profit
- $9,938
- Equity at exit
- $11,413
Cash invested: $36,960 (down + closing). Projections, not guarantees.
Landlord ↔ Tenant lean methodology
- Overall (STATE)
- 87 Strongly Landlord-Friendly
- State Texas
- 87 Strongly Landlord-Friendly · R+5
- County
- — inherits STATE
- City
- — inherits STATE
ZIP-level market 76712
- Home prices YoY
- -32.6%
- Rents YoY
- 0.7%
- Active inventory
- 308
- Price-to-rent
- 6.8×
Monthly cashflow live
- Estimated rent
- $1,615 medium interval (Pro) →
- Mortgage (P&I)
- −$692
- Tax from tax record
- −$196 /mo · $2,351/yr
- Insurance
- −$55
- HOA
- −$0
- Vacancy / Maint / Mgmt
- −$339
- Net cashflow
- $333
Break-even live
UW: 25.0% down · 7.5% · 30yr · 1.5% tax · 5.0% vac · 8.0% maint · 8.0% mgmt
Financing live
Cash to close
- Down payment
- $33,000
- Closing costs
- $3,960
- Reserves months
- —
- Total cash needed
- —
Loan-product check · same deal, 3 products live
Conventional
25% down · 7.5% · 30yr
- Down + closing
- —
- Monthly P&I
- —
- Monthly cashflow
- —
- DSCR
- —
- Eligible?
- —
Personal DTI + credit; lowest rate.
DSCR
20% down · 8.5% · 30yr
- Down + closing
- —
- Monthly P&I
- —
- Monthly cashflow
- —
- DSCR
- —
- Eligible?
- —
No personal income docs; deal must DSCR.
Hard money
10% down · 12.0% · 12mo
- Down + closing
- —
- Monthly P&I
- —
- Monthly cashflow
- —
- DSCR
- —
- Eligible?
- —
Short-term bridge; refi at stabilization.
Rent comps 1 comps
| Address | Beds | Baths | Sqft | Rent | $/sqft | DOM | Units | Dist |
|---|---|---|---|---|---|---|---|---|
| 179 Weldon Dr Woodway, TX | 3.0 | 2.0 | 1762 | $1,880 | $1.07 | 13d | 1 | 1.03mi |
Listing history 7 events
-
2026-06-18status $132,000 Pending 5 DOM
-
2026-06-18days on market $132,000 Active 5 DOM
-
2026-06-17days on market $132,000 Active 4 DOM
-
2026-06-16days on market $132,000 Active 3 DOM
-
2026-06-15days on market $132,000 Active 2 DOM
-
2026-06-13remarks 376-char remark
-
2026-06-13$132,000 Active 1 DOM
ⓘ Source: listings_history table (triggers on properties + properties_extension) + one-shot
backfill from property_details.listing_events for pre-trigger history.
Tax reassessment forecast TX · Resets to sale price
- Current annual tax
- $2,351 · $196/mo
- Projected year-2 tax
- $2,416 · $201/mo
- Expected delta
- +$64/yr (+$5/mo · 2.7%)
ⓘ Screening estimate from a state-policy table — verify with the county assessor before closing.
Climate risk First Street
- Flood 1/10 Low FEMA zone X (unshaded) · 0% chance over 30 yrs
- Wildfire 5/10 Major
- Heat 7/10 Severe 7 d/yr ≥109°F today · 24 d/yr by 30 yrs out
- Wind 6/10 Major 62% chance of damaging wind over 30 yrs
- Air quality 2/10 Low 0 unhealthy d/yr today · 1 by 30 yrs out
Nearby sold comps map
Loading sold comps map…
Walkable amenities ~0.75 mi
Loading nearby amenities…
Taxation est. · year 1
- Rental income
- $19,385
- − Mortgage interest
- −$7,394
- − Property taxes
- −$2,351
- − Insurance
- −$660
- − Repairs & maintenance
- −$1,551
- − Management
- −$1,551
- − Depreciation
- −$3,840
- Taxable income
- $2,038
- Est. tax owed @ 24.0%
- −$489
- After-tax cash flow
- $3,507/yr
For passive investors: Depreciation is non-cash, so a rental often shows a tax loss while cash-flowing — sheltering income. Rental losses are passive: they offset passive income freely, and up to $25,000/yr can offset ordinary (W-2) income if you actively participate and your MAGI is under $100k (phasing out to $0 by $150k); unused losses carry forward. On sale, claimed depreciation is recaptured at up to 25%, and gains may owe capital-gains tax (a 1031 exchange can defer both). Figures are a year-1 estimate at your 24.0% rate — not tax advice; consult a CPA.
Schools (NCES district)
- District
- Midway ISD
- NCES district ID
- 4830640
- Math proficiency
- 61% ▼ -8.00%
- Reading proficiency
- 58% ▼ -7.00%
- Median HH income
- $67,076
- Composite
- 52.32/100
- National rank
- #1593
- State rank
- #56 of 826 in TX
Livability — Willow Grove
No livability data for this city. (Only ~50 U.S. cities are tracked.)
Census & demographics
- Census place
- Willow Grove, TX
- County
- McLennan County · 213,088 people
- Metro
- Waco, TX
- Population (ZIP)
- 29,118
- Household income
- $97,903
- Rent vs Own
- Severe rent burden
- 847.0
Population outlook (McLennan County) Hauer SSP2
- Today (2025)
- 264,191 people
- By 2030
- 273,578 · +3.6%
- By 2040
- 291,506 · +10.3%
- By 2050
- 308,044 · +16.6%
- By 2075
- 349,648 · +32.3%
- By 2100
- 364,779 · +38.1%
Race, ethnicity, and origin ACS 2023
- Neighborhood character
- Predominantly White (72%)
- Race & ethnicity
- White 72% Hispanic / Latino 14% Two or more races 12% Black 7% Asian 2%
- Hispanic origin (detail)
- Mexican 11% Puerto Rican 1%
- Common ancestry
- Slovak 3% Italian 2% Iranian 2%
- Foreign-born
- 5% · Canada, China
- Languages at home
- 90% English-only · Spanish 6% Other Indo-European 1% German/W. Germanic 1%
Political lean MEDSL · McLennan
- 2024 margin
- Solid R (+30.9) · D 34.0% · R 64.9% · Other 1.0%
- 2008→2024 swing
- -7.0pp toward R · 2008: -23.9pp · 2024: -30.9pp
- All cycles
- 2024: R+30.9 2020: R+23.4 2016: R+27.1 2012: R+29.8 2008: R+23.9
Not yet ingested
- Civics
- —
Market trends
- HPI YoY
- ▼ -96.17%
- Current HPI
- 198.9025
- Rent YoY
- ▲ 0.71%
- Metro
- Waco, TX
- State GDP YoY
- ▲ 3.95%
- F500 in state
- 110
Industry mix (Fortune 500 HQ in TX)
| Industry | F500 HQs | Revenue |
|---|---|---|
| Energy | 16 | $1,198B |
|
||
| Technology | 5 | $198B |
|
||
| Engineering / Construction | 4 | $72B |
|
||
| Energy Services | 3 | $60B |
|
||
| Utilities | 3 | $41B |
|
||
| Healthcare | 2 | $330B |
|
||
Price history
+10.1% since first listed6 events — show timeline
- 2026-06-12 Listed $132,000 NTREIS
- 2020-05-11 Listing Removed — NTREIS
- 2020-01-16 Listed $119,900 NTREIS
- 2019-10-31 Sold (Public Records) — Public Records
- 2010-05-06 Sold (Public Records) — Public Records
- 2009-10-28 Sold (Public Records) — Public Records
Property tax history
+5.0%/yrLatest (2025): $2,351 · +9.8% YoY. Source: county tax records.
Cash-flow waterfall
monthlySold comps — $/sqft
last 12 mo · ≤1 miLoading sold comps…