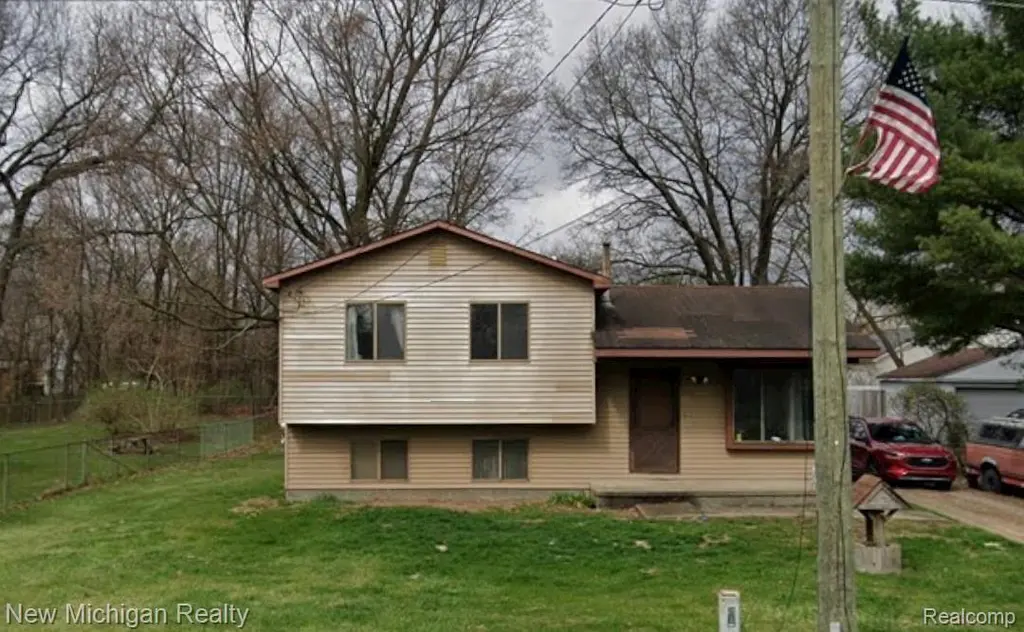
5705 Lake Grove Dr · White Lake, MI
Flood risk 1/10 · Minimal
- FEMA flood zone
- X (unshaded)
- Chance of flooding over 30 yrs
- 0.0%
- Est. flood insurance / yr
- $473 – $860
Fire risk 1/10 · Minimal
- Est. fire insurance / yr
- $784 – $1,456
Heat risk 2/10 · Minimal
- Hot days now (above 95°F)
- 7 days/yr
- Hot days in 30 yrs
- 15 days/yr
Wind risk 2/10 · Minimal
- Chance of severe wind over 30 yrs
- —
Air-quality risk 3/10 · Minor
- Unhealthy air days now
- 2 days/yr
- Unhealthy air days in 30 yrs
- 3 days/yr
Risk factors via First Street. Map © Google.
Why this score? — see what drove the D- grade
The composite is a weighted blend of 9 inputs, each scored 0–100. Each bar is that input's sub-score; the figure is the points it added to the 100-point composite (weight × sub-score).
- Cash flow +11.3/30.0
- ARV discount +9.9/15.0
- Schools +3.7/10.0
- DSCR +3.3/10.0
- Rent growth +2.5/5.0
- Livability +2.5/5.0
- Condition / age +2.5/5.0
- 1% rule +2.2/10.0
- Appreciation +0.0/10.0
$210,000
🖨 Deal sheet 📄 Offer letter ✓ Due diligence
Listing remarks MLS
Welcome to White Lake MI! This 3 bedroom 1 full bath tri-level home could be yours!
Key facts
- 0.3 acre lot
- Built 1984
- Listed 136 days
Neighborhood map
What this means for you Summary
Snapshot
- This is a 3-bed/1.0-bath single-family listed at $210k.
Deal economics
- At list price, monthly cash flow is $-77 ($-924/yr) — negative.
- To cash-flow at today's rent, offer at most $196k (6.5% below list).
- To meet the 1% rule (rent ≥ 1% of price), the offer needs to be $152k (27.6% below list).
- Recommended offer: $152k (27.6% below list) — sets the bar for 1% rule.
Location & tenants
- Location reads: area grade D — affects rentability + tenant quality, not the cash-flow math above.
- Holly Area School District (town): math 31% / reading 52% proficiency, ranked #165 of 540 in MI (top 31%) — families likely to look elsewhere, expect single-tenant / working-renter base with shorter leases.
- Market conditions: 68 active listings in the ZIP; 3 comparable units currently listed for rent nearby; rentals leasing fast (median 10d on market — plan ~1-2 weeks tenant-placement turnaround); 2,614 units permitted in Oakland County in 2024 (721 in 5+ unit buildings).
Forward outlook
- Local home prices are declining (-3.0%/yr); year-one equity from $1k of loan paydown is wiped out by about $6k of value loss. Plan a longer hold.
- Oakland County population projected at +10% by 2050 — modest demand growth; plan on rents tracking national, not racing it.
Negotiation context
- It's been on market 137 days — a 12% lower offer ($185k) is reasonable based on typical stale-listing flexibility.
- 2 sale attempts; this cycle's ask has dropped $70k (25%) from the opening price — seller is motivated, your offer sets the floor, not the list.
- Current owner paid $78k; list at $210k implies a 171% gain — meaningful room to come down on a strong offer.
Questions for the listing agent
- What do current leases actually rent for vs. the listed asking? Can we see a recent rent roll and the last 12 months of T-12 income?
- It's been on market 137 days. Have you received any prior offers? Is the seller open to a 28% concession, seller financing, or rate buy-down credit?
- Why hasn't it sold? Are there any deal-killer items the seller is aware of (foundation, flood, title, zoning, code violations)?
- Is there a deadline driving the sale (1031 exchange, divorce, estate, relocation)? That informs how much negotiation room exists.
- The area grade is low — what's the realistic commute time and amenity access for the typical tenant pool here? Any planned neighborhood developments (good or bad) we should know about?
- What's the average days-on-market for RENTAL listings here right now (not sales)? A rising rental-DOM trend means longer vacancies and softer asking-rent achievability than the comps imply.
- What's the recent tenant-quality profile in this submarket — average credit score on applications, eviction rate, late-payment / NSF rate, and stable-employment percentage? A property-management company in the area should have these aggregated.
- How much new for-sale + rental construction is in the pipeline within 1–3 miles? Heavy new supply typically softens prices + rents 12–24 months out; constrained supply supports both.
Investment metrics
- 1% rule
- 0.72% ✗
- Cap rate
- 5.85%
- Cash-on-cash
- -1.57%
- DSCR
- 0.93
- GRM
- 11.5
CMA / ARV
- ARV (median comp)
- $221,981
- List price
- $210,000
- Delta
- -5.40%
- Verdict
- FAIR
- Comps
- 20 within 1.0 mi
Show comp detail 7 sales within ~0.75 mi
| Address | Dist | Beds/Ba | Sqft | Sold | Price | $/sf | Match |
|---|---|---|---|---|---|---|---|
| 5220 Ormond Rd | 0.33mi | 3/1.5 | 1,488 (+4%) | 17mo | $229,500 | $154 | 61 |
| 4925 Lindholm Dr | 0.44mi | 3/1.5 | 1,431 (+0%) | 24mo | $299,900 | $210 | 57 |
| 4710 Deerfield Dr | 0.59mi | 3/2.0 | 1,424 (0%) | 18mo | $285,000 | $200 | 54 |
| 3724 Ravenwood St | 0.42mi | 3/2.0 | 1,456 (+2%) | 24mo | $30,000 | $21 | 53 |
| 4860 Lindholm Dr | 0.48mi | 3/1.5 | 1,224 (-14%) | 10mo | $260,000 | $212 | 44 |
| 5680 Eagle Rd | 0.33mi | 3/1.5 | 1,598 (+12%) | 23mo | $320,000 | $200 | 43 |
| 6132 Hickory Trl | 0.51mi | 3/2.0 | 1,275 (-10%) | 16mo | $35,500 | $28 | 42 |
Match score weights: distance 35% · size 25% · config 20% · recency 20%. Top-matched comps best support the ARV.
Projected returns pro-forma
-3.0% appreciation · 3.0% rent growth · sell at horizon
- IRR
- -18.9%
- Equity multiple
- 0.34×
- Total profit
- $-39,015
- Equity at exit
- $31,312
- IRR
- -11.6%
- Equity multiple
- 0.31×
- Total profit
- $-40,626
- Equity at exit
- $18,157
Cash invested: $58,800 (down + closing). Projections, not guarantees.
Landlord ↔ Tenant lean methodology
- Overall (STATE)
- 62 Landlord-Friendly
- State Michigan
- 62 Landlord-Friendly · EVEN
- County
- — inherits STATE
- City
- — inherits STATE
ZIP-level market 48383
- Active inventory
- 68
- Price-to-rent
- 11.5×
Monthly cashflow live
- Estimated rent
- $1,519 medium interval (Pro) →
- Mortgage (P&I)
- −$1,101
- Tax from tax record
- −$89 /mo · $1,062/yr
- Insurance
- −$88
- HOA
- −$0
- Vacancy / Maint / Mgmt
- −$319
- Net cashflow
- $-77
Break-even live
UW: 25.0% down · 7.5% · 30yr · 1.5% tax · 5.0% vac · 8.0% maint · 8.0% mgmt
Financing live
Cash to close
- Down payment
- $52,500
- Closing costs
- $6,300
- Reserves months
- —
- Total cash needed
- —
Loan-product check · same deal, 3 products live
Conventional
25% down · 7.5% · 30yr
- Down + closing
- —
- Monthly P&I
- —
- Monthly cashflow
- —
- DSCR
- —
- Eligible?
- —
Personal DTI + credit; lowest rate.
DSCR
20% down · 8.5% · 30yr
- Down + closing
- —
- Monthly P&I
- —
- Monthly cashflow
- —
- DSCR
- —
- Eligible?
- —
No personal income docs; deal must DSCR.
Hard money
10% down · 12.0% · 12mo
- Down + closing
- —
- Monthly P&I
- —
- Monthly cashflow
- —
- DSCR
- —
- Eligible?
- —
Short-term bridge; refi at stabilization.
Rent comps 3 comps
| Address | Beds | Baths | Sqft | Rent | $/sqft | DOM | Units | Dist |
|---|---|---|---|---|---|---|---|---|
| 3951 Bentwood Cir W White Lake, MI | 3.0 | 2.0 | 1456 | $1,399 | $0.96 | 1d | 1 | 0.31mi |
| 3202 Giddings Blvd Highland, MI | 3.0 | 2.0 | 1302 | $1,695 | $1.30 | 14d | 1 | 0.90mi |
| 3202 Giddings Blvd Highland, MI | 3.0 | 2.0 | 1417 | $1,695 | $1.20 | 10d | 1 | 0.90mi |
Listing history 20 events
-
2026-06-18days on market $210,000 Active 137 DOM
-
2026-06-17days on market $210,000 Active 136 DOM
-
2026-06-16days on market $210,000 Active 135 DOM
-
2026-06-15days on market $210,000 Active 134 DOM
-
2026-06-13days on market $210,000 Active 132 DOM
-
2026-06-13days on market $210,000 Active 131 DOM
-
2026-06-09days on market $210,000 Active 128 DOM
-
2026-06-08days on market $210,000 Active 127 DOM
-
2026-06-07days on market $210,000 Active 126 DOM
-
2026-06-04days on market $210,000 Active 123 DOM
-
2026-06-03days on market $210,000 Active 122 DOM
-
2026-06-02days on market $210,000 Active 121 DOM
-
2026-06-01days on market $210,000 Active 120 DOM
-
2026-05-31days on market $210,000 Active 119 DOM
-
2026-02-20price $210,000 83-char remark
Show marketing remark (83 chars)
Welcome to White Lake MI! This 3 bedroom 1 full bath tri-level home could be yours!
-
2026-02-19price $210,000 83-char remark
Show marketing remark (83 chars)
Welcome to White Lake MI! This 3 bedroom 1 full bath tri-level home could be yours!
-
2026-02-02$280,000 Active 83-char remark
Show marketing remark (83 chars)
Welcome to White Lake MI! This 3 bedroom 1 full bath tri-level home could be yours!
-
2026-02-02$280,000 Active 83-char remark
Show marketing remark (83 chars)
Welcome to White Lake MI! This 3 bedroom 1 full bath tri-level home could be yours!
-
2026-01-26historical $280,000 83-char remark
Show marketing remark (83 chars)
Welcome to White Lake MI! This 3 bedroom 1 full bath tri-level home could be yours!
-
1989-02-01soldstatus $77,500
ⓘ Source: listings_history table (triggers on properties + properties_extension) + one-shot
backfill from property_details.listing_events for pre-trigger history.
Tax reassessment forecast MI · Partial reset (capped growth)
- Current annual tax
- $1,062 · $89/mo
- Projected year-2 tax
- $2,148 · $179/mo
- Expected delta
- +$1,086/yr (+$90/mo · 102.3%)
ⓘ Screening estimate from a state-policy table — verify with the county assessor before closing.
Climate risk First Street
- Flood 1/10 Low FEMA zone X (unshaded) · 0% chance over 30 yrs
- Wildfire 1/10 Low
- Heat 2/10 Low 7 d/yr ≥95°F today · 15 d/yr by 30 yrs out
- Wind 2/10 Low
- Air quality 3/10 Moderate 2 unhealthy d/yr today · 3 by 30 yrs out
Nearby sold comps map
Loading sold comps map…
Walkable amenities ~0.75 mi
Loading nearby amenities…
Taxation est. · year 1
- Rental income
- $18,232
- − Mortgage interest
- −$11,763
- − Property taxes
- −$1,062
- − Insurance
- −$1,050
- − Repairs & maintenance
- −$1,459
- − Management
- −$1,459
- − Depreciation
- −$6,109
- Taxable loss
- −$4,669
- Est. tax savings @ 24.0%
- +$1,121
- After-tax cash flow
- $197/yr
For passive investors: Depreciation is non-cash, so a rental often shows a tax loss while cash-flowing — sheltering income. Rental losses are passive: they offset passive income freely, and up to $25,000/yr can offset ordinary (W-2) income if you actively participate and your MAGI is under $100k (phasing out to $0 by $150k); unused losses carry forward. On sale, claimed depreciation is recaptured at up to 25%, and gains may owe capital-gains tax (a 1031 exchange can defer both). Figures are a year-1 estimate at your 24.0% rate — not tax advice; consult a CPA.
Schools (NCES district)
- District
- Holly Area School District
- NCES district ID
- 2618450
- Math proficiency
- 31% ▼ -12.00%
- Reading proficiency
- 52% ▼ -7.00%
- Median HH income
- $65,137
- Composite
- 37.1/100
- National rank
- #4496
- State rank
- #165 of 540 in MI
Livability — White Lake
No livability data for this city. (Only ~50 U.S. cities are tracked.)
Census & demographics
- City population
- 17,856
- Population (ZIP)
- 13,291
Population outlook (Oakland County) Hauer SSP2
- Today (2025)
- 1,335,747 people
- By 2030
- 1,375,100 · +2.9%
- By 2040
- 1,435,385 · +7.5%
- By 2050
- 1,469,250 · +10.0%
- By 2075
- 1,531,946 · +14.7%
- By 2100
- 1,450,485 · +8.6%
Race, ethnicity, and origin ACS 2023
- Neighborhood character
- Predominantly White (90%)
- Race & ethnicity
- White 90% Two or more races 4% Black 4% Hispanic / Latino 2%
- Common ancestry
- Romanian 11% Lithuanian 5% Italian 4%
- Foreign-born
- 2% · Canada
- Languages at home
- 98% English-only · Spanish 1% Other Indo-European 1%
Political lean MEDSL · Oakland
- 2024 margin
- D (+10.6) · D 54.4% · R 43.8% · Other 1.9%
- 2008→2024 swing
- -3.9pp toward R · 2008: 14.5pp · 2024: 10.6pp
- All cycles
- 2024: D+10.6 2020: D+14.1 2016: D+8.1 2012: D+8.1 2008: D+14.5
Not yet ingested
- Civics
- —
Market trends
- HPI YoY
- ▼ -131.27%
- Current HPI
- 228.6088
- Rent YoY
- —
- Metro
- —
- State GDP YoY
- ▲ 1.37%
- F500 in state
- 28
Industry mix (Fortune 500 HQ in MI)
| Industry | F500 HQs | Revenue |
|---|---|---|
| Automotive Parts | 3 | $48B |
|
||
| Automotive | 2 | $372B |
|
||
| Chemicals | 1 | $45B |
|
||
| Automotive Retail | 1 | $29B |
|
||
| Healthcare / Medical Devices | 1 | $23B |
|
||
| Automotive Technology | 1 | $20B |
|
||
Price history
+171.0% since first listed6 events — show timeline
- 2026-02-20 Price Changed $210,000 MiRealSource-MiMLS
- 2026-02-19 Price Changed $210,000 REALCOMP
- 2026-02-02 Listed $280,000 MiRealSource-MiMLS
- 2026-02-02 Listed $280,000 REALCOMP
- 2026-01-26 Coming Soon $280,000 MiRealSource-MiMLS
- 1989-02-01 Sold (Public Records) $77,500 Public Records
Property tax history
-2.3%/yrLatest (2025): $1,062 · -41.1% YoY. Source: county tax records.
Cash-flow waterfall
monthlySold comps — $/sqft
last 12 mo · ≤1 miLoading sold comps…