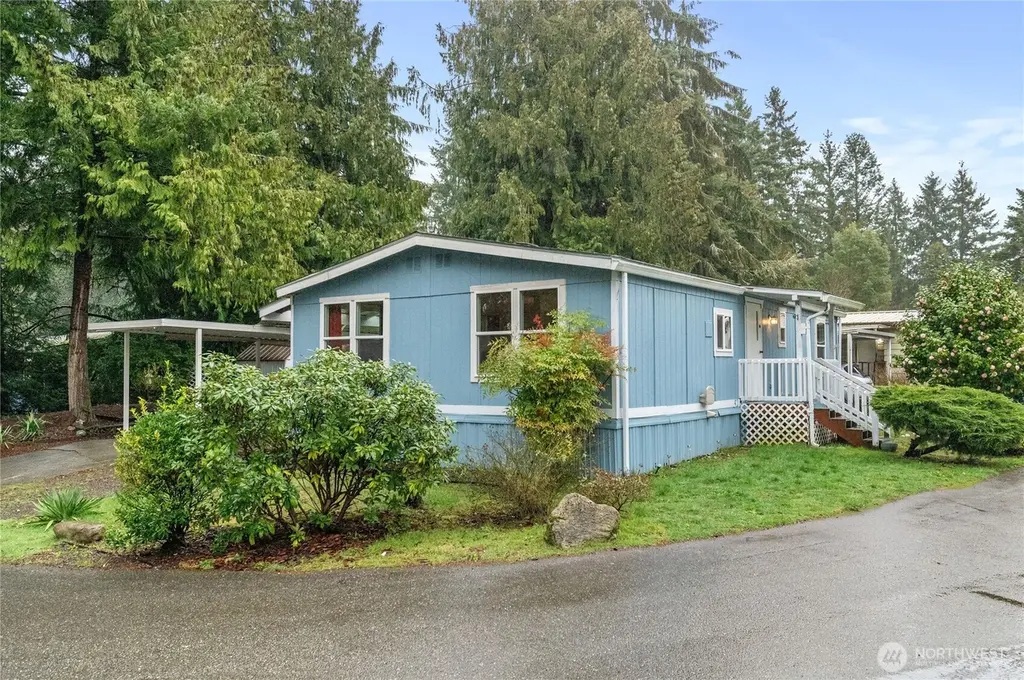
3060 NE McWilliams Rd #52 · Tracyton, WA
Flood risk 1/10 · Minimal
- FEMA flood zone
- X (unshaded)
- Chance of flooding over 30 yrs
- 0.0%
- Est. flood insurance / yr
- $507 – $1,088
Fire risk 3/10 · Minor
- Est. fire insurance / yr
- $604 – $1,122
Heat risk 3/10 · Minor
- Hot days now (above 86°F)
- 7 days/yr
- Hot days in 30 yrs
- 14 days/yr
Wind risk 1/10 · Minimal
- Chance of severe wind over 30 yrs
- —
Air-quality risk 7/10 · Major
- Unhealthy air days now
- 9 days/yr
- Unhealthy air days in 30 yrs
- 10 days/yr
Risk factors via First Street. Map © Google.
Why this score? — see what drove the C+ grade
The composite is a weighted blend of 9 inputs, each scored 0–100. Each bar is that input's sub-score; the figure is the points it added to the 100-point composite (weight × sub-score).
- Cash flow +30.0/30.0
- 1% rule +10.0/10.0
- DSCR +10.0/10.0
- Schools +5.5/10.0
- Livability +3.7/5.0
- Rent growth +2.6/5.0
- Condition / age +2.5/5.0
- ARV discount +0.0/15.0
- Appreciation +0.0/10.0
$120,000
🖨 Deal sheet 📄 Offer letter ✓ Due diligence
Listing remarks
Say hello to your Central Kitsap dream home! Nestled in a vibrant neighborhood with no age restrictions, this affordable home is move-in ready and waiting for its new owner. With two spacious bedrooms, two lovely baths (hot tub included!), and an open floor plan perfect for hosting friends, this light filled home is a true unexpected paradise. Enjoy cozy nights by the fire pit and sunny days in your garden beds. Ample parking for 3+ vehicles, carport and onsite storage space gives you space to spare! Easy financing options are available through a local bank. Don't miss out on this fantastic opportunity to make this corner lot beauty yours!
Key facts
- Open floor plan
- Ample parking
- Garden beds
Tags
Neighborhood map
What this means for you Summary
Snapshot
- This is a 2-bed/2.0-bath manufactured listed at $120k.
Deal economics
- At list price, monthly cash flow is $783 ($9k/yr) — positive.
- The deal already cash-flows at list — no discount required.
- Meets the 1% rule at list price ($2k rent vs $120k).
- Recommended offer: $109k (9.0% below list) — sets the bar for market timing.
- Cap rate 14.1% vs local median 3.7% in Tracyton — top-decile yield for the area; either an underpriced asset or a hidden risk that comps aren't pricing in. Stress-test before assuming the spread holds.
Location & tenants
- Location reads 73/100 on livability (#193 in WA) — a middle-class / working-renter tenant base. Strengths: employment A+, housing A+, health & safety A+; Watch: schools D+, cost of living D+, amenities F.
- Central Kitsap School District (urban): math 55% / reading 67% proficiency, ranked #49 of 291 in WA (top 17%) — acceptable for families but not a draw, mixed tenant base, ~2y average lease.
- Market conditions: Rents flat; 151 active listings in the ZIP; 9 comparable units currently listed for rent nearby; rentals leasing fast (median 14d on market — plan ~1-2 weeks tenant-placement turnaround); solid renter incomes; 1,294 units permitted in Kitsap County in 2024 (302 in 5+ unit buildings).
Forward outlook
- Local home prices are declining (-3.0%/yr); year-one equity from $830 of loan paydown is wiped out by about $4k of value loss. Plan a longer hold.
- Kitsap County population projected at +8% by 2050 — modest demand growth; plan on rents tracking national, not racing it.
- At projected returns (-3.0% appreciation + 0.3% rent growth), your $34k cash investment doubles in ~5 years — after that, you're playing with house money.
Negotiation context
- It's been on market 96 days — a 9% lower offer ($109k) is reasonable based on typical stale-listing flexibility.
- 3 sale attempts since 16y ago; this cycle's ask has dropped $20k (14%) from the opening price — seller is motivated, your offer sets the floor, not the list.
- Current owner paid $46k; list at $120k implies a 164% gain — meaningful room to come down on a strong offer.
Questions for the listing agent
- It's been on market 96 days. Have you received any prior offers? Is the seller open to a 9% concession, seller financing, or rate buy-down credit?
- Built in 1979 — when were the roof, HVAC, electrical panel, plumbing, and water heater last replaced?
- Why hasn't it sold? Are there any deal-killer items the seller is aware of (foundation, flood, title, zoning, code violations)?
- Is there a deadline driving the sale (1031 exchange, divorce, estate, relocation)? That informs how much negotiation room exists.
- Schools are D-rated, which usually means shorter tenancies and higher turnover. Who's the typical renter profile here, and what's been the actual vacancy rate?
- What's the average days-on-market for RENTAL listings here right now (not sales)? A rising rental-DOM trend means longer vacancies and softer asking-rent achievability than the comps imply.
- What's the recent tenant-quality profile in this submarket — average credit score on applications, eviction rate, late-payment / NSF rate, and stable-employment percentage? A property-management company in the area should have these aggregated.
- How much new for-sale + rental construction is in the pipeline within 1–3 miles? Heavy new supply typically softens prices + rents 12–24 months out; constrained supply supports both.
Investment metrics
- 1% rule
- 1.70% ✓
- Cap rate
- 14.12%
- Cash-on-cash
- 27.97%
- DSCR
- 2.24
- GRM
- 4.9
CMA / ARV
- ARV (median comp)
- $96,208
- List price
- $120,000
- Delta
- 24.73%
- Verdict
- OVERPRICED
- Comps
- 8 within 1.0 mi
Show comp detail 7 sales within ~0.75 mi
| Address | Dist | Beds/Ba | Sqft | Sold | Price | $/sf | Match |
|---|---|---|---|---|---|---|---|
| 3060 NE McWilliams Rd #52 | 0.00mi | 2/2.0 | 960 (0%) | 0mo | $120,000 | $125 | 100 |
| 3060 NE McWilliams Rd | 0.10mi | 2/1.5 | 924 (-4%) | 7mo | $70,000 | $76 | 81 |
| 3060 NE McWilliams Rd #25 | 0.00mi | 2/2.0 | 930 (-3%) | 19mo | $80,000 | $86 | 79 |
| 3060 NE McWilliams Rd #36 | 0.00mi | 2/1.0 | 840 (-12%) | 18mo | $30,000 | $36 | 60 |
| 3060 NE McWillams Rd #115 | 0.00mi | 3/1.0 (+1) | 1,056 (+10%) | 20mo | $140,000 | $133 | 57 |
| 3380 NE 3rd St #12 | 0.34mi | 2/2.0 | 1,008 (+5%) | 24mo | $85,000 | $84 | 56 |
| 3380 NE 3rd St N #29 | 0.34mi | 3/2.0 (+1) | 1,080 (+12%) | 4mo | $165,000 | $153 | 55 |
Match score weights: distance 35% · size 25% · config 20% · recency 20%. Top-matched comps best support the ARV.
Projected returns pro-forma
-3.0% appreciation · 0.27% rent growth · sell at horizon
- IRR
- 19.0%
- Equity multiple
- 1.74×
- Total profit
- $25,008
- Equity at exit
- $17,892
- IRR
- 25.4%
- Equity multiple
- 2.93×
- Total profit
- $64,926
- Equity at exit
- $10,375
Cash invested: $33,600 (down + closing). Projections, not guarantees.
Landlord ↔ Tenant lean methodology
- Overall (STATE)
- 28 Tenant-Leaning
- State Washington
- 28 Tenant-Leaning · D+8
- County
- — inherits STATE
- City
- — inherits STATE
ZIP-level market 98311
- Rents YoY
- 0.3%
- Active inventory
- 151
- Price-to-rent
- 4.9×
Monthly cashflow live
- Estimated rent
- $2,041 high interval (Pro) →
- Mortgage (P&I)
- −$629
- Tax est. 1.5%
- −$150 /mo · $1,800/yr
- Insurance
- −$50
- HOA
- −$0
- Vacancy / Maint / Mgmt
- −$429
- Net cashflow
- $783
Break-even live
UW: 25.0% down · 7.5% · 30yr · 1.5% tax · 5.0% vac · 8.0% maint · 8.0% mgmt
Financing live
Cash to close
- Down payment
- $30,000
- Closing costs
- $3,600
- Reserves months
- —
- Total cash needed
- —
Loan-product check · same deal, 3 products live
Conventional
25% down · 7.5% · 30yr
- Down + closing
- —
- Monthly P&I
- —
- Monthly cashflow
- —
- DSCR
- —
- Eligible?
- —
Personal DTI + credit; lowest rate.
DSCR
20% down · 8.5% · 30yr
- Down + closing
- —
- Monthly P&I
- —
- Monthly cashflow
- —
- DSCR
- —
- Eligible?
- —
No personal income docs; deal must DSCR.
Hard money
10% down · 12.0% · 12mo
- Down + closing
- —
- Monthly P&I
- —
- Monthly cashflow
- —
- DSCR
- —
- Eligible?
- —
Short-term bridge; refi at stabilization.
Rent comps 9 comps
| Address | Beds | Baths | Sqft | Rent | $/sqft | DOM | Units | Dist |
|---|---|---|---|---|---|---|---|---|
| 6056 Illahee Rd NE Unit A Bremerton, WA | 2.0 | 1.0 | 711 | $1,850 | $2.60 | 43d | 1 | 0.71mi |
| 1970 NE Fuson Rd Bremerton, WA | 1.0–2.0 | 1.0–2.0 | 676 | $2,297 | $3.40 | 13d | 12 | 0.87mi |
| 6101 Washington 303 Bremerton, WA | 1.0–3.0 | 1.0–2.0 | 1010 | $2,378 | $2.35 | 13d | 70 | 1.01mi |
| 1231 NE McWilliams Rd Bremerton, WA | 1.0–3.0 | 1.0–2.0 | 961 | $2,227 | $2.32 | 13d | 26 | 1.05mi |
| 1381 NE Fairgrounds Rd Bremerton, WA | 1.0–3.0 | 1.0–2.0 | 949 | $2,022 | $2.13 | 13d | 14 | 1.19mi |
| 1911 NE Riddell Rd Bremerton, WA | 2.0 | 1.0–2.0 | 858 | $1,980 | $2.31 | 13d | 10 | 1.31mi |
| 5180 Gibson Ln NE Unit B204 Bremerton, WA | 1.0 | 1.0 | 708 | $1,745 | $2.46 | 43d | 1 | 1.31mi |
| 5163 NE Mariah Ln Bremerton, WA | 1.0–2.0 | 1.0 | 821 | $1,895 | $2.31 | 13d | 2 | 1.36mi |
| 1823 NE Rustic Ln Bremerton, WA | 1.0 | 1.0 | 814 | $1,850 | $2.27 | 43d | 1 | 1.44mi |
Listing history 13 events
-
2026-05-10status Pending
-
2026-05-07price $120,000
-
2026-04-28price $130,000
-
2026-04-15price $135,000
-
2026-03-11price $137,500
-
2026-02-03$140,000 Active
-
2020-03-25soldstatus $45,500 Sold
-
2020-03-19status Pending
-
2020-03-14status Pending Inspection
-
2020-03-05$50,000 Active
-
2011-08-15soldstatus $14,000 Sold
-
2011-07-31status Pending
-
2010-11-20$17,000 Active
ⓘ Source: listings_history table (triggers on properties + properties_extension) + one-shot
backfill from property_details.listing_events for pre-trigger history.
Climate risk First Street
- Flood 1/10 Low FEMA zone X (unshaded) · 0% chance over 30 yrs
- Wildfire 3/10 Moderate
- Heat 3/10 Moderate 7 d/yr ≥86°F today · 14 d/yr by 30 yrs out
- Wind 1/10 Low
- Air quality 7/10 Severe 9 unhealthy d/yr today · 10 by 30 yrs out
Nearby sold comps map
Loading sold comps map…
Walkable amenities ~0.75 mi
Loading nearby amenities…
Taxation est. · year 1
- Rental income
- $24,493
- − Mortgage interest
- −$6,722
- − Property taxes
- −$1,800
- − Insurance
- −$600
- − Repairs & maintenance
- −$1,959
- − Management
- −$1,959
- − Depreciation
- −$3,491
- Taxable income
- $7,961
- Est. tax owed @ 24.0%
- −$1,911
- After-tax cash flow
- $7,487/yr
For passive investors: Depreciation is non-cash, so a rental often shows a tax loss while cash-flowing — sheltering income. Rental losses are passive: they offset passive income freely, and up to $25,000/yr can offset ordinary (W-2) income if you actively participate and your MAGI is under $100k (phasing out to $0 by $150k); unused losses carry forward. On sale, claimed depreciation is recaptured at up to 25%, and gains may owe capital-gains tax (a 1031 exchange can defer both). Figures are a year-1 estimate at your 24.0% rate — not tax advice; consult a CPA.
Schools (NCES district)
- District
- Central Kitsap School District
- NCES district ID
- 5301080
- Math proficiency
- 55% ▲ 1.00%
- Reading proficiency
- 67% ▬ 0.00%
- Median HH income
- $64,825
- Composite
- 54.87/100
- National rank
- #2813
- State rank
- #49 of 291 in WA
Livability — Tracyton
- Score
- 73/100
- State rank
- #193
- US rank
- #5240
Category grades
Schools grade is shown separately in the Schools card above.
Census & demographics
- County
- Kitsap County · 243,099 people
- Metro
- Bremerton-Silverdale-Port Orchard, WA
- Population (ZIP)
- 28,168
- Household income
- $108,757
- Rent vs Own
- Severe rent burden
- 502.0
Population outlook (Kitsap County) Hauer SSP2
- Today (2025)
- 277,525 people
- By 2030
- 285,040 · +2.7%
- By 2040
- 294,957 · +6.3%
- By 2050
- 300,622 · +8.3%
- By 2075
- 315,580 · +13.7%
- By 2100
- 304,340 · +9.7%
Race, ethnicity, and origin ACS 2023
- Neighborhood character
- Predominantly White (67%)
- Race & ethnicity
- White 67% Two or more races 14% Hispanic / Latino 9% Asian 9% Black 3% Pacific Islander 2%
- Hispanic origin (detail)
- Mexican 6%
- Common ancestry
- Portuguese 4% Italian 4% Slovak 3%
- Foreign-born
- 9% · Canada, Vietnam, China
- Languages at home
- 89% English-only · Tagalog/Filipino 4% Spanish 3% Vietnamese 2%
Political lean MEDSL · Kitsap
- 2024 margin
- Strong D (+20.9) · D 58.8% · R 37.9% · Other 3.3%
- 2008→2024 swing
- +8.6pp toward D · 2008: 12.3pp · 2024: 20.9pp
- All cycles
- 2024: D+20.9 2020: D+18.1 2016: D+11.6 2012: D+11.1 2008: D+12.3
Not yet ingested
- Civics
- —
Market trends
- HPI YoY
- ▼ -378.18%
- Current HPI
- 356.6272
- Rent YoY
- ▲ 0.27%
- Metro
- Bremerton-Silverdale-Port Orchard, WA
- State GDP YoY
- ▲ 4.65%
- F500 in state
- 22
Industry mix (Fortune 500 HQ in WA)
| Industry | F500 HQs | Revenue |
|---|---|---|
| Retail | 2 | $269B |
|
||
| Technology / Retail | 1 | $638B |
|
||
| Technology | 1 | $245B |
|
||
| Telecommunications | 1 | $38B |
|
||
| Food / Beverage | 1 | $36B |
|
||
| Automotive / Trucks | 1 | $34B |
|
||
Price history
+605.9% since first listed13 events — show timeline
- 2026-05-10 Pending — NWMLS as Distributed by MLS Grid
- 2026-05-07 Price Changed $120,000 NWMLS as Distributed by MLS Grid
- 2026-04-28 Price Changed $130,000 NWMLS as Distributed by MLS Grid
- 2026-04-15 Price Changed $135,000 NWMLS as Distributed by MLS Grid
- 2026-03-11 Price Changed $137,500 NWMLS as Distributed by MLS Grid
- 2026-02-03 Listed $140,000 NWMLS as Distributed by MLS Grid
- 2020-03-25 Sold (MLS) $45,500 NWMLS as Distributed by MLS Grid
- 2020-03-19 Pending — NWMLS as Distributed by MLS Grid
- 2020-03-14 Pending — NWMLS as Distributed by MLS Grid
- 2020-03-05 Listed $50,000 NWMLS as Distributed by MLS Grid
- 2011-08-15 Sold (MLS) $14,000 NWMLS as Distributed by MLS Grid
- 2011-07-31 Pending — NWMLS as Distributed by MLS Grid
- 2010-11-20 Listed $17,000 NWMLS as Distributed by MLS Grid
Cash-flow waterfall
monthlySold comps — $/sqft
last 12 mo · ≤1 miLoading sold comps…