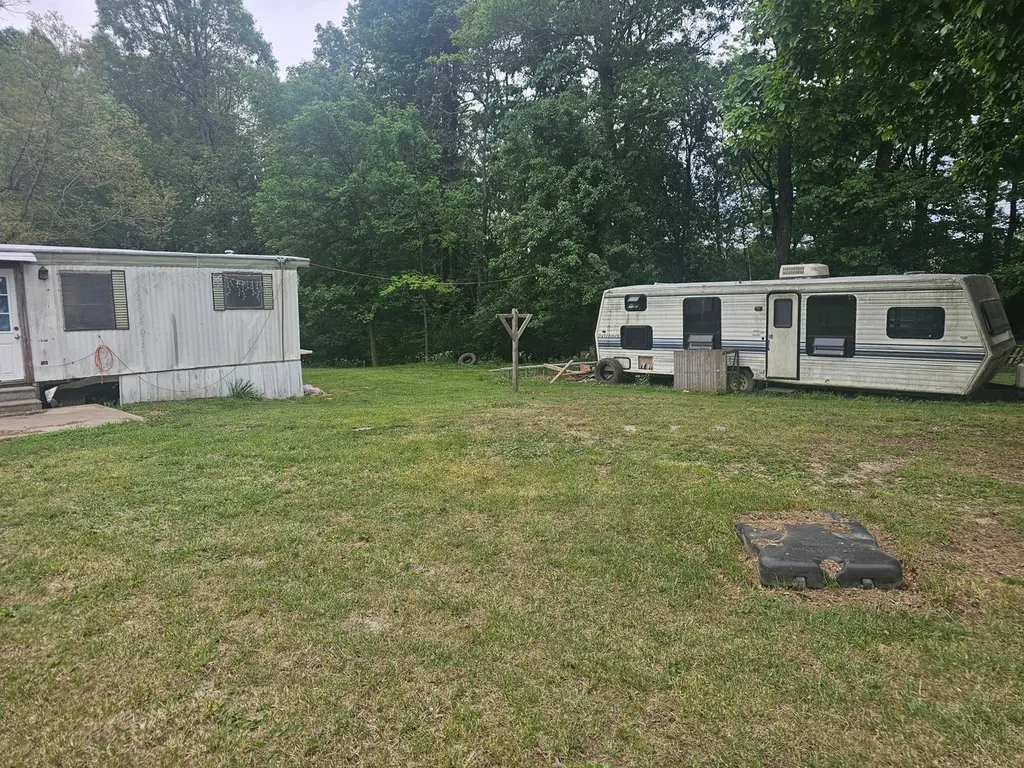
506 Blue Door Rd · Portland, TN
Flood risk 1/10 · Minimal
- FEMA flood zone
- X (unshaded)
- Chance of flooding over 30 yrs
- 0.0%
- Est. flood insurance / yr
- $507 – $1,088
Fire risk 3/10 · Minor
- Est. fire insurance / yr
- $949 – $1,763
Heat risk 5/10 · Moderate
- Hot days now (above 105°F)
- 7 days/yr
- Hot days in 30 yrs
- 20 days/yr
Wind risk 4/10 · Minor
- Chance of severe wind over 30 yrs
- 10.0%
Air-quality risk 2/10 · Minimal
- Unhealthy air days now
- 1 days/yr
- Unhealthy air days in 30 yrs
- 3 days/yr
Risk factors via First Street. Map © Google.
Why this score? — see what drove the B- grade
The composite is a weighted blend of 9 inputs, each scored 0–100. Each bar is that input's sub-score; the figure is the points it added to the 100-point composite (weight × sub-score).
- Cash flow +30.0/30.0
- 1% rule +10.0/10.0
- DSCR +10.0/10.0
- ARV discount +7.5/15.0
- Schools +3.6/10.0
- Livability +3.3/5.0
- Rent growth +2.5/5.0
- Condition / age +2.5/5.0
- Appreciation +0.0/10.0
$64,900
🖨 Deal sheet (PDF) 📄 Offer letter ✓ Due diligence
Listing remarks
Attention investors and DIY enthusiasts! Multiple exit strategies: finish this remodel then either flip, rent or move in! Home being sold as is. Cash preferred but will consider financed all offers. Seller is assisted by an Attorney in Fact. Do not knock on door or approach house without prior communication.
Key facts
- 1 acre lot
- Built 1972
- Listed 7 days
Property features AI
Finance
- Financial info: $219 annual tax (amount provided)
Exterior
- Parking: No covered parking noted; No designated parking total listed
- Utilities: Public water; Public sewer; Water available
- Home design: Residential mobile home; One level; 720 square feet living area
- Construction: Other construction materials; Existing (year built details not specified)
- Exterior features: 1-acre lot
Interior
- Kitchen: No appliances listed
- Bedrooms: 2 bedrooms (both on the main level)
- Flooring: Other
- Bathrooms: 1 full bathroom
- Heating & cooling: Central heating; Central air conditioning
- Interior features: No basement; Other flooring
- Laundry & utility: No laundry appliances listed
Neighborhood map
What this means for you Summary
Snapshot
- This is a 2-bed/1.0-bath other listed at $65k.
Deal economics
- At list price, monthly cash flow is $583 ($7k/yr) — positive.
- The deal already cash-flows at list — no discount required.
- Meets the 1% rule at list price ($1k rent vs $65k).
- Cap rate 17.1% vs local median 3.6% in Portland — top-decile yield for the area; either an underpriced asset or a hidden risk that comps aren't pricing in. Stress-test before assuming the spread holds.
Location & tenants
- Location reads 66/100 on livability (#122 in TN) — a middle-class / working-renter tenant base. Strengths: cost of living A+, housing A+; Watch: amenities F, commute F, health & safety F.
- Sumner County (suburban): math 44% / reading 39% proficiency, ranked #12 of 139 in TN (top 9%) — families likely to look elsewhere, expect single-tenant / working-renter base with shorter leases.
- Zoned schools: Watt Hardison Elementary (math 37% / reading 37%, grade F, #272 of 952 statewide, top 31%, 445 students, 0% FRL); Portland High School (math 17% / reading 30%, grade F, #145 of 332 statewide, top 44%, 1,199 students, 0% FRL) — zoned schools average 0% FRL vs 34% district-wide (34 pts lower); this property's tenant base skews higher-income than the district average.
- Market conditions: 305 active listings in the ZIP; solid renter incomes; 1,748 units permitted in Sumner County in 2024 (124 in 5+ unit buildings).
Forward outlook
- Local home prices are declining (-3.0%/yr); year-one equity from $449 of loan paydown is wiped out by about $2k of value loss. Plan a longer hold.
- Sumner County population projected at +35% by 2050 — long-run rental-demand tailwind backs the buy-and-hold thesis.
- At projected returns (-3.0% appreciation + 3.0% rent growth), your $18k cash investment doubles in ~4 years — after that, you're playing with house money.
Negotiation context
- Only 8 days on market — expect competitive offers; lowballing is unlikely to land.
- 2 sale attempts with the ask held roughly flat each time — persistent listings suggest the price (not the market) is what's stuck; bring a comps-based counter.
Risks & watch-outs
- Climate carrying-cost: extreme-heat days projected 7→20/yr by 2055 (HVAC capex compounding) — expect insurance premiums to compound above CPI over the hold.
Questions for the listing agent
- Built in 1972 — when were the roof, HVAC, electrical panel, plumbing, and water heater last replaced?
- Is there a deadline driving the sale (1031 exchange, divorce, estate, relocation)? That informs how much negotiation room exists.
- Schools are D-rated, which usually means shorter tenancies and higher turnover. Who's the typical renter profile here, and what's been the actual vacancy rate?
- What's the average days-on-market for RENTAL listings here right now (not sales)? A rising rental-DOM trend means longer vacancies and softer asking-rent achievability than the comps imply.
- What's the recent tenant-quality profile in this submarket — average credit score on applications, eviction rate, late-payment / NSF rate, and stable-employment percentage? A property-management company in the area should have these aggregated.
- How much new for-sale + rental construction is in the pipeline within 1–3 miles? Heavy new supply typically softens prices + rents 12–24 months out; constrained supply supports both.
Investment metrics
- 1% rule
- 1.89% ✓
- Cap rate
- 17.07%
- Cash-on-cash
- 38.47%
- DSCR
- 2.71
- GRM
- 4.4
CMA / ARV
No comps found within radius.
Projected returns pro-forma
-3.0% appreciation · 3.0% rent growth · sell at horizon
- IRR
- 34.6%
- Equity multiple
- 2.46×
- Total profit
- $26,569
- Equity at exit
- $9,677
- IRR
- 41.4%
- Equity multiple
- 4.90×
- Total profit
- $70,833
- Equity at exit
- $5,611
Cash invested: $18,172 (down + closing). Projections, not guarantees.
Landlord ↔ Tenant lean methodology
- Overall (STATE)
- 87 Strongly Landlord-Friendly
- State Tennessee
- 87 Strongly Landlord-Friendly · R+13
- County
- — inherits STATE
- City
- — inherits STATE
ZIP-level market 37148
- Home prices YoY
- -22.2%
- Active inventory
- 305
- Price-to-rent
- 4.4×
Monthly cashflow live
- Estimated rent
- $1,226 medium interval (Pro) →
- Mortgage (P&I)
- −$340
- Tax from tax record
- −$18 /mo · $219/yr
- Insurance
- −$27
- HOA
- −$0
- Vacancy / Maint / Mgmt
- −$257
- Net cashflow
- $583
Break-even live
Sensitivity live
| Price | -10% $619 | -5% $601 | +0% $583 | +5% $564 | +10% $546 |
|---|---|---|---|---|---|
| Rent | -10% $486 | -5% $534 | +0% $583 | +5% $631 | +10% $679 |
| Rate | -1.0pp $615 | -0.5pp $599 | base $583 | +0.5pp $566 | +1.0pp $549 |
UW: 25.0% down · 7.5% · 30yr · 1.5% tax · 5.0% vac · 8.0% maint · 8.0% mgmt
Financing live
Cash to close
- Down payment
- $16,225
- Closing costs
- $1,947
- Reserves months
- —
- Total cash needed
- —
Loan-product check · same deal, 3 products live
Conventional
25% down · 7.5% · 30yr
- Down + closing
- —
- Monthly P&I
- —
- Monthly cashflow
- —
- DSCR
- —
- Eligible?
- —
Personal DTI + credit; lowest rate.
DSCR
20% down · 8.5% · 30yr
- Down + closing
- —
- Monthly P&I
- —
- Monthly cashflow
- —
- DSCR
- —
- Eligible?
- —
No personal income docs; deal must DSCR.
Hard money
10% down · 12.0% · 12mo
- Down + closing
- —
- Monthly P&I
- —
- Monthly cashflow
- —
- DSCR
- —
- Eligible?
- —
Short-term bridge; refi at stabilization.
Listing history 5 events
-
2026-06-21days on market $64,900 Active 8 DOM
-
2026-06-18days on market $64,900 Active 5 DOM
-
2026-06-17statusdays on market $64,900 Active 4 DOM
-
2026-05-04status Pending 309-char remark
-
2026-05-01$64,900 Active 309-char remark
ⓘ Source: listings_history table (triggers on properties + properties_extension) + one-shot
backfill from property_details.listing_events for pre-trigger history.
Tax reassessment forecast TN · Resets to sale price
- Current annual tax
- $219 · $18/mo
- Projected year-2 tax
- $461 · $38/mo
- Expected delta
- +$242/yr (+$20/mo · 110.4%)
ⓘ Screening estimate from a state-policy table — verify with the county assessor before closing.
Climate risk First Street
- Flood 1/10 Low FEMA zone X (unshaded) · 0% chance over 30 yrs
- Wildfire 3/10 Moderate
- Heat 5/10 Major 7 d/yr ≥105°F today · 20 d/yr by 30 yrs out
- Wind 4/10 Moderate 10% chance of damaging wind over 30 yrs
- Air quality 2/10 Low 1 unhealthy d/yr today · 3 by 30 yrs out
Nearby sold comps map
Loading sold comps map…
Walkable amenities ~0.75 mi
Loading nearby amenities…
Taxation est. · year 1
- Rental income
- $14,707
- − Mortgage interest
- −$3,635
- − Property taxes
- −$219
- − Insurance
- −$324
- − Repairs & maintenance
- −$1,177
- − Management
- −$1,177
- − Depreciation
- −$1,888
- Taxable income
- $6,287
- Est. tax owed @ 24.0%
- −$1,509
- After-tax cash flow
- $5,482/yr
For passive investors: Depreciation is non-cash, so a rental often shows a tax loss while cash-flowing — sheltering income. Rental losses are passive: they offset passive income freely, and up to $25,000/yr can offset ordinary (W-2) income if you actively participate and your MAGI is under $100k (phasing out to $0 by $150k); unused losses carry forward. On sale, claimed depreciation is recaptured at up to 25%, and gains may owe capital-gains tax (a 1031 exchange can defer both). Figures are a year-1 estimate at your 24.0% rate — not tax advice; consult a CPA.
Schools (NCES district)
- District
- Sumner County
- NCES district ID
- 4704020
- Math proficiency
- 44% ▼ -11.00%
- Reading proficiency
- 39% ▼ -5.00%
- Median HH income
- $56,998
- Composite
- 36.44/100
- National rank
- #4667
- State rank
- #12 of 139 in TN
Livability — Portland
- Score
- 66/100
- State rank
- #122
- US rank
- #11795
Category grades
Schools grade is shown separately in the Schools card above.
Census & demographics
- County
- Sumner County · 196,654 people
- City population
- 26,274
- Metro
- Nashville-Davidson--Murfreesboro--Franklin, TN
- Population (ZIP)
- 26,274
- Household income
- $81,633
- Rent vs Own
- Severe rent burden
- 319.0
Population outlook (Sumner County) Hauer SSP2
- Today (2025)
- 208,284 people
- By 2030
- 223,902 · +7.5%
- By 2040
- 253,892 · +21.9%
- By 2050
- 281,199 · +35.0%
- By 2075
- 344,866 · +65.6%
- By 2100
- 384,369 · +84.5%
Race, ethnicity, and origin ACS 2023
- Neighborhood character
- Predominantly White (89%)
- Race & ethnicity
- White 89% Hispanic / Latino 6% Two or more races 4% Black 3%
- Hispanic origin (detail)
- Mexican 3%
- Common ancestry
- Italian 3% Serbian 2% Slovak 2%
- Foreign-born
- 3% · Canada
- Languages at home
- 95% English-only · Spanish 5%
Political lean MEDSL · Sumner
- 2024 margin
- Solid R (+41.8) · D 28.5% · R 70.3% · Other 1.1%
- 2008→2024 swing
- -6.9pp toward R · 2008: -34.9pp · 2024: -41.8pp
- All cycles
- 2024: R+41.8 2020: R+38.6 2016: R+45.0 2012: R+42.0 2008: R+34.9
Not yet ingested
- Civics
- —
Market trends
- HPI YoY
- ▼ -90.34%
- Current HPI
- 315.8252
- Rent YoY
- —
- Metro
- Nashville-Davidson--Murfreesboro--Franklin, TN
- State GDP YoY
- ▲ 2.78%
- F500 in state
- 22
Industry mix (Fortune 500 HQ in TN)
| Industry | F500 HQs | Revenue |
|---|---|---|
| Healthcare | 3 | $91B |
|
||
| Retail | 3 | $72B |
|
||
| Transportation / Logistics | 1 | $88B |
|
||
| Paper / Packaging | 1 | $19B |
|
||
| Insurance | 1 | $13B |
|
||
| Energy | 1 | $12B |
|
||
Price history
3 events — show timeline
- 2026-06-16 Relisted — REALTRACS as Distributed by MLS Grid
- 2026-05-04 Pending — REALTRACS as Distributed by MLS Grid
- 2026-05-01 Listed $64,900 REALTRACS as Distributed by MLS Grid
Property tax history
+5.2%/yrLatest (2025): $219 · +0.0% YoY. Source: county tax records.
Cash-flow waterfall
monthlySold comps — $/sqft
last 12 mo · ≤1 miLoading sold comps…