185 Private Road 4437 · New Fairview, TX
Flood risk 1/10 · Minimal
- FEMA flood zone
- X (unshaded)
- Chance of flooding over 30 yrs
- 0.0%
- Est. flood insurance / yr
- $507 – $1,088
Fire risk 7/10 · Major
- Est. fire insurance / yr
- $1,222 – $2,270
Heat risk 7/10 · Major
- Hot days now (above 109°F)
- 7 days/yr
- Hot days in 30 yrs
- 22 days/yr
Wind risk 6/10 · Moderate
- Chance of severe wind over 30 yrs
- 27.0%
Air-quality risk 2/10 · Minimal
- Unhealthy air days now
- 1 days/yr
- Unhealthy air days in 30 yrs
- 2 days/yr
Risk factors via First Street. Map © Google.
Why this score? — see what drove the B grade
The composite is a weighted blend of 9 inputs, each scored 0–100. Each bar is that input's sub-score; the figure is the points it added to the 100-point composite (weight × sub-score).
- Cash flow +22.4/30.0
- ARV discount +15.0/15.0
- Appreciation +10.0/10.0
- DSCR +7.2/10.0
- 1% rule +5.8/10.0
- Schools +3.6/10.0
- Livability +3.1/5.0
- Rent growth +2.5/5.0
- Condition / age +2.5/5.0
$190,000
🖨 Deal sheet (PDF) 📄 Offer letter ✓ Due diligence
Listing remarks
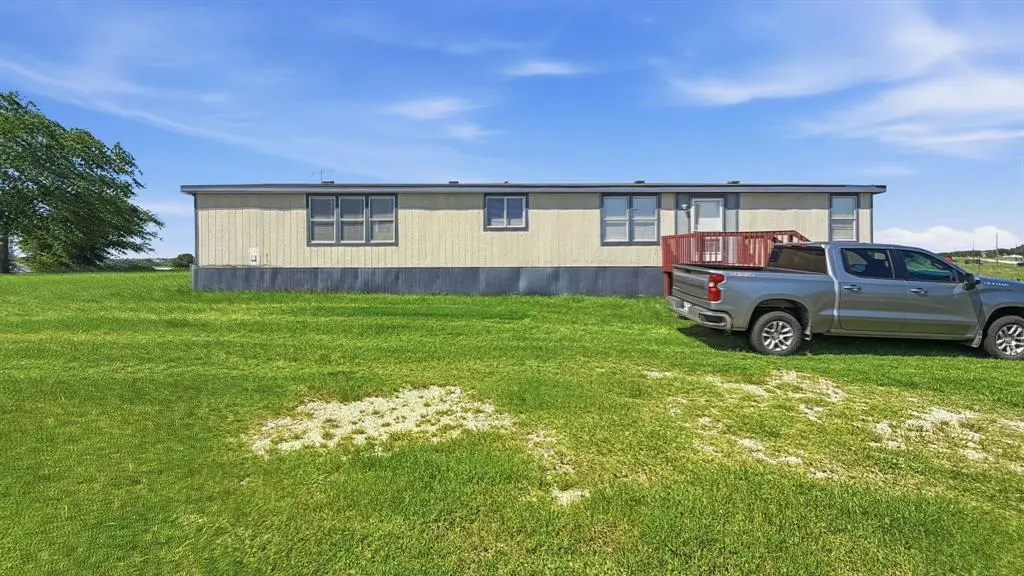
Two living areas, a bright breakfast area, an open kitchen with breakfast bar, and a split-bedroom layout are just some of the features of this spacious 3-bedroom, 2-bath home situated on 1.4 acres. With its large open floor plan and generous living space, this home offers endless potential. A little cosmetic updating will make this hilltop property truly shine, complete with beautiful sunset views and plenty of room to enjoy peaceful country living. BUYER TO VERIFY ALL INFORMATION
Key facts
- Split-bedroom layout
- Breakfast area
- Open kitchen
Tags
Property features AI
Finance
- Other: Property listed as residential manufactured home; Subdivision: Hills Oliver Creek; County: Wise
- Financial info: Listing terms include Cash, Conventional, FHA, VA
- HOA & community: No homeowners association
Exterior
- Parking: Driveway parking; Off-street parking; Gravel surface; Oversized (no garage, no covered/carport spaces)
- Utilities: City water; Septic; Cable available; All-weather road access; Asphalt access
- Home design: Manufactured home; One story; Property is attached
- Construction: Built in 2004; Siding exterior; Composition roof; Pillar/post/pier foundation
- Exterior features: Covered deck; Covered porch/deck; Large backyard with grass; Acreage lot (approximately 1.42 acres); Wire and other fencing
Interior
- Kitchen: Electric range; Microwave; Eat-in kitchen layout
- Bedrooms: 3 bedrooms; Primary bedroom on main level with separate shower and walk-in closet
- Flooring: Carpet; Laminate
- Bathrooms: 2 full bathrooms
- Heating & cooling: Central heating; Central air; Ceiling fan(s)
- Interior features: Open floorplan; Vaulted ceiling(s); Double vanity; Eat-in kitchen; Paneling; Cable TV available; High speed internet available; Window coverings
- Laundry & utility: Full-size washer/dryer area; Utility room; Electric dryer hookup
Neighborhood map
What this means for you Summary
Snapshot
- This is a 3-bed/2.0-bath manufactured listed at $190k.
Deal economics
- At list price, monthly cash flow is $317 ($4k/yr) — positive.
- The deal already cash-flows at list — no discount required.
- Meets the 1% rule at list price ($2k rent vs $190k).
- Cap rate 8.3% vs local median 2.5% in New Fairview — top-decile yield for the area; either an underpriced asset or a hidden risk that comps aren't pricing in. Stress-test before assuming the spread holds.
Location & tenants
- Location reads 62/100 on livability (#901 in TX) — a middle-class / working-renter tenant base. Strengths: employment A+, cost of living A+, housing A+; Watch: amenities F, commute F, health & safety F.
- Decatur ISD (town): math 40% / reading 42% proficiency, ranked #323 of 826 in TX (top 39%) — families likely to look elsewhere, expect single-tenant / working-renter base with shorter leases.
- Zoned schools: Carson El (math 37% / reading 38%, grade F, #1,744 of 4,322 statewide, top 41%, 548 students, 44% FRL) — zoned schools at 44% FRL track the district average.
- Market conditions: 263 active listings in the ZIP; solid renter incomes; 460 units permitted in Wise County in 2024 (243 in 5+ unit buildings).
Forward outlook
- In year one you build about $20k of equity ($1k loan paydown + $19k appreciation (10.0% local appreciation)).
- Wise County population projected at +27% by 2050 — long-run rental-demand tailwind backs the buy-and-hold thesis.
- At projected returns (10.0% appreciation + 3.0% rent growth), your $53k cash investment doubles in ~3 years — after that, you're playing with house money.
- By year 2, paydown + projected appreciation supports a ~$33k cash-out refi (75% LTV) — recoverable capital for the next deal without selling this one.
Negotiation context
- Only 13 days on market — expect competitive offers; lowballing is unlikely to land.
Risks & watch-outs
- Climate carrying-cost: major wind risk, 27% chance of damaging wind over 30y; major wildfire risk; extreme-heat days projected 7→22/yr by 2055 (HVAC capex compounding) — expect insurance premiums to compound above CPI over the hold.
Questions for the listing agent
- Is there a deadline driving the sale (1031 exchange, divorce, estate, relocation)? That informs how much negotiation room exists.
- Schools are F-rated, which usually means shorter tenancies and higher turnover. Who's the typical renter profile here, and what's been the actual vacancy rate?
- What's the average days-on-market for RENTAL listings here right now (not sales)? A rising rental-DOM trend means longer vacancies and softer asking-rent achievability than the comps imply.
- What's the recent tenant-quality profile in this submarket — average credit score on applications, eviction rate, late-payment / NSF rate, and stable-employment percentage? A property-management company in the area should have these aggregated.
- How much new for-sale + rental construction is in the pipeline within 1–3 miles? Heavy new supply typically softens prices + rents 12–24 months out; constrained supply supports both.
Investment metrics
- 1% rule
- 1.08% ✓
- Cap rate
- 8.30%
- Cash-on-cash
- 7.16%
- DSCR
- 1.32
- GRM
- 7.7
CMA / ARV
- ARV (on-the-fly)
- $264,656
- Comps found
- 4
Show comp detail 4 sales within ~0.75 mi
| Address | Dist | Beds/Ba | Sqft | Sold | Price | $/sf | Match |
|---|---|---|---|---|---|---|---|
| 414 County Road 4421 | 0.21mi | 3/2.0 | 1,680 (-12%) | 7mo | $289,000 | $172 | 65 |
| 183 Private Road 4434 | 0.30mi | 3/2.0 | 1,851 (-3%) | 22mo | $219,900 | $119 | 63 |
| 270 Private Road 4435 | 0.34mi | 4/2.0 (+1) | 2,100 (+10%) | 7mo | $249,000 | $119 | 56 |
| 156 Private Road 4436 | 0.54mi | 4/2.0 (+1) | 2,128 (+12%) | 11mo | $295,000 | $139 | 41 |
Match score weights: distance 35% · size 25% · config 20% · recency 20%. Top-matched comps best support the ARV.
Projected returns pro-forma
10.0% appreciation · 3.0% rent growth · sell at horizon
- IRR
- 29.5%
- Equity multiple
- 3.33×
- Total profit
- $123,713
- Equity at exit
- $171,167
- IRR
- 25.6%
- Equity multiple
- 7.55×
- Total profit
- $348,477
- Equity at exit
- $369,128
Cash invested: $53,200 (down + closing). Projections, not guarantees.
Landlord ↔ Tenant lean methodology
- Overall (STATE)
- 87 Strongly Landlord-Friendly
- State Texas
- 87 Strongly Landlord-Friendly · R+5
- County
- — inherits STATE
- City
- — inherits STATE
ZIP-level market 76078
- Home prices YoY
- 6.5%
- Active inventory
- 263
- Price-to-rent
- 7.7×
Monthly cashflow live
- Estimated rent
- $2,055 medium interval (Pro) →
- Mortgage (P&I)
- −$996
- Tax from tax record
- −$230 /mo · $2,766/yr
- Insurance
- −$79
- HOA
- −$0
- Vacancy / Maint / Mgmt
- −$432
- Net cashflow
- $317
Break-even live
Sensitivity live
| Price | -10% $425 | -5% $371 | +0% $317 | +5% $263 | +10% $210 |
|---|---|---|---|---|---|
| Rent | -10% $155 | -5% $236 | +0% $317 | +5% $398 | +10% $480 |
| Rate | -1.0pp $413 | -0.5pp $366 | base $317 | +0.5pp $268 | +1.0pp $218 |
UW: 25.0% down · 7.5% · 30yr · 1.5% tax · 5.0% vac · 8.0% maint · 8.0% mgmt
Financing live
Cash to close
- Down payment
- $47,500
- Closing costs
- $5,700
- Reserves months
- —
- Total cash needed
- —
Loan-product check · same deal, 3 products live
Conventional
25% down · 7.5% · 30yr
- Down + closing
- —
- Monthly P&I
- —
- Monthly cashflow
- —
- DSCR
- —
- Eligible?
- —
Personal DTI + credit; lowest rate.
DSCR
20% down · 8.5% · 30yr
- Down + closing
- —
- Monthly P&I
- —
- Monthly cashflow
- —
- DSCR
- —
- Eligible?
- —
No personal income docs; deal must DSCR.
Hard money
10% down · 12.0% · 12mo
- Down + closing
- —
- Monthly P&I
- —
- Monthly cashflow
- —
- DSCR
- —
- Eligible?
- —
Short-term bridge; refi at stabilization.
Listing history 5 events
-
2026-05-19historical Active Option Contract
-
2026-05-13$190,000 Active
-
2004-11-15soldstatus
-
2004-05-07soldstatus
-
2000-03-01soldstatus
ⓘ Source: listings_history table (triggers on properties + properties_extension) + one-shot
backfill from property_details.listing_events for pre-trigger history.
Tax reassessment forecast TX · Resets to sale price
- Current annual tax
- $2,766 · $230/mo
- Projected year-2 tax
- $3,477 · $290/mo
- Expected delta
- +$711/yr (+$59/mo · 25.7%)
ⓘ Screening estimate from a state-policy table — verify with the county assessor before closing.
Climate risk First Street
- Flood 1/10 Low FEMA zone X (unshaded) · 0% chance over 30 yrs
- Wildfire 7/10 Severe
- Heat 7/10 Severe 7 d/yr ≥109°F today · 22 d/yr by 30 yrs out
- Wind 6/10 Major 27% chance of damaging wind over 30 yrs
- Air quality 2/10 Low 1 unhealthy d/yr today · 2 by 30 yrs out
Nearby sold comps map
Loading sold comps map…
Walkable amenities ~0.75 mi
Loading nearby amenities…
Taxation est. · year 1
- Rental income
- $24,658
- − Mortgage interest
- −$10,643
- − Property taxes
- −$2,766
- − Insurance
- −$950
- − Repairs & maintenance
- −$1,973
- − Management
- −$1,973
- − Depreciation
- −$5,527
- Taxable income
- $827
- Est. tax owed @ 24.0%
- −$198
- After-tax cash flow
- $3,609/yr
For passive investors: Depreciation is non-cash, so a rental often shows a tax loss while cash-flowing — sheltering income. Rental losses are passive: they offset passive income freely, and up to $25,000/yr can offset ordinary (W-2) income if you actively participate and your MAGI is under $100k (phasing out to $0 by $150k); unused losses carry forward. On sale, claimed depreciation is recaptured at up to 25%, and gains may owe capital-gains tax (a 1031 exchange can defer both). Figures are a year-1 estimate at your 24.0% rate — not tax advice; consult a CPA.
Schools (NCES district)
- District
- Decatur ISD
- NCES district ID
- 4816500
- Math proficiency
- 40% ▼ -7.00%
- Reading proficiency
- 42% ▼ -5.00%
- Median HH income
- $60,504
- Composite
- 36.33/100
- National rank
- #4691
- State rank
- #323 of 826 in TX
Livability — New Fairview
- Score
- 62/100
- State rank
- #901
- US rank
- #16172
Category grades
Schools grade is shown separately in the Schools card above.
Census & demographics
- County
- Wise County · 49,037 people
- City population
- 10,200
- Metro
- Dallas-Fort Worth-Arlington, TX
- Population (ZIP)
- 10,828
- Household income
- $99,866
- Rent vs Own
- Severe rent burden
- 10.0
Population outlook (Wise County) Hauer SSP2
- Today (2025)
- 71,620 people
- By 2030
- 75,858 · +5.9%
- By 2040
- 83,908 · +17.2%
- By 2050
- 90,717 · +26.7%
- By 2075
- 107,583 · +50.2%
- By 2100
- 114,996 · +60.6%
Race, ethnicity, and origin ACS 2023
- Neighborhood character
- Predominantly White (69%)
- Race & ethnicity
- White 69% Hispanic / Latino 24% Two or more races 11% Native American 4% Black 2%
- Hispanic origin (detail)
- Mexican 20% Puerto Rican 3%
- Common ancestry
- Slovak 2% Lithuanian 2% Italian 1%
- Foreign-born
- 6% · Canada
- Languages at home
- 85% English-only · Spanish 14% German/W. Germanic 1%
Political lean MEDSL · Wise
- 2024 margin
- Solid R (+70.0) · D 14.7% · R 84.7%
- 2008→2024 swing
- -14.3pp toward R · 2008: -55.7pp · 2024: -70.0pp
- All cycles
- 2024: R+70.0 2020: R+68.2 2016: R+69.9 2012: R+67.5 2008: R+55.7
Not yet ingested
- Civics
- —
Market trends
- HPI YoY
- ▲ 19.94%
- Current HPI
- 325.22
- Rent YoY
- —
- Metro
- Dallas-Fort Worth-Arlington, TX
- State GDP YoY
- ▲ 3.95%
- F500 in state
- 110
Industry mix (Fortune 500 HQ in TX)
| Industry | F500 HQs | Revenue |
|---|---|---|
| Energy | 16 | $1,198B |
|
||
| Technology | 5 | $198B |
|
||
| Engineering / Construction | 4 | $72B |
|
||
| Energy Services | 3 | $60B |
|
||
| Utilities | 3 | $41B |
|
||
| Healthcare | 2 | $330B |
|
||
Price history
5 events — show timeline
- 2026-05-19 Contingent — NTREIS
- 2026-05-13 Listed $190,000 NTREIS
- 2004-11-15 Sold (Public Records) — Public Records
- 2004-05-07 Sold (Public Records) — Public Records
- 2000-03-01 Sold (Public Records) — Public Records
Property tax history
+4.4%/yrLatest (2025): $2,766 · +3.7% YoY. Source: county tax records.
Cash-flow waterfall
monthlySold comps — $/sqft
last 12 mo · ≤1 miLoading sold comps…