 Multi-family
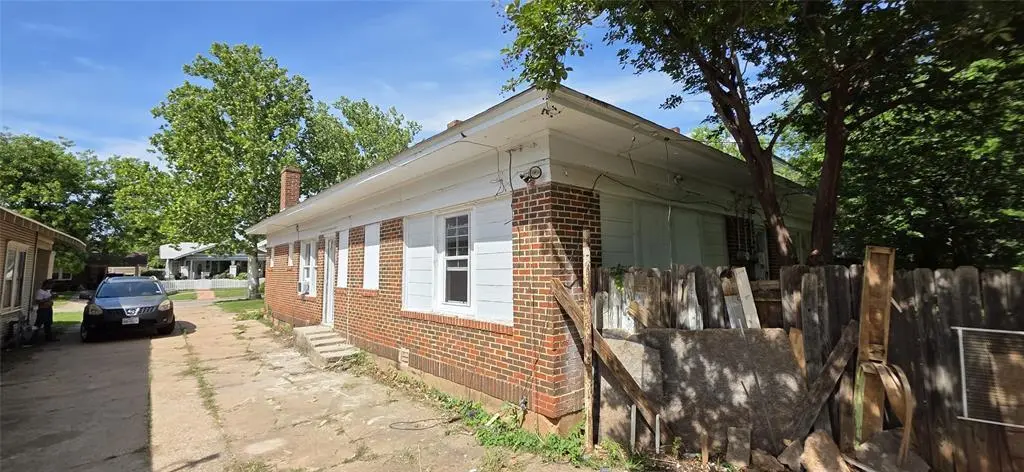
1719 Elizabeth Ave · Wichita Falls, TX
Flood risk 1/10 · Minimal
- FEMA flood zone
- X (unshaded)
- Chance of flooding over 30 yrs
- 0.0%
- Est. flood insurance / yr
- $507 – $1,088
Fire risk 1/10 · Minimal
- Est. fire insurance / yr
- $1,222 – $2,270
Heat risk 7/10 · Major
- Hot days now (above 109°F)
- 7 days/yr
- Hot days in 30 yrs
- 20 days/yr
Wind risk 3/10 · Minor
- Chance of severe wind over 30 yrs
- 7.0%
Air-quality risk 1/10 · Minimal
- Unhealthy air days now
- 0 days/yr
- Unhealthy air days in 30 yrs
- 0 days/yr
Risk factors via First Street. Map © Google.
Why this score? — see what drove the B+ grade
The composite is a weighted blend of 9 inputs, each scored 0–100. Each bar is that input's sub-score; the figure is the points it added to the 100-point composite (weight × sub-score).
- Cash flow +30.0/30.0
- ARV discount +14.6/15.0
- 1% rule +10.0/10.0
- DSCR +10.0/10.0
- Rent growth +3.8/5.0
- Livability +3.5/5.0
- Schools +2.7/10.0
- Condition / age +2.5/5.0
- Appreciation +0.0/10.0
$82,000
🖨 Deal sheet (PDF) 📄 Offer letter ✓ Due diligence
Multi-family units
County records classify this as Multi-Family (2-4 Unit). Listing-text estimate: 1 unit. estimate disagrees with records
Listing remarks MLS
Investor special: Brick Duplex in the Southland addition currently leased out both sides. One side still needs a little TLC, but the other side has some updates. So much potential with this one!
Key facts
- 7,492 sq ft lot
- Built 1934
- Listed 39 days
Property features AI
Finance
- Other: Property located in the Southland subdivision, Wichita County
- Financial info: Second mortgage: none; Loan treated as clear
- HOA & community: No homeowners association
Exterior
- Parking: Additional parking (no covered or carport spaces listed)
- Utilities: City sewer; Not in a municipal utility district
- Home design: Single family residence; Attached property; One-story
- Construction: Built in 1934
- Exterior features: Back yard fencing; Additional parking
Interior
- Kitchen: Electric cooktop; Electric oven; Disposal
- Bedrooms: 4 bedrooms (all on entry level); Primary bedroom with built-in desk; Second primary bedroom with built-in cabinets and cedar closet; Additional bedrooms with built-in desks and/or cedar closets
- Bathrooms: 2 full bathrooms; Bathrooms include built-in cabinets and concrete countertops
- Interior features: Cable TV available; High-speed internet available; Cedar closet(s); Decorative lighting; Two living areas; Eight total rooms
Neighborhood map
What this means for you Summary
Snapshot
- This is a 2-bed/2.0-bath multifamily listed at $82k.
Deal economics
- At list price, monthly cash flow is $885 ($11k/yr) — positive.
- The deal already cash-flows at list — no discount required.
- Meets the 1% rule at list price ($2k rent vs $82k).
- Recommended offer: $80k (3.0% below list) — sets the bar for market timing.
- Cap rate 19.2% vs local median 4.7% in Wichita Falls — top-decile yield for the area; either an underpriced asset or a hidden risk that comps aren't pricing in. Stress-test before assuming the spread holds.
Location & tenants
- Location reads 69/100 on livability (#437 in TX) — a middle-class / working-renter tenant base. Strengths: cost of living A+, housing A+; Watch: health & safety C-, employment D+, crime D.
- Wichita Falls ISD (urban): math 31% / reading 33% proficiency, ranked #585 of 826 in TX (top 71%) — families likely to look elsewhere, expect single-tenant / working-renter base with shorter leases.
- Zoned schools: Fowler El (math 48% / reading 46%, grade D-, #1,006 of 4,322 statewide, top 25%, 548 students, 47% FRL).
- Zoned-school proficiency averages 47% at this address vs 32% district-wide (+15 pts) — the actual schools serving this property are materially stronger than the Wichita Falls ISD average implies; a family-tenant draw the district grade alone would hide.
- Market conditions: Rents rising fast (+5.3%/yr); 133 active listings in the ZIP; 8 comparable units currently listed for rent nearby; rentals lingering (median 44d on market — plan ~5-8 weeks vacancy on turnover, expect pricing pressure); 100% of comp listings sitting > 30 days — soft ceiling on asking rent; lower-income renter base — watch delinquency; 231 units permitted in Wichita County in 2024 (10 in 5+ unit buildings).
Forward outlook
- Local home prices are declining (-3.0%/yr); year-one equity from $567 of loan paydown is wiped out by about $2k of value loss. Plan a longer hold.
- Wichita County population projected to shrink 7% by 2050 — rents likely to lag national; underwrite the cash flow, not the appreciation.
- At projected returns (-3.0% appreciation + 5.3% rent growth), your $23k cash investment doubles in ~3 years — after that, you're playing with house money.
Negotiation context
- It's been on market 40 days — a 3% lower offer ($80k) is reasonable based on typical stale-listing flexibility.
- 3 sale attempts since 9y ago; this cycle's ask has dropped $7k (8%) from the opening price — seller is motivated, your offer sets the floor, not the list.
Risks & watch-outs
- Watch-outs: built in 1934 — expect roof / HVAC / electrical / plumbing capex.
- Climate carrying-cost: extreme-heat days projected 7→20/yr by 2055 (HVAC capex compounding) — expect insurance premiums to compound above CPI over the hold.
Questions for the listing agent
- It's been on market 40 days. Have you received any prior offers? Is the seller open to a 3% concession, seller financing, or rate buy-down credit?
- Built in 1934 — when were the roof, HVAC, electrical panel, plumbing, and water heater last replaced?
- Is there a deadline driving the sale (1031 exchange, divorce, estate, relocation)? That informs how much negotiation room exists.
- Schools are D-rated, which usually means shorter tenancies and higher turnover. Who's the typical renter profile here, and what's been the actual vacancy rate?
- Crime grade is D in this area — have there been break-ins, vandalism, or insurance claims at this property in the last 3 years? What carrier currently insures it and at what premium?
- What's the average days-on-market for RENTAL listings here right now (not sales)? A rising rental-DOM trend means longer vacancies and softer asking-rent achievability than the comps imply.
- What's the recent tenant-quality profile in this submarket — average credit score on applications, eviction rate, late-payment / NSF rate, and stable-employment percentage? A property-management company in the area should have these aggregated.
- How much new apartment / multifamily construction is in the pipeline within 1–3 miles? Heavy new supply (>2% of stock underway) typically softens rents 12–24 months out; light construction supports rent growth.
Investment metrics
- 1% rule
- 2.30% ✓
- Cap rate
- 19.24%
- Cash-on-cash
- 46.24%
- DSCR
- 3.06
- GRM
- 3.6
CMA / ARV
- ARV (median comp)
- $97,297
- List price
- $82,000
- Delta
- -15.72%
- Verdict
- UNDERPRICED
- Comps
- 20 within 1.0 mi
Show comp detail 1 sale within ~0.75 mi
| Address | Dist | Beds/Ba | Sqft | Sold | Price | $/sf | Match |
|---|---|---|---|---|---|---|---|
| 705 Baylor St | 0.51mi | 3/3.0 (+1) | 1,592 (-8%) | 6mo | $85,000 | $53 | 50 |
Match score weights: distance 35% · size 25% · config 20% · recency 20%. Top-matched comps best support the ARV.
Projected returns pro-forma
-3.0% appreciation · 5.27% rent growth · sell at horizon
- IRR
- 46.1%
- Equity multiple
- 3.07×
- Total profit
- $47,511
- Equity at exit
- $12,226
- IRR
- 52.9%
- Equity multiple
- 6.80×
- Total profit
- $133,060
- Equity at exit
- $7,090
Cash invested: $22,960 (down + closing). Projections, not guarantees.
Landlord ↔ Tenant lean methodology
- Overall (STATE)
- 87 Strongly Landlord-Friendly
- State Texas
- 87 Strongly Landlord-Friendly · R+5
- County
- — inherits STATE
- City
- — inherits STATE
ZIP-level market 76301
- Home prices YoY
- -34.1%
- Rents YoY
- 5.3%
- Active inventory
- 133
- Price-to-rent
- 7.3×
Monthly cashflow live
- Estimated rent
- $1,885 high interval (Pro) →
- Mortgage (P&I)
- −$430
- Tax from tax record
- −$140 /mo · $1,684/yr
- Insurance
- −$34
- HOA
- −$0
- Vacancy / Maint / Mgmt
- −$396
- Net cashflow
- $885
Break-even live
Sensitivity live
| Price | -10% $931 | -5% $908 | +0% $885 | +5% $861 | +10% $838 |
|---|---|---|---|---|---|
| Rent | -10% $736 | -5% $810 | +0% $885 | +5% $959 | +10% $1,034 |
| Rate | -1.0pp $926 | -0.5pp $906 | base $885 | +0.5pp $863 | +1.0pp $842 |
2-unit breakdown (identical units grouped — click to expand)
| Units | Beds | Baths | Est. rent |
|---|---|---|---|
| 2× units | 2 | 1 | $1,884 |
| #1 | 2 | 1 | $942 |
| #2 | 2 | 1 | $942 |
| Total (2 units) | $1,885 | ||
UW: 25.0% down · 7.5% · 30yr · 1.5% tax · 5.0% vac · 8.0% maint · 8.0% mgmt
Financing live
Cash to close
- Down payment
- $20,500
- Closing costs
- $2,460
- Reserves months
- —
- Total cash needed
- —
Loan-product check · same deal, 3 products live
Conventional
25% down · 7.5% · 30yr
- Down + closing
- —
- Monthly P&I
- —
- Monthly cashflow
- —
- DSCR
- —
- Eligible?
- —
Personal DTI + credit; lowest rate.
DSCR
20% down · 8.5% · 30yr
- Down + closing
- —
- Monthly P&I
- —
- Monthly cashflow
- —
- DSCR
- —
- Eligible?
- —
No personal income docs; deal must DSCR.
Hard money
10% down · 12.0% · 12mo
- Down + closing
- —
- Monthly P&I
- —
- Monthly cashflow
- —
- DSCR
- —
- Eligible?
- —
Short-term bridge; refi at stabilization.
Rent comps 8 comps
| Address | Beds | Baths | Sqft | Rent | $/sqft | DOM | Units | Dist |
|---|---|---|---|---|---|---|---|---|
| 1821 9th St Unit B Wichita Falls, TX | 2.0 | 1.0 | 1200 | $795 | $0.66 | 44d | 1 | 0.34mi |
| 1714 7th St Wichita Falls, TX | 3.0 | 1.0 | 1452 | $850 | $0.59 | 44d | 1 | 0.54mi |
| 1916 7th St Wichita Falls, TX | 2.0 | 1.0 | 1226 | $1,050 | $0.86 | 44d | 1 | 0.61mi |
| 1507 Polk St Wichita Falls, TX | 3.0 | 1.0 | 1316 | $1,050 | $0.80 | 44d | 1 | 0.77mi |
| 2130 Avenue K Wichita Falls, TX | 3.0 | 2.0 | 1090 | $1,390 | $1.28 | 44d | 1 | 0.78mi |
| 2006 Bell St Wichita Falls, TX | 3.0 | 1.0 | 1120 | $1,000 | $0.89 | 44d | 1 | 0.80mi |
| 1813 Polk St Wichita Falls, TX | 3.0 | 2.0 | 1090 | $1,364 | $1.25 | 44d | 1 | 0.98mi |
| 2003 Buchanan St Wichita Falls, TX | 3.0 | 2.0 | 1118 | $1,100 | $0.98 | 44d | 1 | 1.27mi |
Listing history 23 events
-
2026-06-19days on market $82,000 Active 40 DOM
-
2026-06-18days on market $82,000 Active 39 DOM
-
2026-06-17days on market $82,000 Active 38 DOM
-
2026-06-16days on market $82,000 Active 37 DOM
-
2026-06-15days on market $82,000 Active 36 DOM
-
2026-06-14days on market $82,000 Active 34 DOM
-
2026-06-13days on market $82,000 Active 33 DOM
-
2026-06-10days on market $82,000 Active 31 DOM
-
2026-06-09days on market $82,000 Active 30 DOM
-
2026-06-08days on market $82,000 Active 29 DOM
-
2026-06-07pricedays on market $82,000 Active 28 DOM
-
2026-06-05days on market $89,000 Active 25 DOM
-
2026-06-02days on market $89,000 Active 23 DOM
-
2026-06-01days on market $89,000 Active 22 DOM
-
2026-05-31days on market $89,000 Active 21 DOM
-
2026-05-30days on market $89,000 Active 20 DOM
-
2026-05-09$89,000 Active 124-char remark
-
2021-09-28soldstatus
-
2021-09-24soldstatus 194-char remark
Show marketing remark (194 chars)
Investor special: Brick Duplex in the Southland addition currently leased out both sides. One side still needs a little TLC, but the other side has some updates. So much potential with this one!
-
2021-07-27$75,000 194-char remark
Show marketing remark (194 chars)
Investor special: Brick Duplex in the Southland addition currently leased out both sides. One side still needs a little TLC, but the other side has some updates. So much potential with this one!
-
2018-01-31soldstatus
Show marketing remark (440 chars)
Neat and clean duplex on a very nice block with well maintained houses. Each unit boasts a nicely sized living room and a dining room with pass through to kitchen. Bedroom is on the back side of the unit and features a large closet. Each unit has a separate washer/dryer room, separate hot water heater, and separate utility meters. Window units, space heaters, and ceiling fans are found in each unit. The complex roof was recently placed.
-
2017-12-19$49,500
Show marketing remark (440 chars)
Neat and clean duplex on a very nice block with well maintained houses. Each unit boasts a nicely sized living room and a dining room with pass through to kitchen. Bedroom is on the back side of the unit and features a large closet. Each unit has a separate washer/dryer room, separate hot water heater, and separate utility meters. Window units, space heaters, and ceiling fans are found in each unit. The complex roof was recently placed.
ⓘ Source: listings_history table (triggers on properties + properties_extension) + one-shot
backfill from property_details.listing_events for pre-trigger history.
Tax reassessment forecast TX · Resets to sale price
- Current annual tax
- $1,684 · $140/mo
- Projected year-2 tax
- $1,684 · $140/mo
- Expected delta
- $0/yr ($0/mo · 0.0%)
ⓘ Screening estimate from a state-policy table — verify with the county assessor before closing.
Climate risk First Street
- Flood 1/10 Low FEMA zone X (unshaded) · 0% chance over 30 yrs
- Wildfire 1/10 Low
- Heat 7/10 Severe 7 d/yr ≥109°F today · 20 d/yr by 30 yrs out
- Wind 3/10 Moderate 7% chance of damaging wind over 30 yrs
- Air quality 1/10 Low 0 unhealthy d/yr today · 0 by 30 yrs out
Nearby sold comps map
Loading sold comps map…
Walkable amenities ~0.75 mi
Loading nearby amenities…
Taxation est. · year 1
- Rental income
- $22,620
- − Mortgage interest
- −$4,593
- − Property taxes
- −$1,684
- − Insurance
- −$410
- − Repairs & maintenance
- −$1,810
- − Management
- −$1,810
- − Depreciation
- −$2,385
- Taxable income
- $9,928
- Est. tax owed @ 24.0%
- −$2,383
- After-tax cash flow
- $8,233/yr
For passive investors: Depreciation is non-cash, so a rental often shows a tax loss while cash-flowing — sheltering income. Rental losses are passive: they offset passive income freely, and up to $25,000/yr can offset ordinary (W-2) income if you actively participate and your MAGI is under $100k (phasing out to $0 by $150k); unused losses carry forward. On sale, claimed depreciation is recaptured at up to 25%, and gains may owe capital-gains tax (a 1031 exchange can defer both). Figures are a year-1 estimate at your 24.0% rate — not tax advice; consult a CPA.
Schools (NCES district)
- District
- Wichita Falls ISD
- NCES district ID
- 4845780
- Math proficiency
- 31% ▼ -10.00%
- Reading proficiency
- 33% ▼ -7.00%
- Median HH income
- $41,604
- Composite
- 27.06/100
- National rank
- #7051
- State rank
- #585 of 826 in TX
Livability — Wichita Falls
- Score
- 69/100
- State rank
- #437
- US rank
- #8940
Category grades
Schools grade is shown separately in the Schools card above.
Census & demographics
- Census place
- Wichita Falls, TX
- County
- Wichita County · 95,694 people
- City population
- 95,694
- Metro
- Wichita Falls, TX
- Population (ZIP)
- 15,479
- Household income
- $41,947
- Rent vs Own
- Severe rent burden
- 577.0
Population outlook (Wichita County) Hauer SSP2
- Today (2025)
- 129,638 people
- By 2030
- 128,366 · -1.0%
- By 2040
- 124,466 · -4.0%
- By 2050
- 120,499 · -7.0%
- By 2075
- 113,884 · -12.2%
- By 2100
- 101,818 · -21.5%
Race, ethnicity, and origin ACS 2023
- Neighborhood character
- Diverse neighborhood (Simpson 0.67)
- Race & ethnicity
- White 40% Hispanic / Latino 38% Black 18% Two or more races 15% Asian 1%
- Hispanic origin (detail)
- Mexican 36%
- Common ancestry
- Slovak 3% Lithuanian 2% Italian 1%
- Foreign-born
- 11% · Canada, Vietnam
- Languages at home
- 76% English-only · Spanish 22%
Political lean MEDSL · Wichita
- 2024 margin
- Solid R (+44.0) · D 27.5% · R 71.5%
- 2008→2024 swing
- -5.2pp toward R · 2008: -38.9pp · 2024: -44.0pp
- All cycles
- 2024: R+44.0 2020: R+41.1 2016: R+49.7 2012: R+47.1 2008: R+38.9
Not yet ingested
- Civics
- —
Market trends
- HPI YoY
- ▼ -69.89%
- Current HPI
- 135.1511
- Rent YoY
- ▲ 5.27%
- Metro
- Wichita Falls, TX
- State GDP YoY
- ▲ 3.95%
- F500 in state
- 110
Industry mix (Fortune 500 HQ in TX)
| Industry | F500 HQs | Revenue |
|---|---|---|
| Energy | 16 | $1,198B |
|
||
| Technology | 5 | $198B |
|
||
| Engineering / Construction | 4 | $72B |
|
||
| Energy Services | 3 | $60B |
|
||
| Utilities | 3 | $41B |
|
||
| Healthcare | 2 | $330B |
|
||
Price history
+65.7% since first listed8 events — show timeline
- 2026-06-07 Price Changed $82,000 NTREIS
- 2026-05-09 Listed $89,000 NTREIS
- 2021-09-28 Sold (Public Records) — Public Records
- 2021-09-24 Sold (MLS) — WFAOR
- 2021-07-27 Listed $75,000 WFAOR
- 2018-01-31 Sold (Public Records) — Public Records
- 2018-01-31 Sold (MLS) — WFAOR
- 2017-12-19 Listed $49,500 WFAOR
Property tax history
+4.8%/yrLatest (2025): $1,684 · -1.4% YoY. Source: county tax records.
Cash-flow waterfall
monthlySold comps — $/sqft
last 12 mo · ≤1 miLoading sold comps…