123 Falconhead Dr · Burneyville, OK
Flood risk No data
- FEMA flood zone
- —
- Chance of flooding over 30 yrs
- —
- Est. flood insurance / yr
- —
Fire risk No data
- Est. fire insurance / yr
- —
Heat risk No data
- Hot days now (above threshold)
- —
- Hot days in 30 yrs
- —
Wind risk No data
- Chance of severe wind over 30 yrs
- —
Air-quality risk No data
- Unhealthy air days now
- —
- Unhealthy air days in 30 yrs
- —
Risk factors via First Street. Map © Google.
Why this score? — see what drove the D- grade
The composite is a weighted blend of 9 inputs, each scored 0–100. Each bar is that input's sub-score; the figure is the points it added to the 100-point composite (weight × sub-score).
- 1% rule +10.0/10.0
- ARV discount +7.5/15.0
- Appreciation +5.2/10.0
- Cash flow +3.8/30.0
- Livability +3.4/5.0
- Rent growth +2.5/5.0
- Condition / age +2.5/5.0
- Schools +2.1/10.0
- DSCR +0.0/10.0
$39,000
🖨 Deal sheet 📄 Offer letter ✓ Due diligence
Listing remarks MLS
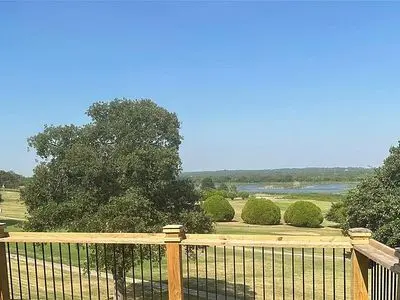
Studio efficiency condo on bottom floor with beautiful views of golf course and lake. Furnishings stay except for bed. Enjoy 24hr gated security, golf, fishing, 2 resort pools, restaurant, lounge, coin free laundry, and more!
Key facts
- Laminate flooring
- New balcony
- New cabinets
Tags
Neighborhood map
What this means for you Summary
Snapshot
- This is a 1-bed/1.0-bath condo listed at $39k.
Deal economics
- At list price, monthly cash flow is $-112 ($-1k/yr) — negative.
- The deal already cash-flows at list — no discount required.
- Meets the 1% rule at list price ($794 rent vs $39k).
- Recommended offer: $38k (3.0% below list) — sets the bar for market timing.
- Cap rate 2.8% vs local median 1.6% in Burneyville — top-decile yield for the area; either an underpriced asset or a hidden risk that comps aren't pricing in. Stress-test before assuming the spread holds.
Location & tenants
- Location reads 68/100 on livability (#66 in OK) — a middle-class / working-renter tenant base. Strengths: cost of living A+, housing A+, employment A-; Watch: crime D+, schools D-, amenities F.
- Turner (rural): math 15% / reading 25% proficiency, ranked #395 of 513 in OK (top 77%) — low school quality limits family demand, transient renter base, plan for 1-2y turnover.
- Market conditions: 87 active listings in the ZIP.
Forward outlook
- In year one you build about $407 of equity ($270 loan paydown + $137 appreciation (0.3% local appreciation)).
- Love County population projected at +27% by 2050 — long-run rental-demand tailwind backs the buy-and-hold thesis.
Negotiation context
- It's been on market 38 days — a 3% lower offer ($38k) is reasonable based on typical stale-listing flexibility.
- 5 sale attempts since 10y ago with the ask held roughly flat each time — persistent listings suggest the price (not the market) is what's stuck; bring a comps-based counter.
- Current owner paid $17k; list at $39k implies a 131% gain — meaningful room to come down on a strong offer.
Risks & watch-outs
- Watch-outs: HOA is 63% of rent.
Questions for the listing agent
- What do current leases actually rent for vs. the listed asking? Can we see a recent rent roll and the last 12 months of T-12 income?
- It's been on market 38 days. Have you received any prior offers? Is the seller open to a 3% concession, seller financing, or rate buy-down credit?
- Built in 1974 — when were the roof, HVAC, electrical panel, plumbing, and water heater last replaced?
- What does the HOA fee cover, when was the last increase, and are there any pending special assessments or reserve-fund shortfalls?
- Any open or pending special assessments — roof, HVAC, plumbing, elevator, façade? What's the per-unit balance and payoff schedule, and is the seller paying it off at close or rolling it to the buyer?
- Is there a deadline driving the sale (1031 exchange, divorce, estate, relocation)? That informs how much negotiation room exists.
- Schools are D-rated, which usually means shorter tenancies and higher turnover. Who's the typical renter profile here, and what's been the actual vacancy rate?
- Crime grade is D in this area — have there been break-ins, vandalism, or insurance claims at this property in the last 3 years? What carrier currently insures it and at what premium?
- The area grade is low — what's the realistic commute time and amenity access for the typical tenant pool here? Any planned neighborhood developments (good or bad) we should know about?
- What's the average days-on-market for RENTAL listings here right now (not sales)? A rising rental-DOM trend means longer vacancies and softer asking-rent achievability than the comps imply.
- What's the recent tenant-quality profile in this submarket — average credit score on applications, eviction rate, late-payment / NSF rate, and stable-employment percentage? A property-management company in the area should have these aggregated.
- How much new apartment / multifamily construction is in the pipeline within 1–3 miles? Heavy new supply (>2% of stock underway) typically softens rents 12–24 months out; light construction supports rent growth.
Investment metrics
- 1% rule
- 2.04% ✓
- Cap rate
- 2.84%
- Cash-on-cash
- -12.33%
- DSCR
- 0.45
- GRM
- 4.1
CMA / ARV
No comps found within radius.
Projected returns pro-forma
0.35% appreciation · 3.0% rent growth · sell at horizon
- IRR
- -14.0%
- Equity multiple
- 0.33×
- Total profit
- $-7,338
- Equity at exit
- $12,013
- IRR
- -6.9%
- Equity multiple
- 0.22×
- Total profit
- $-8,509
- Equity at exit
- $15,002
Cash invested: $10,920 (down + closing). Projections, not guarantees.
Landlord ↔ Tenant lean methodology
- Overall (STATE)
- 83 Strongly Landlord-Friendly
- State Oklahoma
- 83 Strongly Landlord-Friendly · R+20
- County
- — inherits STATE
- City
- — inherits STATE
ZIP-level market 73430
- Home prices YoY
- 0.1%
- Active inventory
- 87
- Price-to-rent
- 4.1×
Monthly cashflow live
- Estimated rent
- $794 medium interval (Pro) →
- Mortgage (P&I)
- −$205
- Tax from tax record
- −$21 /mo · $252/yr
- Insurance
- −$16
- HOA est. from 2 same-building comps
- −$498
- Vacancy / Maint / Mgmt
- −$167
- Net cashflow
- $-112
Break-even live
UW: 25.0% down · 7.5% · 30yr · 1.5% tax · 5.0% vac · 8.0% maint · 8.0% mgmt
Financing live
Cash to close
- Down payment
- $9,750
- Closing costs
- $1,170
- Reserves months
- —
- Total cash needed
- —
Loan-product check · same deal, 3 products live
Conventional
25% down · 7.5% · 30yr
- Down + closing
- —
- Monthly P&I
- —
- Monthly cashflow
- —
- DSCR
- —
- Eligible?
- —
Personal DTI + credit; lowest rate.
DSCR
20% down · 8.5% · 30yr
- Down + closing
- —
- Monthly P&I
- —
- Monthly cashflow
- —
- DSCR
- —
- Eligible?
- —
No personal income docs; deal must DSCR.
Hard money
10% down · 12.0% · 12mo
- Down + closing
- —
- Monthly P&I
- —
- Monthly cashflow
- —
- DSCR
- —
- Eligible?
- —
Short-term bridge; refi at stabilization.
HOA detail condo
- Monthly dues
- $0 · $0/yr
- Likely covers
- poolsecurity
- Assessments
- None detected in remarks — confirm with the listing agent.
Listing history 27 events
-
2026-06-19days on market $39,000 Active 38 DOM
-
2026-06-18days on market $39,000 Active 37 DOM
-
2026-06-17days on market $39,000 Active 36 DOM
-
2026-06-16days on market $39,000 Active 35 DOM
-
2026-06-15days on market $39,000 Active 34 DOM
-
2026-06-14days on market $39,000 Active 32 DOM
-
2026-06-12days on market $39,000 Active 31 DOM
-
2026-06-09days on market $39,000 Active 28 DOM
-
2026-06-08days on market $39,000 Active 27 DOM
-
2026-06-07days on market $39,000 Active 26 DOM
-
2026-06-05days on market $39,000 Active 23 DOM
-
2026-06-03days on market $39,000 Active 22 DOM
-
2026-06-02days on market $39,000 Active 21 DOM
-
2026-06-01days on market $39,000 Active 20 DOM
-
2026-05-31days on market $39,000 Active 19 DOM
-
2026-05-30days on market $39,000 Active 18 DOM
-
2026-05-12$39,000 Active
-
2026-01-29historical $980
-
2026-01-13price $980
-
2026-01-05$1,030
-
2020-03-12soldstatus $16,900 225-char remark
Show marketing remark (225 chars)
Studio efficiency condo on bottom floor with beautiful views of golf course and lake. Furnishings stay except for bed. Enjoy 24hr gated security, golf, fishing, 2 resort pools, restaurant, lounge, coin free laundry, and more!
-
2019-10-28$18,900 225-char remark
Show marketing remark (225 chars)
Studio efficiency condo on bottom floor with beautiful views of golf course and lake. Furnishings stay except for bed. Enjoy 24hr gated security, golf, fishing, 2 resort pools, restaurant, lounge, coin free laundry, and more!
-
2019-09-27soldstatus $12,000 353-char remark
Show marketing remark (353 chars)
Beautiful view from this efficiency, 1 bath condo. Partially furnished and recently updated with new paint, beautiful laminate flooring, and appliances. Also, recent central heat and air, new hot water heater, windows, and front door and storm door. Dues include family golf, water, trash, washer and dryer facilities, tennis, club house and restaurant.
-
2019-04-03$14,500 353-char remark
Show marketing remark (353 chars)
Beautiful view from this efficiency, 1 bath condo. Partially furnished and recently updated with new paint, beautiful laminate flooring, and appliances. Also, recent central heat and air, new hot water heater, windows, and front door and storm door. Dues include family golf, water, trash, washer and dryer facilities, tennis, club house and restaurant.
-
2016-12-15soldstatus $13,499
-
2016-10-13$13,499
-
1993-12-01soldstatus $25,000
ⓘ Source: listings_history table (triggers on properties + properties_extension) + one-shot
backfill from property_details.listing_events for pre-trigger history.
Tax reassessment forecast OK · Resets to sale price
- Current annual tax
- $252 · $21/mo
- Projected year-2 tax
- $351 · $29/mo
- Expected delta
- +$99/yr (+$8/mo · 39.3%)
ⓘ Screening estimate from a state-policy table — verify with the county assessor before closing.
Nearby sold comps map
Loading sold comps map…
Walkable amenities ~0.75 mi
Loading nearby amenities…
Taxation est. · year 1
- Rental income
- $9,533
- − Mortgage interest
- −$2,185
- − Property taxes
- −$252
- − Insurance
- −$195
- − Repairs & maintenance
- −$763
- − Management
- −$763
- − HOA
- −$5,976
- − Depreciation
- −$1,135
- Taxable loss
- −$1,734
- Est. tax savings @ 24.0%
- +$416
- After-tax cash flow
- $-930/yr
For passive investors: Depreciation is non-cash, so a rental often shows a tax loss while cash-flowing — sheltering income. Rental losses are passive: they offset passive income freely, and up to $25,000/yr can offset ordinary (W-2) income if you actively participate and your MAGI is under $100k (phasing out to $0 by $150k); unused losses carry forward. On sale, claimed depreciation is recaptured at up to 25%, and gains may owe capital-gains tax (a 1031 exchange can defer both). Figures are a year-1 estimate at your 24.0% rate — not tax advice; consult a CPA.
Schools (NCES district)
- District
- Turner
- NCES district ID
- 4030300
- Math proficiency
- 15% ▬ 0.00%
- Reading proficiency
- 25% ▼ -5.00%
- Median HH income
- $53,356
- Composite
- 21.46/100
- National rank
- #13632
- State rank
- #395 of 513 in OK
Livability — Burneyville
- Score
- 68/100
- State rank
- #66
- US rank
- #9485
Category grades
Schools grade is shown separately in the Schools card above.
Census & demographics
- Census place
- Burneyville, OK
- Population (ZIP)
- 1,501
Population outlook (Love County) Hauer SSP2
- Today (2025)
- 10,844 people
- By 2030
- 11,370 · +4.9%
- By 2040
- 12,496 · +15.2%
- By 2050
- 13,766 · +26.9%
- By 2075
- 17,688 · +63.1%
- By 2100
- 21,161 · +95.1%
Race, ethnicity, and origin ACS 2023
- Neighborhood character
- Predominantly White (78%)
- Race & ethnicity
- White 78% Two or more races 14% Hispanic / Latino 9% Native American 3% Black 2%
- Hispanic origin (detail)
- Mexican 3%
- Common ancestry
- Lithuanian 4% Italian 2% Serbian 1%
- Foreign-born
- 4% · Canada, South Korea
- Languages at home
- 91% English-only · Spanish 8% Korean 1%
Political lean MEDSL · Love
- 2024 margin
- Solid R (+66.2) · D 16.2% · R 82.4% · Other 1.4%
- 2008→2024 swing
- -31.6pp toward R · 2008: -34.6pp · 2024: -66.2pp
- All cycles
- 2024: R+66.2 2020: R+63.6 2016: R+57.7 2012: R+40.4 2008: R+34.6
Not yet ingested
- Civics
- —
Market trends
- HPI YoY
- ▲ 0.35%
- Current HPI
- 292.7024
- Rent YoY
- —
- Metro
- —
- State GDP YoY
- ▲ 1.55%
- F500 in state
- 6
Industry mix (Fortune 500 HQ in OK)
| Industry | F500 HQs | Revenue |
|---|---|---|
| Energy | 3 | $48B |
|
||
Price history
+56.0% since first listed11 events — show timeline
- 2026-05-12 Listed $39,000 FSBO.com
- 2026-01-29 Rental Removed $980 APPFOLIO
- 2026-01-13 Price Changed $980 APPFOLIO
- 2026-01-05 Listed for Rent $1,030 APPFOLIO
- 2020-03-12 Sold (MLS) $16,900 MLS Technology, Inc.
- 2019-10-28 Listed $18,900 MLS Technology, Inc.
- 2019-09-27 Sold (MLS) $12,000 MLS Technology, Inc.
- 2019-04-03 Listed $14,500 MLS Technology, Inc.
- 2016-12-15 Sold (MLS) $13,499 MLS Technology, Inc.
- 2016-10-13 Listed $13,499 MLS Technology, Inc.
- 1993-12-01 Sold (Public Records) $25,000 Public Records
Property tax history
+4.3%/yrLatest (2025): $252 · -9.0% YoY. Source: county tax records.
Cash-flow waterfall
monthlySold comps — $/sqft
last 12 mo · ≤1 miLoading sold comps…