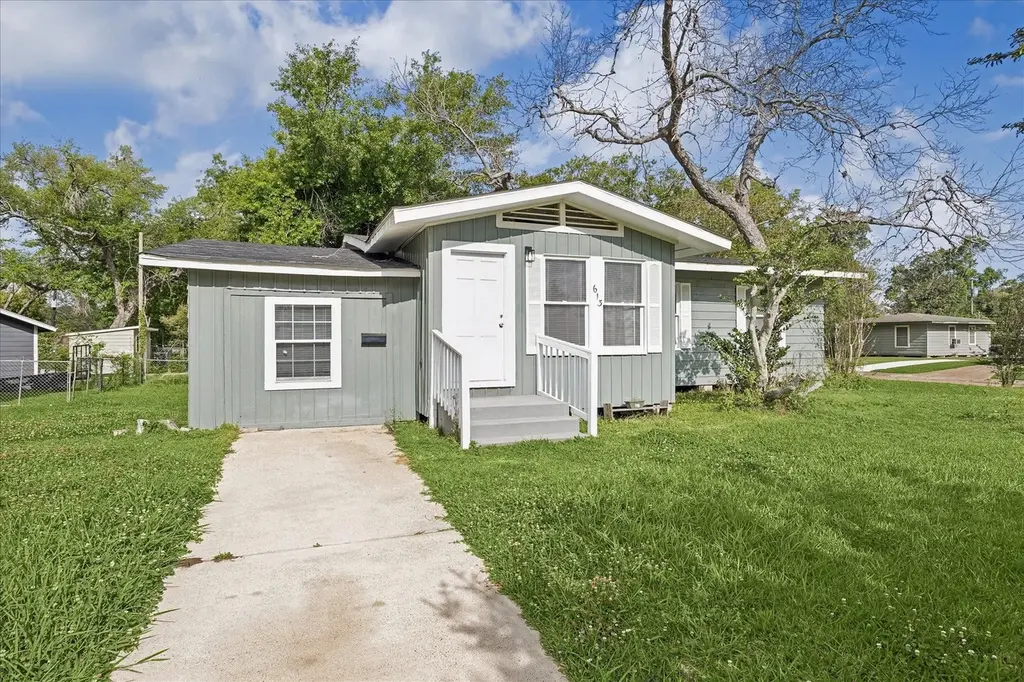
613 Winding Way St · Lake Jackson, TX
Flood risk 3/10 · Minor
- FEMA flood zone
- X
- Chance of flooding over 30 yrs
- 0.09%
- Est. flood insurance / yr
- $507 – $1,088
Fire risk 1/10 · Minimal
- Est. fire insurance / yr
- $1,222 – $2,270
Heat risk 10/10 · Severe
- Hot days now (above 114°F)
- 7 days/yr
- Hot days in 30 yrs
- 26 days/yr
Wind risk 9/10 · Severe
- Chance of severe wind over 30 yrs
- 99.0%
Air-quality risk 2/10 · Minimal
- Unhealthy air days now
- 1 days/yr
- Unhealthy air days in 30 yrs
- 1 days/yr
Risk factors via First Street. Map © Google.
Why this score? — see what drove the B- grade
The composite is a weighted blend of 9 inputs, each scored 0–100. Each bar is that input's sub-score; the figure is the points it added to the 100-point composite (weight × sub-score).
- Cash flow +24.6/30.0
- ARV discount +13.4/15.0
- DSCR +8.0/10.0
- 1% rule +6.8/10.0
- Livability +3.9/5.0
- Schools +3.7/10.0
- Condition / age +2.5/5.0
- Rent growth +2.2/5.0
- Appreciation +0.0/10.0
$157,000
🖨 Deal sheet (PDF) 📄 Offer letter ✓ Due diligence
Listing remarks
This 3 bedroom 1 bathroom home was recently remodeled and move-in ready. Featuring a spacious open living area filled with natural light, this home offers both comfort and functionality. The updated kitchen includes new granite countertops, a new stove, and a dishwasher, perfect for everyday living and entertaining. Vinyl plank flooring runs through the main living areas, while the bedrooms feature fresh carpet and neutral paint throughout. The bathroom has been tastefully updated with new fixtures, tile, and a modern tile surround. Ideally situated in Lake Jackson, this home provides convenient access to dining, shopping, and entertainment. Just minutes from Surfside Beach and close to Fre
Key facts
- 8,642 sq ft lot
- Built 1943
- Listed 16 days
Property features AI
Exterior
- Utilities: Public water; Public sewer
- Home design: Residential property; Built in 1943; Pillar/post/pier foundation; Composition roof
- Construction: Wood siding construction
- Exterior features: Corner lot in a subdivision
Interior
- Bathrooms: 1 full bathroom
- Heating & cooling: Central heating (electric); Central air conditioning (electric)
- Interior features: 5 total rooms
Neighborhood map
What this means for you Summary
Snapshot
- This is a 4-bed/1.0-bath single-family listed at $157k.
Deal economics
- At list price, monthly cash flow is $325 ($4k/yr) — positive.
- The deal already cash-flows at list — no discount required.
- Meets the 1% rule at list price ($2k rent vs $157k).
- Recommended offer: $155k (1.5% below list) — sets the bar for market timing.
- Cap rate 8.8% vs local median 3.8% in Lake Jackson — top-decile yield for the area; either an underpriced asset or a hidden risk that comps aren't pricing in. Stress-test before assuming the spread holds.
Location & tenants
- Location reads 78/100 on livability (#76 in TX, #2,709 nationally) — a middle-class / working-renter tenant base. Strengths: employment A+, cost of living A+, housing A+; Watch: amenities C-, commute F.
- Brazosport ISD (suburban): math 43% / reading 41% proficiency, ranked #305 of 826 in TX (top 37%) — families likely to look elsewhere, expect single-tenant / working-renter base with shorter leases.
- Zoned schools: Elisabet Ney Pre-Kindergarten Campus (213 students, 75% FRL); Rasco Middle (math 45% / reading 50%, grade C-, #408 of 1,662 statewide, top 25%, 731 students, 58% FRL); Brazoswood H S (math 38% / reading 44%, grade F, #774 of 1,632 statewide, top 49%, 2,398 students, 54% FRL).
- Market conditions: Rents soft (-1.1%/yr); 231 active listings in the ZIP; 5 comparable units currently listed for rent nearby; rentals lingering (median 46d on market — plan ~5-8 weeks vacancy on turnover, expect pricing pressure); 80% of comp listings sitting > 30 days — soft ceiling on asking rent; solid renter incomes; 3,960 units permitted in Brazoria County in 2024 (593 in 5+ unit buildings).
Forward outlook
- Local home prices are declining (-3.0%/yr); year-one equity from $1k of loan paydown is wiped out by about $5k of value loss. Plan a longer hold.
- Brazoria County population projected at +44% by 2050 — long-run rental-demand tailwind backs the buy-and-hold thesis.
Negotiation context
- It's been on market 16 days — a 2% lower offer ($155k) is reasonable based on typical stale-listing flexibility.
- 9 sale attempts since 2y ago with the ask held roughly flat each time — persistent listings suggest the price (not the market) is what's stuck; bring a comps-based counter.
Risks & watch-outs
- Watch-outs: built in 1943 — expect roof / HVAC / electrical / plumbing capex.
- Climate carrying-cost: severe wind risk, 99% chance of damaging wind over 30y; extreme-heat days projected 7→26/yr by 2055 (HVAC capex compounding) — expect insurance premiums to compound above CPI over the hold.
Questions for the listing agent
- Built in 1943 — when were the roof, HVAC, electrical panel, plumbing, and water heater last replaced?
- Is there a deadline driving the sale (1031 exchange, divorce, estate, relocation)? That informs how much negotiation room exists.
- What's the average days-on-market for RENTAL listings here right now (not sales)? A rising rental-DOM trend means longer vacancies and softer asking-rent achievability than the comps imply.
- What's the recent tenant-quality profile in this submarket — average credit score on applications, eviction rate, late-payment / NSF rate, and stable-employment percentage? A property-management company in the area should have these aggregated.
- How much new for-sale + rental construction is in the pipeline within 1–3 miles? Heavy new supply typically softens prices + rents 12–24 months out; constrained supply supports both.
Investment metrics
- 1% rule
- 1.18% ✓
- Cap rate
- 8.78%
- Cash-on-cash
- 8.88%
- DSCR
- 1.40
- GRM
- 7.1
CMA / ARV
- ARV (median comp)
- $180,705
- List price
- $157,000
- Delta
- -13.12%
- Verdict
- UNDERPRICED
- Comps
- 20 within 1.0 mi
Show comp detail 12 sales within ~0.75 mi
| Address | Dist | Beds/Ba | Sqft | Sold | Price | $/sf | Match |
|---|---|---|---|---|---|---|---|
| 505 Winding Way St | 0.13mi | 3/2.0 (-1) | 1,212 (-4%) | 9mo | $179,900 | $148 | 71 |
| 501 Magnolia St | 0.23mi | 3/2.0 (-1) | 1,143 (-9%) | 2mo | $119,700 | $105 | 63 |
| 404 Wisteria St | 0.28mi | 3/1.0 (-1) | 1,168 (-7%) | 8mo | $195,000 | $167 | 63 |
| 217 Carnation St | 0.38mi | 3/2.0 (-1) | 1,185 (-6%) | 1mo | $190,000 | $160 | 62 |
| 103 Jasmine St | 0.37mi | 3/2.0 (-1) | 1,333 (+6%) | 5mo | $199,900 | $150 | 60 |
| 105 Wisteria St | 0.13mi | 3/2.0 (-1) | 1,113 (-12%) | 9mo | $205,000 | $184 | 58 |
| 420 Azalea St | 0.57mi | 3/1.0 (-1) | 1,334 (+6%) | 2mo | $100,000 | $75 | 57 |
| 411 Center Way | 0.35mi | 4/2.0 | 1,432 (+14%) | 2mo | $117,000 | $82 | 55 |
| 116 Chestnut St | 0.56mi | 3/1.5 (-1) | 1,350 (+7%) | 8mo | $117,000 | $87 | 48 |
| 119 Mulberry St | 0.66mi | 3/2.0 (-1) | 1,324 (+5%) | 9mo | $199,900 | $151 | 45 |
| 846 Magnolia St | 0.63mi | 4/2.0 | 1,144 (-9%) | 10mo | $189,900 | $166 | 43 |
| 309 Nasturtium St | 0.75mi | 3/2.0 (-1) | 1,436 (+14%) | 10mo | $211,400 | $147 | 25 |
Match score weights: distance 35% · size 25% · config 20% · recency 20%. Top-matched comps best support the ARV.
Projected returns pro-forma
-3.0% appreciation · 0.0% rent growth · sell at horizon
- IRR
- -6.4%
- Equity multiple
- 0.77×
- Total profit
- $-10,088
- Equity at exit
- $23,409
- IRR
- -1.1%
- Equity multiple
- 0.94×
- Total profit
- $-2,837
- Equity at exit
- $13,574
Cash invested: $43,960 (down + closing). Projections, not guarantees.
Landlord ↔ Tenant lean methodology
- Overall (STATE)
- 87 Strongly Landlord-Friendly
- State Texas
- 87 Strongly Landlord-Friendly · R+5
- County
- — inherits STATE
- City
- — inherits STATE
ZIP-level market 77566
- Home prices YoY
- -25.2%
- Rents YoY
- -1.1%
- Active inventory
- 231
- Price-to-rent
- 7.1×
Monthly cashflow live
- Estimated rent
- $1,853 high interval (Pro) →
- Mortgage (P&I)
- −$823
- Tax from tax record
- −$249 /mo · $2,993/yr
- Insurance
- −$65
- HOA
- −$0
- Vacancy / Maint / Mgmt
- −$389
- Net cashflow
- $325
Break-even live
Sensitivity live
| Price | -10% $414 | -5% $370 | +0% $325 | +5% $281 | +10% $236 |
|---|---|---|---|---|---|
| Rent | -10% $179 | -5% $252 | +0% $325 | +5% $399 | +10% $472 |
| Rate | -1.0pp $404 | -0.5pp $365 | base $325 | +0.5pp $285 | +1.0pp $243 |
UW: 25.0% down · 7.5% · 30yr · 1.5% tax · 5.0% vac · 8.0% maint · 8.0% mgmt
Financing live
Cash to close
- Down payment
- $39,250
- Closing costs
- $4,710
- Reserves months
- —
- Total cash needed
- —
Loan-product check · same deal, 3 products live
Conventional
25% down · 7.5% · 30yr
- Down + closing
- —
- Monthly P&I
- —
- Monthly cashflow
- —
- DSCR
- —
- Eligible?
- —
Personal DTI + credit; lowest rate.
DSCR
20% down · 8.5% · 30yr
- Down + closing
- —
- Monthly P&I
- —
- Monthly cashflow
- —
- DSCR
- —
- Eligible?
- —
No personal income docs; deal must DSCR.
Hard money
10% down · 12.0% · 12mo
- Down + closing
- —
- Monthly P&I
- —
- Monthly cashflow
- —
- DSCR
- —
- Eligible?
- —
Short-term bridge; refi at stabilization.
Rent comps 5 comps
| Address | Beds | Baths | Sqft | Rent | $/sqft | DOM | Units | Dist |
|---|---|---|---|---|---|---|---|---|
| 523 Wisteria St Lake Jackson, TX | 3.0 | 1.5 | 1508 | $1,775 | $1.18 | 46d | 1 | 0.61mi |
| 460 TX-332 Lake Jackson, TX | 1.0–3.0 | 1.0–2.0 | 836 | $1,453 | $1.74 | 46d | 17 | 0.81mi |
| 460 TX-332 Lake Jackson, TX | 1.0–3.0 | 1.0–2.0 | 836 | $1,203 | $1.44 | 1d | 10 | 0.81mi |
| 214 Oleander St Lake Jackson, TX | 3.0 | 2.0 | 1423 | $2,000 | $1.41 | 46d | 1 | 1.10mi |
| 138 Oyster Creek Dr Lake Jackson, TX | 3.0 | 2.0 | 1175 | $1,525 | $1.30 | 46d | 1 | 1.21mi |
Listing history 23 events
-
2026-06-22days on market $157,000 Active 16 DOM
-
2026-06-21days on market $157,000 Active 15 DOM
-
2026-06-18status $157,000 Active 12 DOM
-
2026-05-07$157,000 Active 821-char remark
-
2026-05-07historical
-
2026-04-07$164,000 Active
-
2025-01-14historical $1,450
-
2025-01-14historical
-
2024-12-30status Active
-
2024-12-11historical
-
2024-12-10$1,450
-
2024-12-10status Active
-
2024-12-09status Pending
-
2024-11-28historical $1,450
-
2024-11-28status Option Pending
-
2024-10-21$1,450
-
2024-10-20$155,000 Active
-
2024-04-26historical
-
2024-04-25historical $1,450
-
2024-04-08$1,450
-
2024-04-07$165,000 Active
-
2021-12-03soldstatus
-
1995-07-13soldstatus
ⓘ Source: listings_history table (triggers on properties + properties_extension) + one-shot
backfill from property_details.listing_events for pre-trigger history.
Tax reassessment forecast TX · Resets to sale price
- Current annual tax
- $2,993 · $249/mo
- Projected year-2 tax
- $2,993 · $249/mo
- Expected delta
- $0/yr ($0/mo · 0.0%)
ⓘ Screening estimate from a state-policy table — verify with the county assessor before closing.
Climate risk First Street
- Flood 3/10 Moderate FEMA zone X · 9% chance over 30 yrs
- Wildfire 1/10 Low
- Heat 10/10 Extreme 7 d/yr ≥114°F today · 26 d/yr by 30 yrs out
- Wind 9/10 Extreme 99% chance of damaging wind over 30 yrs
- Air quality 2/10 Low 1 unhealthy d/yr today · 1 by 30 yrs out
Nearby sold comps map
Loading sold comps map…
Walkable amenities ~0.75 mi
Loading nearby amenities…
Taxation est. · year 1
- Rental income
- $22,230
- − Mortgage interest
- −$8,794
- − Property taxes
- −$2,993
- − Insurance
- −$785
- − Repairs & maintenance
- −$1,778
- − Management
- −$1,778
- − Depreciation
- −$4,567
- Taxable income
- $1,534
- Est. tax owed @ 24.0%
- −$368
- After-tax cash flow
- $3,536/yr
For passive investors: Depreciation is non-cash, so a rental often shows a tax loss while cash-flowing — sheltering income. Rental losses are passive: they offset passive income freely, and up to $25,000/yr can offset ordinary (W-2) income if you actively participate and your MAGI is under $100k (phasing out to $0 by $150k); unused losses carry forward. On sale, claimed depreciation is recaptured at up to 25%, and gains may owe capital-gains tax (a 1031 exchange can defer both). Figures are a year-1 estimate at your 24.0% rate — not tax advice; consult a CPA.
Schools (NCES district)
- District
- Brazosport ISD
- NCES district ID
- 4811190
- Math proficiency
- 43% ▼ -6.00%
- Reading proficiency
- 41% ▼ -2.00%
- Median HH income
- $57,024
- Composite
- 36.84/100
- National rank
- #4557
- State rank
- #305 of 826 in TX
Livability — Lake Jackson
- Score
- 78/100
- State rank
- #76
- US rank
- #2709
Category grades
Schools grade is shown separately in the Schools card above.
Census & demographics
- Census place
- Lake Jackson, TX
- County
- Brazoria County · 374,982 people
- City population
- 30,246
- Metro
- Houston-The Woodlands-Sugar Land, TX
- Population (ZIP)
- 30,246
- Household income
- $92,586
- Rent vs Own
- Severe rent burden
- 1126.0
Population outlook (Brazoria County) Hauer SSP2
- Today (2025)
- 420,414 people
- By 2030
- 457,585 · +8.8%
- By 2040
- 532,232 · +26.6%
- By 2050
- 605,399 · +44.0%
- By 2075
- 779,358 · +85.4%
- By 2100
- 883,759 · +110.2%
Race, ethnicity, and origin ACS 2023
- Neighborhood character
- Diverse neighborhood (Simpson 0.56)
- Race & ethnicity
- White 60% Hispanic / Latino 28% Two or more races 16% Black 7% Asian 2%
- Hispanic origin (detail)
- Mexican 24%
- Common ancestry
- Lithuanian 3% Serbian 2% Italian 1%
- Foreign-born
- 8% · Canada, South Korea
- Languages at home
- 83% English-only · Spanish 15% Arabic 1% Tagalog/Filipino 1%
Political lean MEDSL · Brazoria
- 2024 margin
- R (+19.7) · D 39.5% · R 59.2% · Other 1.3%
- 2008→2024 swing
- +9.9pp toward D · 2008: -29.6pp · 2024: -19.7pp
- All cycles
- 2024: R+19.7 2020: R+18.2 2016: R+24.6 2012: R+34.2 2008: R+29.6
Not yet ingested
- Civics
- —
Market trends
- HPI YoY
- ▼ -84.81%
- Current HPI
- 251.8234
- Rent YoY
- ▼ -1.11%
- Metro
- Houston-The Woodlands-Sugar Land, TX
- State GDP YoY
- ▲ 3.95%
- F500 in state
- 110
Industry mix (Fortune 500 HQ in TX)
| Industry | F500 HQs | Revenue |
|---|---|---|
| Energy | 16 | $1,198B |
|
||
| Technology | 5 | $198B |
|
||
| Engineering / Construction | 4 | $72B |
|
||
| Energy Services | 3 | $60B |
|
||
| Utilities | 3 | $41B |
|
||
| Healthcare | 2 | $330B |
|
||
Price history
-4.8% since first listed21 events — show timeline
- 2026-05-20 Pending — HARMLS
- 2026-05-07 Listing Removed — HARMLS
- 2026-05-07 Listed $157,000 HARMLS
- 2026-04-07 Listed $164,000 HARMLS
- 2025-01-14 Rental Removed $1,450 HARMLS
- 2025-01-14 Listing Removed — HARMLS
- 2024-12-30 Relisted — HARMLS
- 2024-12-11 Listing Removed — HARMLS
- 2024-12-10 Listed for Rent $1,450 HARMLS
- 2024-12-10 Relisted — HARMLS
- 2024-12-09 Pending — HARMLS
- 2024-11-28 Rental Removed $1,450 HARMLS
- 2024-11-28 Pending — HARMLS
- 2024-10-21 Listed for Rent $1,450 HARMLS
- 2024-10-20 Listed $155,000 HARMLS
- 2024-04-26 Listing Removed — HARMLS
- 2024-04-25 Rental Removed $1,450 HARMLS
- 2024-04-08 Listed for Rent $1,450 HARMLS
- 2024-04-07 Listed $165,000 HARMLS
- 2021-12-03 Sold (Public Records) — Public Records
- 1995-07-13 Sold (Public Records) — Public Records
Property tax history
+5.0%/yrLatest (2025): $2,993 · +1.4% YoY. Source: county tax records.
Cash-flow waterfall
monthlySold comps — $/sqft
last 12 mo · ≤1 miLoading sold comps…