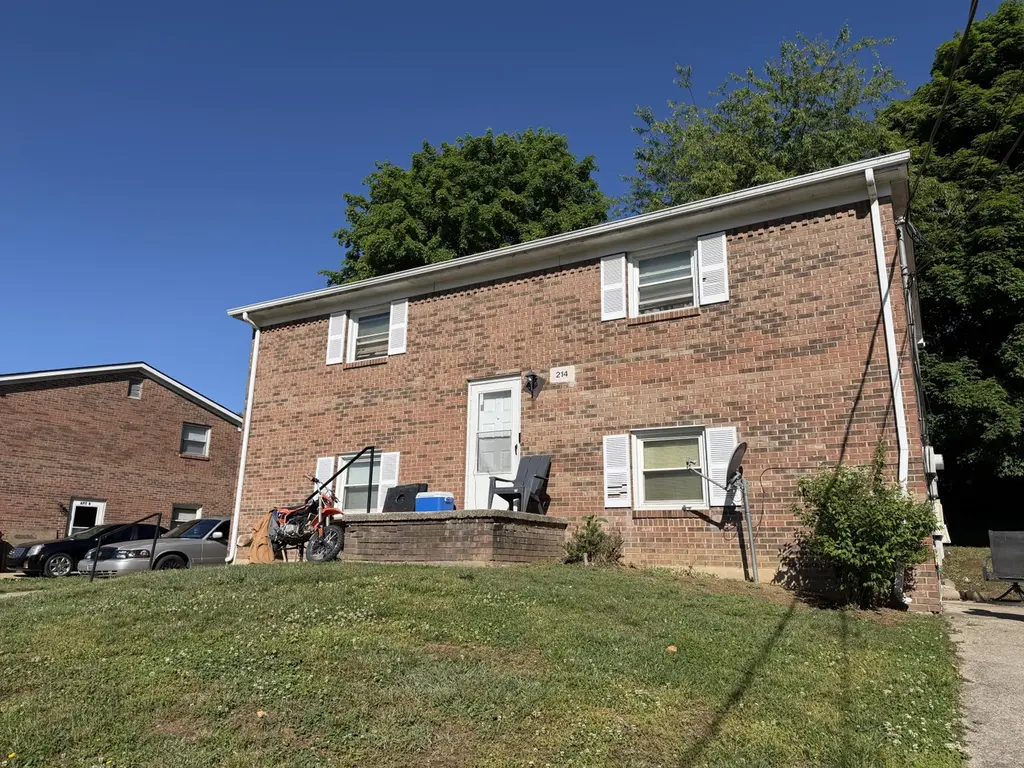
214 Valley St · Richmond, KY
Flood risk 1/10 · Minimal
- FEMA flood zone
- X (unshaded)
- Chance of flooding over 30 yrs
- 0.0%
- Est. flood insurance / yr
- $507 – $1,088
Fire risk 3/10 · Minor
- Est. fire insurance / yr
- $839 – $1,559
Heat risk 4/10 · Minor
- Hot days now (above 102°F)
- 7 days/yr
- Hot days in 30 yrs
- 19 days/yr
Wind risk 2/10 · Minimal
- Chance of severe wind over 30 yrs
- 3.0%
Air-quality risk 1/10 · Minimal
- Unhealthy air days now
- 0 days/yr
- Unhealthy air days in 30 yrs
- 0 days/yr
Risk factors via First Street. Map © Google.
Why this score? — see what drove the D- grade
The composite is a weighted blend of 9 inputs, each scored 0–100. Each bar is that input's sub-score; the figure is the points it added to the 100-point composite (weight × sub-score).
- ARV discount +15.0/15.0
- Cash flow +7.4/30.0
- Livability +3.5/5.0
- Schools +3.3/10.0
- Rent growth +3.2/5.0
- Condition / age +2.5/5.0
- DSCR +1.5/10.0
- 1% rule +1.0/10.0
- Appreciation +0.0/10.0
$235,000
🖨 Deal sheet (PDF) 📄 Offer letter ✓ Due diligence
Listing remarks
214 Valley Street offers the opportunity to acquire a fully occupied, income-producing, value-add duplex in the heart of Richmond, Kentucky. Located just off the Richmond Bypass near a major retail corridor, the property benefits from strong rental demand and limited multifamily inventory in the area. The property features two 2-bedroom, 1-bath units totaling 4 bedrooms and 2 full baths. Both units include central heat and air, washer/dryer hookups, vinyl windows approximately six years old, and carpet and vinyl flooring throughout. Recent improvements include a new roof in 2023, new eaves in 2026, and driveway repairs completed in 2026. Currently 100% occupied, the property generates appr
Key facts
- Strong rental demand
- Vinyl windows
- Central heat and air
Tags
Property features AI
Finance
- Other: Parcel: R012-0003-0001; Lot size approximately 0.2207 acres
- Financial info: 2 total units (multi-unit property)
Exterior
- Parking: On-site paved parking
- Utilities: Electricity connected; Water connected; Sewer connected
- Home design: Duplex; 2-story
- Construction: 1,800 total building area
- Exterior features: Paved on-site parking; Lot in Ramsey Addition subdivision; Zoned R-2
Interior
- Bathrooms: 2 full bathrooms
- Heating & cooling: Electric forced-air heating; Central air conditioning
- Interior features: Main-level and upper-level washer and dryer hookups; Electric dryer hookup
- Laundry & utility: Washer hookup; Electric dryer hookup; Washer hookup on upper level; Washer hookup on main level
Neighborhood map
What this means for you Summary
Snapshot
- This is a 4-bed/2.0-bath single-family listed at $235k.
Deal economics
- At list price, monthly cash flow is $-306 ($-4k/yr) — negative.
- To cash-flow at today's rent, offer at most $181k (23.0% below list).
- To meet the 1% rule (rent ≥ 1% of price), the offer needs to be $141k (39.9% below list).
- Recommended offer: $141k (39.9% below list) — sets the bar for 1% rule.
- Cap rate 4.7% vs local median 3.0% in Richmond — top-decile yield for the area; either an underpriced asset or a hidden risk that comps aren't pricing in. Stress-test before assuming the spread holds.
Location & tenants
- Location reads 69/100 on livability (#163 in KY) — a middle-class / working-renter tenant base. Strengths: cost of living A+, health & safety A+, housing A; Watch: amenities F, commute F, employment F.
- Madison County (town): math 31% / reading 47% proficiency, ranked #35 of 165 in KY (top 21%) — families likely to look elsewhere, expect single-tenant / working-renter base with shorter leases.
- Zoned schools: Daniel Boone Elementary School (math 22% / reading 37%, grade F, #393 of 676 statewide, top 63%, 477 students, 57% FRL); B. Michael Caudill Middle School (math 44% / reading 60%, grade C+, #18 of 217 statewide, top 8%, 479 students, 52% FRL); Madison Central High School (math 29% / reading 44%, grade F, #70 of 254 statewide, top 27%, 2,226 students, 47% FRL).
- Market conditions: Rents rising (+2.8%/yr); 502 active listings in the ZIP; 1 comparable units currently listed for rent nearby; 453 units permitted in Madison County in 2024 (64 in 5+ unit buildings).
Forward outlook
- Local home prices are declining (-3.0%/yr); year-one equity from $2k of loan paydown is wiped out by about $7k of value loss. Plan a longer hold.
- Madison County population projected at +28% by 2050 — long-run rental-demand tailwind backs the buy-and-hold thesis.
Negotiation context
- It's been on market 40 days — a 3% lower offer ($228k) is reasonable based on typical stale-listing flexibility.
Questions for the listing agent
- What do current leases actually rent for vs. the listed asking? Can we see a recent rent roll and the last 12 months of T-12 income?
- It's been on market 40 days. Have you received any prior offers? Is the seller open to a 40% concession, seller financing, or rate buy-down credit?
- Is there a deadline driving the sale (1031 exchange, divorce, estate, relocation)? That informs how much negotiation room exists.
- Schools are D-rated, which usually means shorter tenancies and higher turnover. Who's the typical renter profile here, and what's been the actual vacancy rate?
- The area grade is low — what's the realistic commute time and amenity access for the typical tenant pool here? Any planned neighborhood developments (good or bad) we should know about?
- What's the average days-on-market for RENTAL listings here right now (not sales)? A rising rental-DOM trend means longer vacancies and softer asking-rent achievability than the comps imply.
- What's the recent tenant-quality profile in this submarket — average credit score on applications, eviction rate, late-payment / NSF rate, and stable-employment percentage? A property-management company in the area should have these aggregated.
- How much new for-sale + rental construction is in the pipeline within 1–3 miles? Heavy new supply typically softens prices + rents 12–24 months out; constrained supply supports both.
Investment metrics
- 1% rule
- 0.60% ✗
- Cap rate
- 4.73%
- Cash-on-cash
- -5.58%
- DSCR
- 0.75
- GRM
- 13.9
CMA / ARV
- ARV (median comp)
- $290,246
- List price
- $235,000
- Delta
- -19.03%
- Verdict
- UNDERPRICED
- Comps
- 6 within 2.0 mi
Show comp detail 1 sale within ~0.75 mi
| Address | Dist | Beds/Ba | Sqft | Sold | Price | $/sf | Match |
|---|---|---|---|---|---|---|---|
| 102 Highland View St | 0.50mi | 3/1.5 (-1) | 900 (0%) | 16mo | $135,010 | $150 | 56 |
Match score weights: distance 35% · size 25% · config 20% · recency 20%. Top-matched comps best support the ARV.
Projected returns pro-forma
-3.0% appreciation · 2.82% rent growth · sell at horizon
- IRR
- -26.1%
- Equity multiple
- 0.12×
- Total profit
- $-57,920
- Equity at exit
- $35,039
- IRR
- -23.6%
- Equity multiple
- -0.17×
- Total profit
- $-76,985
- Equity at exit
- $20,319
Cash invested: $65,800 (down + closing). Projections, not guarantees.
Landlord ↔ Tenant lean methodology
- Overall (STATE)
- 83 Strongly Landlord-Friendly
- State Kentucky
- 83 Strongly Landlord-Friendly · R+16
- County
- — inherits STATE
- City
- — inherits STATE
ZIP-level market 40475
- Home prices YoY
- -22.7%
- Rents YoY
- 2.8%
- Active inventory
- 502
- Price-to-rent
- 13.9×
Monthly cashflow live
- Estimated rent
- $1,412 medium interval (Pro) →
- Mortgage (P&I)
- −$1,232
- Tax from tax record
- −$91 /mo · $1,094/yr
- Insurance
- −$98
- HOA
- −$0
- Vacancy / Maint / Mgmt
- −$297
- Net cashflow
- $-306
Break-even live
Sensitivity live
| Price | -10% $-173 | -5% $-239 | +0% $-306 | +5% $-372 | +10% $-439 |
|---|---|---|---|---|---|
| Rent | -10% $-417 | -5% $-362 | +0% $-306 | +5% $-250 | +10% $-194 |
| Rate | -1.0pp $-188 | -0.5pp $-246 | base $-306 | +0.5pp $-367 | +1.0pp $-429 |
UW: 25.0% down · 7.5% · 30yr · 1.5% tax · 5.0% vac · 8.0% maint · 8.0% mgmt
Financing live
Cash to close
- Down payment
- $58,750
- Closing costs
- $7,050
- Reserves months
- —
- Total cash needed
- —
Loan-product check · same deal, 3 products live
Conventional
25% down · 7.5% · 30yr
- Down + closing
- —
- Monthly P&I
- —
- Monthly cashflow
- —
- DSCR
- —
- Eligible?
- —
Personal DTI + credit; lowest rate.
DSCR
20% down · 8.5% · 30yr
- Down + closing
- —
- Monthly P&I
- —
- Monthly cashflow
- —
- DSCR
- —
- Eligible?
- —
No personal income docs; deal must DSCR.
Hard money
10% down · 12.0% · 12mo
- Down + closing
- —
- Monthly P&I
- —
- Monthly cashflow
- —
- DSCR
- —
- Eligible?
- —
Short-term bridge; refi at stabilization.
Rent comps 1 comps
| Address | Beds | Baths | Sqft | Rent | $/sqft | DOM | Units | Dist |
|---|---|---|---|---|---|---|---|---|
| 633 Big Hill Ave Richmond, KY | 1.0–3.0 | 1.0 | 775 | $1,150 | $1.48 | 45d | 1 | 0.36mi |
Listing history 17 events
-
2026-06-21days on market $235,000 Active 40 DOM
-
2026-06-18days on market $235,000 Active 37 DOM
-
2026-06-17days on market $235,000 Active 36 DOM
-
2026-06-16days on market $235,000 Active 35 DOM
-
2026-06-15days on market $235,000 Active 34 DOM
-
2026-06-14days on market $235,000 Active 32 DOM
-
2026-06-10days on market $235,000 Active 29 DOM
-
2026-06-09days on market $235,000 Active 28 DOM
-
2026-06-08days on market $235,000 Active 27 DOM
-
2026-06-07days on market $235,000 Active 26 DOM
-
2026-06-05pricedays on market $235,000 Active 23 DOM
-
2026-06-03days on market $239,900 Active 22 DOM
-
2026-06-02days on market $239,900 Active 21 DOM
-
2026-06-01days on market $239,900 Active 20 DOM
-
2026-05-31days on market $239,900 Active 19 DOM
-
2026-05-31days on market $239,900 Active 18 DOM
-
2026-05-08$239,900 Active 1215-char remark
ⓘ Source: listings_history table (triggers on properties + properties_extension) + one-shot
backfill from property_details.listing_events for pre-trigger history.
Tax reassessment forecast KY · Resets to sale price
- Current annual tax
- $1,094 · $91/mo
- Projected year-2 tax
- $2,021 · $168/mo
- Expected delta
- +$927/yr (+$77/mo · 84.8%)
ⓘ Screening estimate from a state-policy table — verify with the county assessor before closing.
Climate risk First Street
- Flood 1/10 Low FEMA zone X (unshaded) · 0% chance over 30 yrs
- Wildfire 3/10 Moderate
- Heat 4/10 Moderate 7 d/yr ≥102°F today · 19 d/yr by 30 yrs out
- Wind 2/10 Low 3% chance of damaging wind over 30 yrs
- Air quality 1/10 Low 0 unhealthy d/yr today · 0 by 30 yrs out
Nearby sold comps map
Loading sold comps map…
Walkable amenities ~0.75 mi
Loading nearby amenities…
Taxation est. · year 1
- Rental income
- $16,945
- − Mortgage interest
- −$13,164
- − Property taxes
- −$1,094
- − Insurance
- −$1,175
- − Repairs & maintenance
- −$1,356
- − Management
- −$1,356
- − Depreciation
- −$6,836
- Taxable loss
- −$8,035
- Est. tax savings @ 24.0%
- +$1,928
- After-tax cash flow
- $-1,742/yr
For passive investors: Depreciation is non-cash, so a rental often shows a tax loss while cash-flowing — sheltering income. Rental losses are passive: they offset passive income freely, and up to $25,000/yr can offset ordinary (W-2) income if you actively participate and your MAGI is under $100k (phasing out to $0 by $150k); unused losses carry forward. On sale, claimed depreciation is recaptured at up to 25%, and gains may owe capital-gains tax (a 1031 exchange can defer both). Figures are a year-1 estimate at your 24.0% rate — not tax advice; consult a CPA.
Schools (NCES district)
- District
- Madison County
- NCES district ID
- 2103720
- Math proficiency
- 31% ▼ -16.00%
- Reading proficiency
- 47% ▼ -14.00%
- Median HH income
- $43,590
- Composite
- 32.99/100
- National rank
- #5580
- State rank
- #35 of 165 in KY
Livability — Richmond
- Score
- 69/100
- State rank
- #163
- US rank
- #8196
Category grades
Schools grade is shown separately in the Schools card above.
Census & demographics
- Census place
- Richmond, KY
- County
- Madison County · 93,568 people
- City population
- 65,961
- Metro
- Richmond-Berea, KY
- Population (ZIP)
- 65,961
- Household income
- $63,050
- Rent vs Own
- Severe rent burden
- 2031.0
Population outlook (Madison County) Hauer SSP2
- Today (2025)
- 99,241 people
- By 2030
- 104,927 · +5.7%
- By 2040
- 116,079 · +17.0%
- By 2050
- 127,293 · +28.3%
- By 2075
- 155,644 · +56.8%
- By 2100
- 176,488 · +77.8%
Race, ethnicity, and origin ACS 2023
- Neighborhood character
- Predominantly White (87%)
- Race & ethnicity
- White 87% Two or more races 5% Black 4% Hispanic / Latino 3%
- Common ancestry
- Slovak 2% Italian 2% Serbian 1%
- Foreign-born
- 3% · Canada
- Languages at home
- 96% English-only · Spanish 3%
Political lean MEDSL · Madison
- 2024 margin
- Solid R (+30.9) · D 33.6% · R 64.5% · Other 1.9%
- 2008→2024 swing
- -8.4pp toward R · 2008: -22.4pp · 2024: -30.9pp
- All cycles
- 2024: R+30.9 2020: R+26.8 2016: R+31.2 2012: R+28.9 2008: R+22.4
Not yet ingested
- Civics
- —
Market trends
- HPI YoY
- ▼ -72.04%
- Current HPI
- 245.8489
- Rent YoY
- ▲ 2.82%
- Metro
- Richmond-Berea, KY
- State GDP YoY
- ▲ 1.81%
- F500 in state
- 4
Industry mix (Fortune 500 HQ in KY)
| Industry | F500 HQs | Revenue |
|---|---|---|
| Healthcare | 1 | $118B |
|
||
| Food / Beverage | 1 | $7B |
|
||
Price history
-2.0% since first listed2 events — show timeline
- 2026-06-04 Price Changed $235,000 ImagineMLS
- 2026-05-08 Listed $239,900 ImagineMLS
Property tax history
+3.9%/yrLatest (2025): $1,094 · +45.1% YoY. Source: county tax records.
Cash-flow waterfall
monthlySold comps — $/sqft
last 12 mo · ≤1 miLoading sold comps…