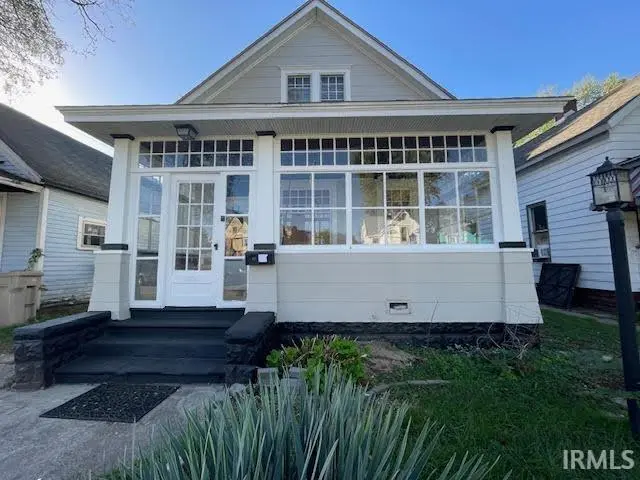
428 W Navarre St · South Bend, IN
Flood risk 1/10 · Minimal
- FEMA flood zone
- X (unshaded)
- Chance of flooding over 30 yrs
- 0.0%
- Est. flood insurance / yr
- $473 – $860
Fire risk 1/10 · Minimal
- Est. fire insurance / yr
- $717 – $1,331
Heat risk 2/10 · Minimal
- Hot days now (above 99°F)
- 7 days/yr
- Hot days in 30 yrs
- 16 days/yr
Wind risk 2/10 · Minimal
- Chance of severe wind over 30 yrs
- —
Air-quality risk 3/10 · Minor
- Unhealthy air days now
- 3 days/yr
- Unhealthy air days in 30 yrs
- 3 days/yr
Risk factors via First Street. Map © Google.
Why this score? — see what drove the C- grade
The composite is a weighted blend of 9 inputs, each scored 0–100. Each bar is that input's sub-score; the figure is the points it added to the 100-point composite (weight × sub-score).
- Cash flow +17.1/30.0
- ARV discount +12.6/15.0
- DSCR +5.3/10.0
- Rent growth +4.1/5.0
- 1% rule +4.0/10.0
- Livability +3.2/5.0
- Condition / age +2.5/5.0
- Schools +1.4/10.0
- Appreciation +0.0/10.0
$145,000
🖨 Deal sheet (PDF) 📄 Offer letter ✓ Due diligence
Listing remarks MLS
Great income producing property! 2 miles from Notre Dame and in the NNN neighborhood. The house features beautiful traditional hardwood and trim, main floor master suite, large main floor laundry room, fenced in back yard, a full bath on each floor. Can be sold with 504 Navarre.
Key facts
- Fenced in back yard
- 4,917 sq ft lot
- 2 garage spots
Tags
Neighborhood map
What this means for you Summary
Snapshot
- This is a 2-bed/2.5-bath single-family listed at $145k.
Deal economics
- At list price, monthly cash flow is $100 ($1k/yr) — positive.
- The deal already cash-flows at list — no discount required.
- To meet the 1% rule (rent ≥ 1% of price), the offer needs to be $130k (10.3% below list).
- Recommended offer: $130k (10.3% below list) — sets the bar for 1% rule.
- Cap rate 7.1% vs local median 4.4% in South Bend — top-decile yield for the area; either an underpriced asset or a hidden risk that comps aren't pricing in. Stress-test before assuming the spread holds.
Location & tenants
- Location reads 64/100 on livability (#365 in IN) — a middle-class / working-renter tenant base. Strengths: cost of living A+, housing A+, health & safety A+; Watch: amenities D, employment D, crime F.
- South Bend Community School Corporation (urban): math 12% / reading 21% proficiency, ranked #284 of 301 in IN (top 94%) — low school quality limits family demand, transient renter base, plan for 1-2y turnover; 66% free/reduced lunch — lower-income household profile, screen leases tightly.
- Zoned schools: Madison S.T.E.A.M. Academy (math 2% / reading 2%, grade F, #994 of 994 statewide, top 100%, 618 students, 93% FRL); Jackson Middle School (math 3% / reading 8%, grade F, #326 of 330 statewide, top 99%, 528 students, 82% FRL); Adams High School (math 28% / reading 57%, grade F, #195 of 369 statewide, top 53%, 1,976 students, 56% FRL).
- Market conditions: Rents rising fast (+6.5%/yr); 44 active listings in the ZIP; 15 comparable units currently listed for rent nearby; rentals at typical pace (median 23d on market — plan ~3-4 weeks tenant-placement turnaround); 754 units permitted in St. Joseph County in 2024 (460 in 5+ unit buildings).
Forward outlook
- Local home prices are declining (-3.0%/yr); year-one equity from $1k of loan paydown is wiped out by about $4k of value loss. Plan a longer hold.
Negotiation context
- It's been on market 78 days — a 6% lower offer ($136k) is reasonable based on typical stale-listing flexibility.
- 6 sale attempts since 8y ago with the ask held roughly flat each time — persistent listings suggest the price (not the market) is what's stuck; bring a comps-based counter.
- Current owner paid $99k; 46% above their basis — modest negotiation headroom, anchor on the comps not their cost.
Risks & watch-outs
- Watch-outs: built in 1888 — expect roof / HVAC / electrical / plumbing capex.
Questions for the listing agent
- It's been on market 78 days. Have you received any prior offers? Is the seller open to a 10% concession, seller financing, or rate buy-down credit?
- Built in 1888 — when were the roof, HVAC, electrical panel, plumbing, and water heater last replaced?
- Why hasn't it sold? Are there any deal-killer items the seller is aware of (foundation, flood, title, zoning, code violations)?
- Is there a deadline driving the sale (1031 exchange, divorce, estate, relocation)? That informs how much negotiation room exists.
- Schools are F-rated, which usually means shorter tenancies and higher turnover. Who's the typical renter profile here, and what's been the actual vacancy rate?
- Crime grade is F in this area — have there been break-ins, vandalism, or insurance claims at this property in the last 3 years? What carrier currently insures it and at what premium?
- What's the average days-on-market for RENTAL listings here right now (not sales)? A rising rental-DOM trend means longer vacancies and softer asking-rent achievability than the comps imply.
- What's the recent tenant-quality profile in this submarket — average credit score on applications, eviction rate, late-payment / NSF rate, and stable-employment percentage? A property-management company in the area should have these aggregated.
- How much new for-sale + rental construction is in the pipeline within 1–3 miles? Heavy new supply typically softens prices + rents 12–24 months out; constrained supply supports both.
Investment metrics
- 1% rule
- 0.90% ✗
- Cap rate
- 7.12%
- Cash-on-cash
- 2.94%
- DSCR
- 1.13
- GRM
- 9.3
CMA / ARV
- ARV (median comp)
- $163,607
- List price
- $145,000
- Delta
- -11.37%
- Verdict
- UNDERPRICED
- Comps
- 20 within 1.0 mi
Show comp detail 12 sales within ~0.75 mi
| Address | Dist | Beds/Ba | Sqft | Sold | Price | $/sf | Match |
|---|---|---|---|---|---|---|---|
| 516 W Navarre St | 0.05mi | 3/2.5 (+1) | 1,624 (-9%) | 10mo | $214,000 | $132 | 69 |
| 1040 Woodward Ave | 0.50mi | 3/2.0 (+1) | 1,656 (-7%) | 4mo | $185,000 | $112 | 55 |
| 1219 Leeper Ave | 0.75mi | 3/1.5 (+1) | 1,847 (+4%) | 0mo | $385,000 | $208 | 50 |
| 204 Tonti St | 0.65mi | 3/2.0 (+1) | 1,696 (-5%) | 8mo | $285,000 | $168 | 48 |
| 122 E North Shore Dr | 0.56mi | 3/2.5 (+1) | 1,649 (-8%) | 10mo | $412,900 | $250 | 48 |
| 807 Diamond Ave | 0.73mi | 3/1.5 (+1) | 1,920 (+8%) | 2mo | $70,000 | $36 | 42 |
| 1125 W Washington St | 0.68mi | 3/1.5 (+1) | 1,636 (-8%) | 4mo | $224,000 | $137 | 42 |
| 744 Blaine Ave | 0.56mi | 3/1.0 (+1) | 1,566 (-12%) | 1mo | $152,000 | $97 | 41 |
| 210 Wakewa Ave | 0.56mi | 3/1.0 (+1) | 1,530 (-14%) | 2mo | $300,000 | $196 | 38 |
| 507 Ostemo Pl | 0.72mi | 3/2.0 (+1) | 1,608 (-10%) | 10mo | $302,000 | $188 | 34 |
| 919 Allen St | 0.60mi | 3/1.5 (+1) | 1,530 (-14%) | 6mo | $175,000 | $114 | 34 |
| 702 W Angela Blvd | 0.74mi | 3/1.0 (+1) | 1,638 (-8%) | 10mo | $285,000 | $174 | 32 |
Match score weights: distance 35% · size 25% · config 20% · recency 20%. Top-matched comps best support the ARV.
Projected returns pro-forma
-3.0% appreciation · 6.49% rent growth · sell at horizon
- IRR
- -8.1%
- Equity multiple
- 0.69×
- Total profit
- $-12,448
- Equity at exit
- $21,620
- IRR
- 5.3%
- Equity multiple
- 1.45×
- Total profit
- $18,075
- Equity at exit
- $12,537
Cash invested: $40,600 (down + closing). Projections, not guarantees.
Landlord ↔ Tenant lean methodology
- Overall (STATE)
- 90 Strongly Landlord-Friendly
- State Indiana
- 90 Strongly Landlord-Friendly · R+11
- County
- — inherits STATE
- City
- — inherits STATE
ZIP-level market 46616
- Home prices YoY
- -17.9%
- Rents YoY
- 6.5%
- Active inventory
- 44
- Price-to-rent
- 9.3×
Monthly cashflow live
- Estimated rent
- $1,301 high interval (Pro) →
- Mortgage (P&I)
- −$760
- Tax from tax record
- −$107 /mo · $1,288/yr
- Insurance
- −$60
- HOA
- −$0
- Vacancy / Maint / Mgmt
- −$273
- Net cashflow
- $100
Break-even live
Sensitivity live
| Price | -10% $182 | -5% $141 | +0% $100 | +5% $59 | +10% $18 |
|---|---|---|---|---|---|
| Rent | -10% $-3 | -5% $48 | +0% $100 | +5% $151 | +10% $202 |
| Rate | -1.0pp $173 | -0.5pp $137 | base $100 | +0.5pp $62 | +1.0pp $24 |
UW: 25.0% down · 7.5% · 30yr · 1.5% tax · 5.0% vac · 8.0% maint · 8.0% mgmt
Financing live
Cash to close
- Down payment
- $36,250
- Closing costs
- $4,350
- Reserves months
- —
- Total cash needed
- —
Loan-product check · same deal, 3 products live
Conventional
25% down · 7.5% · 30yr
- Down + closing
- —
- Monthly P&I
- —
- Monthly cashflow
- —
- DSCR
- —
- Eligible?
- —
Personal DTI + credit; lowest rate.
DSCR
20% down · 8.5% · 30yr
- Down + closing
- —
- Monthly P&I
- —
- Monthly cashflow
- —
- DSCR
- —
- Eligible?
- —
No personal income docs; deal must DSCR.
Hard money
10% down · 12.0% · 12mo
- Down + closing
- —
- Monthly P&I
- —
- Monthly cashflow
- —
- DSCR
- —
- Eligible?
- —
Short-term bridge; refi at stabilization.
Rent comps 15 comps
| Address | Beds | Baths | Sqft | Rent | $/sqft | DOM | Units | Dist |
|---|---|---|---|---|---|---|---|---|
| 504 W Navarre St South Bend, IN | 3.0 | 1.5 | 1520 | $1,350 | $0.89 | 15d | 1 | 0.04mi |
| 211 W Washington St South Bend, IN | 3.0 | 1.0–2.5 | 1162 | $5,399 | $4.64 | 22d | 19 | 0.50mi |
| 1118 Van Buren St South Bend, IN | 3.0 | 1.0 | 1394 | $1,375 | $0.99 | 22d | 1 | 0.55mi |
| 300 E Lasalle Ave South Bend, IN | 3.0 | 1.0–3.0 | 1013 | $2,409 | $2.38 | 15d | 31 | 0.58mi |
| 1032 Allen St South Bend, IN | 3.0 | 2.0 | 1580 | $1,200 | $0.76 | 45d | 1 | 0.62mi |
| 752 Diamond Ave South Bend, IN | 3.0 | 1.5 | 1248 | $1,400 | $1.12 | 45d | 1 | 0.68mi |
| 1243 Portage Ave South Bend, IN | 3.0 | 1.0 | 1570 | $1,500 | $0.96 | 45d | 1 | 0.80mi |
| 116 N Notre Dame Ave South Bend, IN | 3.0 | 1.5 | 1524 | $1,295 | $0.85 | 15d | 1 | 1.06mi |
| 1018 S Bend Ave South Bend, IN | 2.0 | 1.0–2.0 | 836 | $2,950 | $3.53 | 15d | 27 | 1.19mi |
| 1145 N Eddy St South Bend, IN | 3.0 | 1.0–3.0 | 959 | $3,387 | $3.53 | 45d | 1 | 1.21mi |
| 1008 O Brien St Unit O South Bend, IN | 3.0 | 1.0 | 1634 | $800 | $0.49 | 22d | 1 | 1.22mi |
| 1206 Johnson St South Bend, IN | 3.0 | 1.5 | 1320 | $1,400 | $1.06 | 45d | 1 | 1.25mi |
| 1210 Johnson St South Bend, IN | 3.0 | 2.0 | 1568 | $1,250 | $0.80 | 22d | 1 | 1.26mi |
| 2203 Smith St South Bend, IN | 3.0 | 1.0 | 1248 | $1,215 | $0.97 | 15d | 1 | 1.28mi |
| 1642 Johnson St South Bend, IN | 3.0 | 1.0 | 1375 | $1,400 | $1.02 | 15d | 1 | 1.48mi |
Listing history 27 events
-
2026-06-16days on market $145,000 Active 78 DOM
-
2026-06-15days on market $145,000 Active 77 DOM
-
2026-06-14days on market $145,000 Active 75 DOM
-
2026-06-13days on market $145,000 Active 74 DOM
-
2026-06-10days on market $145,000 Active 72 DOM
-
2026-06-09days on market $145,000 Active 71 DOM
-
2026-06-08days on market $145,000 Active 70 DOM
-
2026-06-07days on market $145,000 Active 69 DOM
-
2026-06-03days on market $145,000 Active 65 DOM
-
2026-06-02days on market $145,000 Active 64 DOM
-
2026-06-01days on market $145,000 Active 63 DOM
-
2026-05-31days on market $145,000 Active 62 DOM
-
2026-05-30days on market $145,000 Active 61 DOM
-
2026-03-30$145,000 Active 279-char remark
Show marketing remark (279 chars)
Great income producing property! 2 miles from Notre Dame and in the NNN neighborhood. The house features beautiful traditional hardwood and trim, main floor master suite, large main floor laundry room, fenced in back yard, a full bath on each floor. Can be sold with 504 Navarre.
-
2024-08-28historical $1,250
-
2024-08-14$1,250
-
2024-08-12historical $1,350
-
2024-07-02$1,350
-
2023-05-24historical
-
2023-01-13soldstatus $99,000 Closed 587-char remark
Show marketing remark (587 chars)
Rare find for this price! This home features 3 bedrooms and 2 FULL baths!! Lots of original details like hardwood floors, wood trim and charming built-ins. Light filled front porch welcomes you in. Main floor bedroom with attached bathroom is an added bonus for a home of this age. New flooring in this spacious kitchen with large windows that overlook the backyard. . Talk about a rare find-this home boasts a main floor mudroom with laundry also with new flooring! You can move right in to this home but it lends itself to opportunity to enhance the charm and original characteristics.
-
2022-12-14historical Active Under Contract 587-char remark
Show marketing remark (587 chars)
Rare find for this price! This home features 3 bedrooms and 2 FULL baths!! Lots of original details like hardwood floors, wood trim and charming built-ins. Light filled front porch welcomes you in. Main floor bedroom with attached bathroom is an added bonus for a home of this age. New flooring in this spacious kitchen with large windows that overlook the backyard. . Talk about a rare find-this home boasts a main floor mudroom with laundry also with new flooring! You can move right in to this home but it lends itself to opportunity to enhance the charm and original characteristics.
-
2022-12-12price $105,000 587-char remark
Show marketing remark (587 chars)
Rare find for this price! This home features 3 bedrooms and 2 FULL baths!! Lots of original details like hardwood floors, wood trim and charming built-ins. Light filled front porch welcomes you in. Main floor bedroom with attached bathroom is an added bonus for a home of this age. New flooring in this spacious kitchen with large windows that overlook the backyard. . Talk about a rare find-this home boasts a main floor mudroom with laundry also with new flooring! You can move right in to this home but it lends itself to opportunity to enhance the charm and original characteristics.
-
2022-11-15status Active 587-char remark
Show marketing remark (587 chars)
Rare find for this price! This home features 3 bedrooms and 2 FULL baths!! Lots of original details like hardwood floors, wood trim and charming built-ins. Light filled front porch welcomes you in. Main floor bedroom with attached bathroom is an added bonus for a home of this age. New flooring in this spacious kitchen with large windows that overlook the backyard. . Talk about a rare find-this home boasts a main floor mudroom with laundry also with new flooring! You can move right in to this home but it lends itself to opportunity to enhance the charm and original characteristics.
-
2022-11-04status Pending 587-char remark
Show marketing remark (587 chars)
Rare find for this price! This home features 3 bedrooms and 2 FULL baths!! Lots of original details like hardwood floors, wood trim and charming built-ins. Light filled front porch welcomes you in. Main floor bedroom with attached bathroom is an added bonus for a home of this age. New flooring in this spacious kitchen with large windows that overlook the backyard. . Talk about a rare find-this home boasts a main floor mudroom with laundry also with new flooring! You can move right in to this home but it lends itself to opportunity to enhance the charm and original characteristics.
-
2022-11-01$115,000 Active 587-char remark
Show marketing remark (587 chars)
Rare find for this price! This home features 3 bedrooms and 2 FULL baths!! Lots of original details like hardwood floors, wood trim and charming built-ins. Light filled front porch welcomes you in. Main floor bedroom with attached bathroom is an added bonus for a home of this age. New flooring in this spacious kitchen with large windows that overlook the backyard. . Talk about a rare find-this home boasts a main floor mudroom with laundry also with new flooring! You can move right in to this home but it lends itself to opportunity to enhance the charm and original characteristics.
-
2018-05-18soldstatus $73,000
-
2018-03-26$75,000
ⓘ Source: listings_history table (triggers on properties + properties_extension) + one-shot
backfill from property_details.listing_events for pre-trigger history.
Tax reassessment forecast IN · Partial reset (capped growth)
- Current annual tax
- $1,288 · $107/mo
- Projected year-2 tax
- $1,288 · $107/mo
- Expected delta
- $0/yr ($0/mo · 0.0%)
ⓘ Screening estimate from a state-policy table — verify with the county assessor before closing.
Climate risk First Street
- Flood 1/10 Low FEMA zone X (unshaded) · 0% chance over 30 yrs
- Wildfire 1/10 Low
- Heat 2/10 Low 7 d/yr ≥99°F today · 16 d/yr by 30 yrs out
- Wind 2/10 Low
- Air quality 3/10 Moderate 3 unhealthy d/yr today · 3 by 30 yrs out
Nearby sold comps map
Loading sold comps map…
Walkable amenities ~0.75 mi
Loading nearby amenities…
Taxation est. · year 1
- Rental income
- $15,612
- − Mortgage interest
- −$8,122
- − Property taxes
- −$1,288
- − Insurance
- −$725
- − Repairs & maintenance
- −$1,249
- − Management
- −$1,249
- − Depreciation
- −$4,218
- Taxable loss
- −$1,240
- Est. tax savings @ 24.0%
- +$297
- After-tax cash flow
- $1,493/yr
For passive investors: Depreciation is non-cash, so a rental often shows a tax loss while cash-flowing — sheltering income. Rental losses are passive: they offset passive income freely, and up to $25,000/yr can offset ordinary (W-2) income if you actively participate and your MAGI is under $100k (phasing out to $0 by $150k); unused losses carry forward. On sale, claimed depreciation is recaptured at up to 25%, and gains may owe capital-gains tax (a 1031 exchange can defer both). Figures are a year-1 estimate at your 24.0% rate — not tax advice; consult a CPA.
Schools (NCES district)
- District
- South Bend Community School Corporation
- NCES district ID
- 1810290
- Math proficiency
- 12% ▼ -10.00%
- Reading proficiency
- 21% ▼ -6.00%
- Median HH income
- $41,935
- Composite
- 14.21/100
- National rank
- #9452
- State rank
- #284 of 301 in IN
Livability — South Bend
- Score
- 64/100
- State rank
- #365
- US rank
- #13730
Category grades
Schools grade is shown separately in the Schools card above.
Census & demographics
- Census place
- South Bend, IN
- County
- Saint Joseph County · 189,048 people
- City population
- 99,767
- Metro
- South Bend-Mishawaka, IN-MI
- Population (ZIP)
- 5,979
- Household income
- $58,537
- Rent vs Own
- Severe rent burden
- 339.0
Population outlook (St. Joseph County) Hauer SSP2
- Today (2025)
- 273,186 people
- By 2030
- 273,594 · +0.1%
- By 2040
- 271,641 · -0.6%
- By 2050
- 269,187 · -1.5%
- By 2075
- 263,136 · -3.7%
- By 2100
- 245,659 · -10.1%
Race, ethnicity, and origin ACS 2023
- Neighborhood character
- Diverse neighborhood (Simpson 0.59)
- Race & ethnicity
- White 59% Black 21% Hispanic / Latino 16% Two or more races 14% Asian 1%
- Hispanic origin (detail)
- Mexican 9% Puerto Rican 2%
- Common ancestry
- Romanian 7% Portuguese 2% Slovak 2%
- Foreign-born
- 5% · Canada, China
- Languages at home
- 90% English-only · Spanish 7% Other Indo-European 1%
Political lean MEDSL · St. Joseph
- 2024 margin
- Toss-up / Even · D 50.0% · R 48.5% · Other 1.5%
- 2008→2024 swing
- -15.6pp toward R · 2008: 17.1pp · 2024: 1.5pp
- All cycles
- 2024: D+1.5 2020: D+5.8 2016: D+0.2 2012: D+3.5 2008: D+17.1
Not yet ingested
- Civics
- —
Market trends
- HPI YoY
- ▼ -51.53%
- Current HPI
- 237.0154
- Rent YoY
- ▲ 6.49%
- Metro
- South Bend-Mishawaka, IN-MI
- State GDP YoY
- ▲ 2.90%
- F500 in state
- 18
Industry mix (Fortune 500 HQ in IN)
| Industry | F500 HQs | Revenue |
|---|---|---|
| Industrial Machinery | 2 | $37B |
|
||
| Healthcare | 1 | $177B |
|
||
| Pharmaceuticals | 1 | $45B |
|
||
| Metals / Steel | 1 | $18B |
|
||
| Agriculture | 1 | $17B |
|
||
| Packaging | 1 | $12B |
|
||
Price history
+93.3% since first listed14 events — show timeline
- 2026-03-30 Listed $145,000 IRMLS
- 2024-08-28 Rental Removed $1,250 BUILDIUM
- 2024-08-14 Listed for Rent $1,250 BUILDIUM
- 2024-08-12 Rental Removed $1,350 RENTEC
- 2024-07-02 Listed for Rent $1,350 RENTEC
- 2023-05-24 Rental Removed — RENTEC
- 2023-01-13 Sold (MLS) $99,000 IRMLS
- 2022-12-14 Contingent — IRMLS
- 2022-12-12 Price Changed $105,000 IRMLS
- 2022-11-15 Relisted — IRMLS
- 2022-11-04 Pending — IRMLS
- 2022-11-01 Listed $115,000 IRMLS
- 2018-05-18 Sold (MLS) $73,000 IRMLS
- 2018-03-26 Listed $75,000 IRMLS
Property tax history
+7.4%/yrLatest (2023): $1,288 · +23.3% YoY. Source: county tax records.
Cash-flow waterfall
monthlySold comps — $/sqft
last 12 mo · ≤1 miLoading sold comps…