4865 Waggoners Gap Rd · Landisburg, PA
Flood risk 1/10 · Minimal
- FEMA flood zone
- X (unshaded)
- Chance of flooding over 30 yrs
- 0.0%
- Est. flood insurance / yr
- $507 – $1,088
Fire risk 4/10 · Minor
- Est. fire insurance / yr
- $511 – $949
Heat risk 4/10 · Minor
- Hot days now (above 98°F)
- 7 days/yr
- Hot days in 30 yrs
- 15 days/yr
Wind risk 2/10 · Minimal
- Chance of severe wind over 30 yrs
- 3.0%
Air-quality risk 2/10 · Minimal
- Unhealthy air days now
- 1 days/yr
- Unhealthy air days in 30 yrs
- 1 days/yr
Risk factors via First Street. Map © Google.
Why this score? — see what drove the D+ grade
The composite is a weighted blend of 9 inputs, each scored 0–100. Each bar is that input's sub-score; the figure is the points it added to the 100-point composite (weight × sub-score).
- ARV discount +15.0/15.0
- Cash flow +7.8/30.0
- Appreciation +6.0/10.0
- Schools +4.2/10.0
- Livability +3.2/5.0
- Rent growth +2.5/5.0
- Condition / age +2.5/5.0
- 1% rule +2.1/10.0
- DSCR +1.9/10.0
$195,000
🖨 Deal sheet (PDF) 📄 Offer letter ✓ Due diligence
Listing remarks
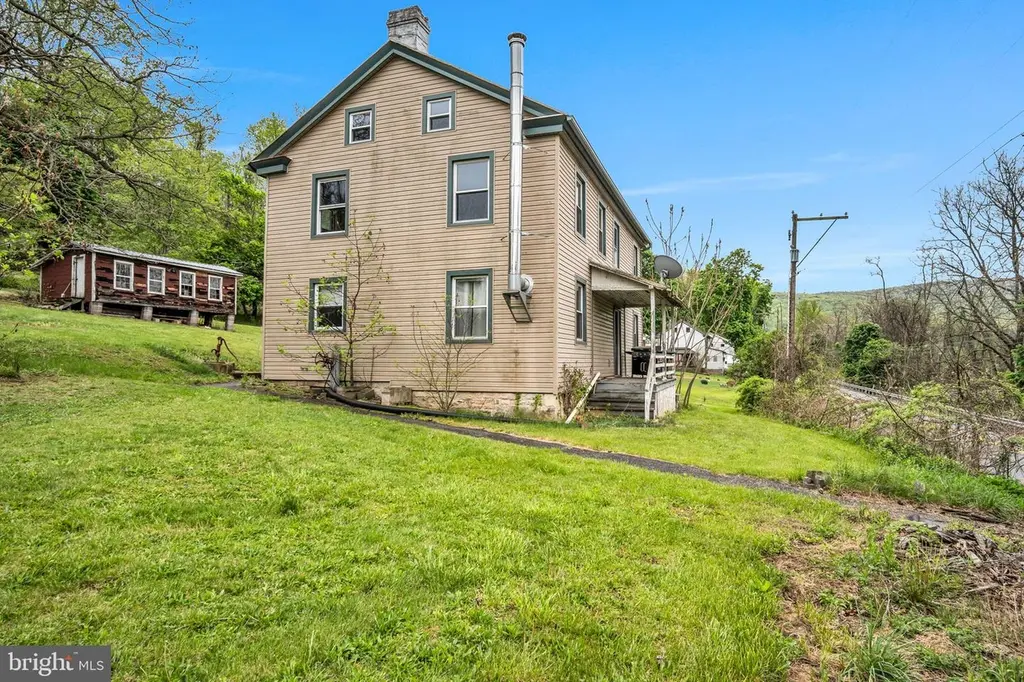
Build equity and make this home your own. Situated on Waggoners Gap, this 3 bed, 2 bath home features a beautiful 2.5 acre lot and offers you a chance to get into a spacious home on some land for under 200,000! The kitchen features wooden countertops and an island, beautifully remodeled plank ceiling with recessed lighting and a cooking hearth that adds so much charm. Restore the log walls in the stairwell and bring this home back to it's former glory. The floorplan flows well for hosting and gathering with friends and family. Upstairs there are 3 spacious bedrooms and an extra room that could function as living space, craft room or an office. Located minutes from Hawk Watch for senic views
Key facts
- 2.5 acre lot
- Log walls
- Recessed lighting
Tags
Property features AI
Exterior
- Parking: Driveway
- Utilities: Well water; On-site septic; Electric hot water
- Home design: Detached structure; Not in a federal flood zone; Estimated year built
- Construction: Vinyl siding; Metal roof; Stone foundation; Above-grade and below-grade structures
- Exterior features: Porch(es) and patio(s)
Interior
- Bedrooms: Three bedrooms on the main level
- Flooring: Ceramic tile; Hardwood
- Bathrooms: Two full bathrooms on the main level; Two full bathrooms total
- Heating & cooling: Heat pump(s) heating; Central air conditioning (electric)
- Interior features: Ceramic tile and hardwood floors; Unfinished poured concrete basement
Neighborhood map
What this means for you Summary
Snapshot
- This is a 3-bed/2.0-bath single-family listed at $195k.
Deal economics
- At list price, monthly cash flow is $-219 ($-3k/yr) — negative.
- To cash-flow at today's rent, offer at most $156k (19.8% below list).
- To meet the 1% rule (rent ≥ 1% of price), the offer needs to be $138k (29.3% below list).
- Recommended offer: $138k (29.3% below list) — sets the bar for 1% rule.
Location & tenants
- Location reads 64/100 on livability (#1,210 in PA) — a middle-class / working-renter tenant base. Strengths: cost of living A+, housing A+; Watch: crime C-, amenities F, commute F.
- West Perry SD (rural): math 37% / reading 60% proficiency, ranked #189 of 539 in PA (top 35%) — families likely to look elsewhere, expect single-tenant / working-renter base with shorter leases.
- Zoned schools: New Bloomfield El Sch (math 37% / reading 52%, grade F, #815 of 1,518 statewide, top 56%, 379 students, 52% FRL); West Perry Ms (math 23% / reading 61%, grade D-, #221 of 512 statewide, top 45%, 496 students, 52% FRL); West Perry Shs (math 72% / reading 87%, grade A-, #19 of 437 statewide, top 4%, 686 students, 38% FRL) — zoned schools average 47% FRL vs 32% district-wide (15 pts higher); higher-poverty schools than district average — tighter screening recommended.
- Market conditions: 15 active listings in the ZIP; 107 units permitted in Perry County in 2024 (0 in 5+ unit buildings).
Forward outlook
- In year one you build about $5k of equity ($1k loan paydown + $4k appreciation (2.0% local appreciation)).
- Perry County population projected at -19% by 2050 — secular population decline; favor cash flow + early exit over multi-decade hold.
- By year 7, paydown + projected appreciation supports a ~$33k cash-out refi (75% LTV) — recoverable capital for the next deal without selling this one.
Negotiation context
- Only 7 days on market — expect competitive offers; lowballing is unlikely to land.
Risks & watch-outs
- Watch-outs: built in 1900 — expect roof / HVAC / electrical / plumbing capex.
Questions for the listing agent
- What do current leases actually rent for vs. the listed asking? Can we see a recent rent roll and the last 12 months of T-12 income?
- Built in 1900 — when were the roof, HVAC, electrical panel, plumbing, and water heater last replaced?
- Is there a deadline driving the sale (1031 exchange, divorce, estate, relocation)? That informs how much negotiation room exists.
- Schools are F-rated, which usually means shorter tenancies and higher turnover. Who's the typical renter profile here, and what's been the actual vacancy rate?
- The area grade is low — what's the realistic commute time and amenity access for the typical tenant pool here? Any planned neighborhood developments (good or bad) we should know about?
- What's the average days-on-market for RENTAL listings here right now (not sales)? A rising rental-DOM trend means longer vacancies and softer asking-rent achievability than the comps imply.
- What's the recent tenant-quality profile in this submarket — average credit score on applications, eviction rate, late-payment / NSF rate, and stable-employment percentage? A property-management company in the area should have these aggregated.
- How much new for-sale + rental construction is in the pipeline within 1–3 miles? Heavy new supply typically softens prices + rents 12–24 months out; constrained supply supports both.
Investment metrics
- 1% rule
- 0.71% ✗
- Cap rate
- 4.95%
- Cash-on-cash
- -4.80%
- DSCR
- 0.79
- GRM
- 11.8
CMA / ARV
- ARV (median comp)
- $280,694
- List price
- $195,000
- Delta
- -30.53%
- Verdict
- UNDERPRICED
- Comps
- 9 within 1.0 mi
Show comp detail 1 sale within ~0.75 mi
| Address | Dist | Beds/Ba | Sqft | Sold | Price | $/sf | Match |
|---|---|---|---|---|---|---|---|
| 4865 Waggoners Gap Rd | 0.00mi | 3/2.0 | 2,080 (0%) | 0mo | $195,000 | $94 | 100 |
Match score weights: distance 35% · size 25% · config 20% · recency 20%. Top-matched comps best support the ARV.
Projected returns pro-forma
1.97% appreciation · 3.0% rent growth · sell at horizon
- IRR
- -0.3%
- Equity multiple
- 0.98×
- Total profit
- $-832
- Equity at exit
- $76,616
- IRR
- 4.0%
- Equity multiple
- 1.55×
- Total profit
- $30,071
- Equity at exit
- $110,101
Cash invested: $54,600 (down + closing). Projections, not guarantees.
Landlord ↔ Tenant lean methodology
- Overall (STATE)
- 62 Landlord-Friendly
- State Pennsylvania
- 62 Landlord-Friendly · EVEN
- County
- — inherits STATE
- City
- — inherits STATE
ZIP-level market 17040
- Home prices YoY
- 1.2%
- Active inventory
- 15
- Price-to-rent
- 11.8×
Monthly cashflow live
- Estimated rent
- $1,379 medium interval (Pro) →
- Mortgage (P&I)
- −$1,023
- Tax from tax record
- −$204 /mo · $2,451/yr
- Insurance
- −$81
- HOA
- −$0
- Vacancy / Maint / Mgmt
- −$290
- Net cashflow
- $-219
Break-even live
Sensitivity live
| Price | -10% $-108 | -5% $-163 | +0% $-219 | +5% $-274 | +10% $-329 |
|---|---|---|---|---|---|
| Rent | -10% $-327 | -5% $-273 | +0% $-219 | +5% $-164 | +10% $-110 |
| Rate | -1.0pp $-120 | -0.5pp $-169 | base $-219 | +0.5pp $-269 | +1.0pp $-320 |
UW: 25.0% down · 7.5% · 30yr · 1.5% tax · 5.0% vac · 8.0% maint · 8.0% mgmt
Financing live
Cash to close
- Down payment
- $48,750
- Closing costs
- $5,850
- Reserves months
- —
- Total cash needed
- —
Loan-product check · same deal, 3 products live
Conventional
25% down · 7.5% · 30yr
- Down + closing
- —
- Monthly P&I
- —
- Monthly cashflow
- —
- DSCR
- —
- Eligible?
- —
Personal DTI + credit; lowest rate.
DSCR
20% down · 8.5% · 30yr
- Down + closing
- —
- Monthly P&I
- —
- Monthly cashflow
- —
- DSCR
- —
- Eligible?
- —
No personal income docs; deal must DSCR.
Hard money
10% down · 12.0% · 12mo
- Down + closing
- —
- Monthly P&I
- —
- Monthly cashflow
- —
- DSCR
- —
- Eligible?
- —
Short-term bridge; refi at stabilization.
Listing history 2 events
-
2026-05-06status Pending 1005-char remark
-
2026-04-29$195,000 Active 1005-char remark
ⓘ Source: listings_history table (triggers on properties + properties_extension) + one-shot
backfill from property_details.listing_events for pre-trigger history.
Tax reassessment forecast PA · Partial reset (capped growth)
- Current annual tax
- $2,451 · $204/mo
- Projected year-2 tax
- $2,766 · $231/mo
- Expected delta
- +$315/yr (+$26/mo · 12.8%)
ⓘ Screening estimate from a state-policy table — verify with the county assessor before closing.
Climate risk First Street
- Flood 1/10 Low FEMA zone X (unshaded) · 0% chance over 30 yrs
- Wildfire 4/10 Moderate
- Heat 4/10 Moderate 7 d/yr ≥98°F today · 15 d/yr by 30 yrs out
- Wind 2/10 Low 3% chance of damaging wind over 30 yrs
- Air quality 2/10 Low 1 unhealthy d/yr today · 1 by 30 yrs out
Nearby sold comps map
Loading sold comps map…
Walkable amenities ~0.75 mi
Loading nearby amenities…
Taxation est. · year 1
- Rental income
- $16,551
- − Mortgage interest
- −$10,923
- − Property taxes
- −$2,451
- − Insurance
- −$975
- − Repairs & maintenance
- −$1,324
- − Management
- −$1,324
- − Depreciation
- −$5,673
- Taxable loss
- −$6,119
- Est. tax savings @ 24.0%
- +$1,469
- After-tax cash flow
- $-1,154/yr
For passive investors: Depreciation is non-cash, so a rental often shows a tax loss while cash-flowing — sheltering income. Rental losses are passive: they offset passive income freely, and up to $25,000/yr can offset ordinary (W-2) income if you actively participate and your MAGI is under $100k (phasing out to $0 by $150k); unused losses carry forward. On sale, claimed depreciation is recaptured at up to 25%, and gains may owe capital-gains tax (a 1031 exchange can defer both). Figures are a year-1 estimate at your 24.0% rate — not tax advice; consult a CPA.
Schools (NCES district)
- District
- West Perry SD
- NCES district ID
- 4225740
- Math proficiency
- 37% ▼ -6.00%
- Reading proficiency
- 60% ▼ -1.00%
- Median HH income
- $55,647
- Composite
- 41.99/100
- National rank
- #3338
- State rank
- #189 of 539 in PA
Livability — Landisburg
- Score
- 64/100
- State rank
- #1210
- US rank
- #14270
Category grades
Schools grade is shown separately in the Schools card above.
Census & demographics
- Population (ZIP)
- 2,494
Population outlook (Perry County) Hauer SSP2
- Today (2025)
- 44,250 people
- By 2030
- 42,862 · -3.1%
- By 2040
- 39,574 · -10.6%
- By 2050
- 36,001 · -18.6%
- By 2075
- 27,991 · -36.7%
- By 2100
- 20,936 · -52.7%
Race, ethnicity, and origin ACS 2023
- Neighborhood character
- Predominantly White (95%)
- Race & ethnicity
- White 95% Two or more races 4% Hispanic / Latino 1%
- Common ancestry
- Subsaharan African 2% Iranian 1% Serbian 1%
- Foreign-born
- 2%
- Languages at home
- 91% English-only · German/W. Germanic 7% Russian/Polish/Slavic 1%
Political lean MEDSL · Perry
- 2024 margin
- Solid R (+49.3) · D 24.8% · R 74.1% · Other 1.0%
- 2008→2024 swing
- -15.6pp toward R · 2008: -33.7pp · 2024: -49.3pp
- All cycles
- 2024: R+49.3 2020: R+50.1 2016: R+51.9 2012: R+38.8 2008: R+33.7
Not yet ingested
- Civics
- —
Market trends
- HPI YoY
- ▲ 1.97%
- Current HPI
- 160.2781
- Rent YoY
- —
- Metro
- —
- State GDP YoY
- ▲ 1.68%
- F500 in state
- 34
Industry mix (Fortune 500 HQ in PA)
| Industry | F500 HQs | Revenue |
|---|---|---|
| Healthcare | 2 | $309B |
|
||
| Insurance | 2 | $27B |
|
||
| Telecommunications / Media | 1 | $124B |
|
||
| Industrial Distribution | 1 | $22B |
|
||
| Financial Services | 1 | $20B |
|
||
| Chemicals / Materials | 1 | $18B |
|
||
Price history
+0.0% since first listed4 events — show timeline
- 2026-06-09 Sold (Public Records) $195,000 Public Records
- 2026-06-09 Sold (MLS) $195,000 BRIGHT MLS
- 2026-05-06 Pending — BRIGHT MLS
- 2026-04-29 Listed $195,000 BRIGHT MLS
Property tax history
+2.4%/yrLatest (2026): $2,451 · -8.8% YoY. Source: county tax records.
Cash-flow waterfall
monthlySold comps — $/sqft
last 12 mo · ≤1 miLoading sold comps…