 Multi-family
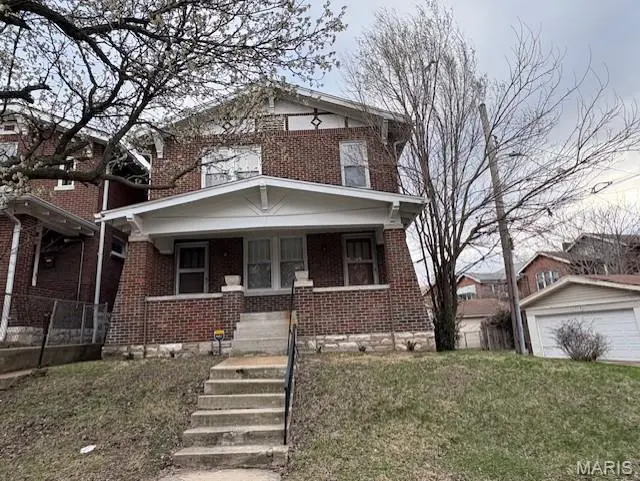
3456 Gasconade · St. Louis, MO
Flood risk 1/10 · Minimal
- FEMA flood zone
- X (unshaded)
- Chance of flooding over 30 yrs
- 0.0%
- Est. flood insurance / yr
- $473 – $860
Fire risk 1/10 · Minimal
- Est. fire insurance / yr
- $1,054 – $1,958
Heat risk 5/10 · Moderate
- Hot days now (above 108°F)
- 7 days/yr
- Hot days in 30 yrs
- 21 days/yr
Wind risk 2/10 · Minimal
- Chance of severe wind over 30 yrs
- 1.0%
Air-quality risk 3/10 · Minor
- Unhealthy air days now
- 3 days/yr
- Unhealthy air days in 30 yrs
- 4 days/yr
Risk factors via First Street. Map © Google.
Why this score? — see what drove the B- grade
The composite is a weighted blend of 9 inputs, each scored 0–100. Each bar is that input's sub-score; the figure is the points it added to the 100-point composite (weight × sub-score).
- Cash flow +27.7/30.0
- ARV discount +15.0/15.0
- DSCR +9.7/10.0
- 1% rule +7.6/10.0
- Rent growth +3.7/5.0
- Livability +2.5/5.0
- Condition / age +2.2/5.0
- Schools +1.2/10.0
- Appreciation +0.0/10.0
$168,500
🖨 Deal sheet 📄 Offer letter ✓ Due diligence
Multi-family units
County records classify this as Multi-Family (2-4 Unit). Listing-text estimate: 1 unit. estimate disagrees with records
Listing remarks MLS
Investor Delight on BEAUTIFUL TREE-LINED BLOCK --- HUGH VALUE ADD OPPORTUNITY! This charmimg property features a spacious covered front porch and showcases stunning wood flooring and original trim that highlight its timeless character.The building offers two bedrooms per unit.Updated electrical service, and several newer windows for added efficiency.A TWO CAR OVERSIZED GARAGE.This property a hugh value add opportunity, making it a deal for investors seeking stong upside potential or buyer looking to customize thier residence while generating income. Conveniently located near parks, restaurants, highways and all neighborhood amenities.
Key facts
- Covered front porch
- Wood flooring
- Original trim
Tags
Neighborhood map
What this means for you Summary
Snapshot
- This is a 4-bed/2.0-bath multifamily listed at $168k. Condition is rated fair.
Deal economics
- At list price, monthly cash flow is $507 ($6k/yr) — positive.
- The deal already cash-flows at list — no discount required.
- Meets the 1% rule at list price ($2k rent vs $168k).
- Recommended offer: $153k (9.0% below list) — sets the bar for market timing.
- Cap rate 9.9% vs local median 5.0% in St. Louis — top-decile yield for the area; either an underpriced asset or a hidden risk that comps aren't pricing in. Stress-test before assuming the spread holds.
Location & tenants
- Location reads: area grade B — affects rentability + tenant quality, not the cash-flow math above.
- St. Louis City (urban): math 10% / reading 18% proficiency, ranked #312 of 324 in MO (top 96%) — low school quality limits family demand, transient renter base, plan for 1-2y turnover; 80% free/reduced lunch — lower-income household profile, screen leases tightly.
- Market conditions: Rents rising fast (+4.9%/yr); 240 active listings in the ZIP; 34 comparable units currently listed for rent nearby; rentals at typical pace (median 24d on market — plan ~3-4 weeks tenant-placement turnaround); 41% of comp listings sitting > 30 days — soft ceiling on asking rent; 294 units permitted in St. Louis city in 2024 (227 in 5+ unit buildings).
- This rent runs 44% of the median local income ($58k/yr) — at the standard rent-burdened threshold; future hikes will face affordability resistance.
Forward outlook
- Local home prices are declining (-3.0%/yr); year-one equity from $1k of loan paydown is wiped out by about $5k of value loss. Plan a longer hold.
- St. Louis County population projected to shrink 6% by 2050 — rents likely to lag national; underwrite the cash flow, not the appreciation.
- At projected returns (-3.0% appreciation + 4.9% rent growth), your $47k cash investment doubles in ~8 years — after that, you're playing with house money.
Negotiation context
- It's been on market 91 days — a 9% lower offer ($153k) is reasonable based on typical stale-listing flexibility.
- 4 sale attempts; this cycle's ask has dropped $16k (9%) from the opening price — seller is motivated, your offer sets the floor, not the list.
Risks & watch-outs
- Watch-outs: built in 1923 — expect roof / HVAC / electrical / plumbing capex.
- Climate carrying-cost: extreme-heat days projected 7→21/yr by 2055 (HVAC capex compounding) — expect insurance premiums to compound above CPI over the hold.
Questions for the listing agent
- It's been on market 91 days. Have you received any prior offers? Is the seller open to a 9% concession, seller financing, or rate buy-down credit?
- Have any recent inspections been done? Can we get a copy of the seller's disclosures and any deferred-maintenance estimates?
- Built in 1923 — when were the roof, HVAC, electrical panel, plumbing, and water heater last replaced?
- Why hasn't it sold? Are there any deal-killer items the seller is aware of (foundation, flood, title, zoning, code violations)?
- Is there a deadline driving the sale (1031 exchange, divorce, estate, relocation)? That informs how much negotiation room exists.
- What's the average days-on-market for RENTAL listings here right now (not sales)? A rising rental-DOM trend means longer vacancies and softer asking-rent achievability than the comps imply.
- What's the recent tenant-quality profile in this submarket — average credit score on applications, eviction rate, late-payment / NSF rate, and stable-employment percentage? A property-management company in the area should have these aggregated.
- How much new apartment / multifamily construction is in the pipeline within 1–3 miles? Heavy new supply (>2% of stock underway) typically softens rents 12–24 months out; light construction supports rent growth.
Investment metrics
- 1% rule
- 1.26% ✓
- Cap rate
- 9.90%
- Cash-on-cash
- 12.90%
- DSCR
- 1.57
- GRM
- 6.6
CMA / ARV
- ARV (median comp)
- $206,178
- List price
- $168,500
- Delta
- -18.27%
- Verdict
- UNDERPRICED
- Comps
- 20 within 1.0 mi
Show comp detail 12 sales within ~0.75 mi
| Address | Dist | Beds/Ba | Sqft | Sold | Price | $/sf | Match |
|---|---|---|---|---|---|---|---|
| 3435 Alberta St | 0.22mi | 4/4.0 | 3,850 | 5mo | $160,000 | $42 | 65 |
| 3829 Minnesota Ave | 0.48mi | 4/2.0 | 2,798 | 2mo | $65,000 | $23 | 63 |
| 3106 Chippewa St | 0.51mi | 4/2.0 | 2,490 | 2mo | $109,900 | $44 | 62 |
| 3643 Winnebago St | 0.56mi | 4/2.0 | 2,250 | 3mo | $120,000 | $53 | 59 |
| 3651 Winnebago St | 0.57mi | 4/2.0 | 2,250 | 4mo | $200,000 | $89 | 58 |
| 3919-3921 Dunnica Ave | 0.63mi | 4/2.0 | 2,554 | 3mo | $175,000 | $69 | 56 |
| 3610 Neosho St | 0.53mi | 4/4.0 | 3,384 | 3mo | $164,900 | $49 | 52 |
| 3720 Winnebago St | 0.57mi | 4/4.0 | 3,340 | 2mo | $280,000 | $84 | 51 |
| 4511 Minnesota Ave | 0.62mi | 4/4.0 | 2,788 | 3mo | $49,900 | $18 | 48 |
| 4656 Virginia Ave | 0.74mi | 5/2.0 (+1) | 3,014 | 1mo | $244,900 | $81 | 48 |
| 4552 Virginia Ave | 0.61mi | 4/4.0 | 3,740 | 4mo | $40,000 | $11 | 48 |
| 3733 Oregon Ave | 0.69mi | 4/4.0 | 2,480 | 4mo | $220,000 | $89 | 44 |
Match score weights: distance 35% · size 25% · config 20% · recency 20%. Top-matched comps best support the ARV.
Projected returns pro-forma
-3.0% appreciation · 4.89% rent growth · sell at horizon
- IRR
- 4.9%
- Equity multiple
- 1.19×
- Total profit
- $9,129
- Equity at exit
- $25,124
- IRR
- 16.0%
- Equity multiple
- 2.42×
- Total profit
- $67,159
- Equity at exit
- $14,569
Cash invested: $47,180 (down + closing). Projections, not guarantees.
Landlord ↔ Tenant lean methodology
- Overall (STATE)
- 81 Strongly Landlord-Friendly
- State Missouri
- 81 Strongly Landlord-Friendly · R+10
- County
- — inherits STATE
- City
- — inherits STATE
ZIP-level market 63118
- Rents YoY
- 4.9%
- Active inventory
- 240
- Price-to-rent
- 13.3×
Monthly cashflow live
- Estimated rent
- $2,116 high interval (Pro) →
- Mortgage (P&I)
- −$884
- Tax est. 1.5%
- −$211 /mo · $2,528/yr
- Insurance
- −$70
- HOA
- −$0
- Vacancy / Maint / Mgmt
- −$444
- Net cashflow
- $507
Break-even live
2-unit breakdown (identical units grouped — click to expand)
| Units | Beds | Baths | Est. rent |
|---|---|---|---|
| 2× units | 2 | 1 | $2,116 |
| #1 | 2 | 1 | $1,058 |
| #2 | 2 | 1 | $1,058 |
| Total (2 units) | $2,116 | ||
UW: 25.0% down · 7.5% · 30yr · 1.5% tax · 5.0% vac · 8.0% maint · 8.0% mgmt
Financing live
Cash to close
- Down payment
- $42,125
- Closing costs
- $5,055
- Reserves months
- —
- Total cash needed
- —
Loan-product check · same deal, 3 products live
Conventional
25% down · 7.5% · 30yr
- Down + closing
- —
- Monthly P&I
- —
- Monthly cashflow
- —
- DSCR
- —
- Eligible?
- —
Personal DTI + credit; lowest rate.
DSCR
20% down · 8.5% · 30yr
- Down + closing
- —
- Monthly P&I
- —
- Monthly cashflow
- —
- DSCR
- —
- Eligible?
- —
No personal income docs; deal must DSCR.
Hard money
10% down · 12.0% · 12mo
- Down + closing
- —
- Monthly P&I
- —
- Monthly cashflow
- —
- DSCR
- —
- Eligible?
- —
Short-term bridge; refi at stabilization.
Rent comps 34 comps
| Address | Beds | Baths | Sqft | Rent | $/sqft | DOM | Units | Dist |
|---|---|---|---|---|---|---|---|---|
| 3637 Meramec St Saint Louis, MO | 3.0 | 1.5 | 1632 | $1,925 | $1.18 | 17d | 1 | 0.12mi |
| 4005 S Grand Blvd Saint Louis, MO | 4.0 | 1.0 | 1323 | $1,150 | $0.87 | 16d | 1 | 0.12mi |
| 4217 S Grand Blvd Unit 1 St. Louis, MO | 3.0 | 1.0 | 1250 | $1,400 | $1.12 | 4d | 1 | 0.18mi |
| 4222 S 38th St Unit 4222 St. Louis, MO | 3.0 | 2.0 | 1836 | $1,400 | $0.76 | 20d | 1 | 0.24mi |
| 4135 S Compton Ave Saint Louis, MO | 3.0 | 2.0 | 2104 | $1,600 | $0.76 | 43d | 1 | 0.25mi |
| 4145 S Compton Ave Saint Louis, MO | 3.0 | 2.0 | 1656 | $1,520 | $0.92 | 43d | 1 | 0.26mi |
| 3146 Keokuk St Saint Louis, MO | 3.0 | 1.0 | 1528 | $1,500 | $0.98 | 23d | 1 | 0.36mi |
| 4416 S Grand Blvd Saint Louis, MO | 3.0 | 1.0 | 963 | $1,550 | $1.61 | 23d | 1 | 0.36mi |
| 4127 Minnesota Ave Unit 2F St. Louis, MO | 3.0 | 1.0 | 1155 | $1,200 | $1.04 | 43d | 1 | 0.37mi |
| 4127 Minnesota Ave Unit 1F St. Louis, MO | 3.0 | 1.0 | 1155 | $1,200 | $1.04 | 43d | 1 | 0.37mi |
| 3131 Keokuk St #3131 Saint Louis, MO | 3.0 | 2.0 | 1500 | $1,475 | $0.98 | 14d | 1 | 0.39mi |
| 4455 S 38th St Saint Louis, MO | 3.0 | 1.0 | 1000 | $1,000 | $1.00 | 23d | 1 | 0.47mi |
| 3635 Marceline Ter Unit 2ND St. Louis, MO | 3.0 | 1.0 | 1250 | $1,275 | $1.02 | 43d | 1 | 0.58mi |
| 4312 Oregon Ave Saint Louis, MO | 4.0 | 2.0 | 2032 | $2,000 | $0.98 | 1d | 1 | 0.65mi |
| 4450 Pennsylvania Ave Saint Louis, MO | 3.0 | 1.0 | 1500 | $1,100 | $0.73 | 4d | 1 | 0.67mi |
| 3649 Nebraska Ave Unit 2F St. Louis, MO | 4.0 | 1.0 | — | $1,500 | — | 23d | 1 | 0.71mi |
| 3540 Michigan Ave Saint Louis, MO | 4.0 | 2.0 | 1758 | $1,800 | $1.02 | 1d | 1 | 0.73mi |
| 3526 S Spring Ave Saint Louis, MO | 4.0 | 2.0 | 2244 | $2,877 | $1.28 | 43d | 1 | 0.74mi |
| 3956 Tholozan Ave Unit 1472873P St. Louis, MO | 3.0 | 1.0 | — | $4,366 | — | 7d | 1 | 0.79mi |
| 2649 Keokuk St Unit 2L St. Louis, MO | 3.0 | 1.0 | — | $1,295 | — | 43d | 1 | 0.80mi |
| 3458 Giles Ave Saint Louis, MO | 3.0 | 2.5 | 2204 | $2,400 | $1.09 | 7d | 1 | 0.81mi |
| 2641 Keokuk St Unit 1R St. Louis, MO | 3.0 | 1.0 | 800 | $1,295 | $1.62 | 43d | 1 | 0.82mi |
| 3807 Potomac St Saint Louis, MO | 3.0 | 1.0 | 2588 | $1,100 | $0.43 | 43d | 1 | 0.85mi |
| 3807 Potomac St Saint Louis, MO | 3.0 | 1.0 | 2588 | $1,300 | $0.50 | 7d | 1 | 0.85mi |
| 3411 Cherokee St St. Louis, MO | 4.0 | 2.0 | 1568 | $1,850 | $1.18 | 43d | 1 | 0.88mi |
| 3243 Delor St Unit 3243 St. Louis, MO | 3.0 | 1.0 | 1100 | $1,250 | $1.14 | 22d | 1 | 0.89mi |
| 3510 California Ave Saint Louis, MO | 3.0 | 2.0 | 1800 | $1,200 | $0.67 | 43d | 1 | 0.95mi |
| 3908 McDonald Ave Saint Louis, MO | 3.0 | 2.0 | 1927 | $2,500 | $1.30 | 4d | 1 | 1.02mi |
| 3429 Ohio Ave Saint Louis, MO | 3.0 | 3.0 | 1938 | $2,250 | $1.16 | 16d | 1 | 1.09mi |
| 3628 Wyoming St Unit 2F St. Louis, MO | 4.0 | 1.0 | 1700 | $1,950 | $1.15 | 43d | 1 | 1.11mi |
| 3179 S Grand Blvd Saint Louis, MO | 3.0 | 1.0 | 650 | $1,585 | $2.44 | 2d | 3 | 1.16mi |
| 2643 Wyoming St Saint Louis, MO | 3.0 | 2.5 | 2592 | $2,600 | $1.00 | 43d | 1 | 1.36mi |
| 3971 Juniata St Unit 1472872P St. Louis, MO | 4.0 | 1.5 | — | $6,107 | — | 43d | 1 | 1.38mi |
| 3450 Wisconsin Ave Saint Louis, MO | 1.0–3.0 | 1.0–2.0 | 1219 | $2,300 | $1.89 | 1d | 15 | 1.39mi |
Listing history 19 events
-
2026-06-18days on market $168,500 Active 91 DOM
-
2026-06-17days on market $168,500 Active 90 DOM
-
2026-06-16days on market $168,500 Active 89 DOM
-
2026-06-15days on market $168,500 Active 88 DOM
-
2026-06-13days on market $168,500 Active 86 DOM
-
2026-06-09days on market $168,500 Active 82 DOM
-
2026-06-08days on market $168,500 Active 81 DOM
-
2026-06-08days on market $168,500 Active 80 DOM
-
2026-06-05days on market $168,500 Active 77 DOM
-
2026-06-03days on market $168,500 Active 76 DOM
-
2026-06-02days on market $168,500 Active 75 DOM
-
2026-06-01days on market $168,500 Active 74 DOM
-
2026-05-31days on market $168,500 Active 73 DOM
-
2026-03-31price $168,500 642-char remark
Show marketing remark (642 chars)
Investor Delight on BEAUTIFUL TREE-LINED BLOCK --- HUGH VALUE ADD OPPORTUNITY! This charmimg property features a spacious covered front porch and showcases stunning wood flooring and original trim that highlight its timeless character.The building offers two bedrooms per unit.Updated electrical service, and several newer windows for added efficiency.A TWO CAR OVERSIZED GARAGE.This property a hugh value add opportunity, making it a deal for investors seeking stong upside potential or buyer looking to customize thier residence while generating income. Conveniently located near parks, restaurants, highways and all neighborhood amenities.
-
2026-03-19$184,500 Active 642-char remark
Show marketing remark (642 chars)
Investor Delight on BEAUTIFUL TREE-LINED BLOCK --- HUGH VALUE ADD OPPORTUNITY! This charmimg property features a spacious covered front porch and showcases stunning wood flooring and original trim that highlight its timeless character.The building offers two bedrooms per unit.Updated electrical service, and several newer windows for added efficiency.A TWO CAR OVERSIZED GARAGE.This property a hugh value add opportunity, making it a deal for investors seeking stong upside potential or buyer looking to customize thier residence while generating income. Conveniently located near parks, restaurants, highways and all neighborhood amenities.
-
2025-12-04status Active
-
2025-10-15status Pending
-
2025-10-15$195,000 Active
-
2025-07-02$168,500 Active
ⓘ Source: listings_history table (triggers on properties + properties_extension) + one-shot
backfill from property_details.listing_events for pre-trigger history.
Climate risk First Street
- Flood 1/10 Low FEMA zone X (unshaded) · 0% chance over 30 yrs
- Wildfire 1/10 Low
- Heat 5/10 Major 7 d/yr ≥108°F today · 21 d/yr by 30 yrs out
- Wind 2/10 Low 100% chance of damaging wind over 30 yrs
- Air quality 3/10 Moderate 3 unhealthy d/yr today · 4 by 30 yrs out
Nearby sold comps map
Loading sold comps map…
Walkable amenities ~0.75 mi
Loading nearby amenities…
Taxation est. · year 1
- Rental income
- $25,392
- − Mortgage interest
- −$9,439
- − Property taxes
- −$2,528
- − Insurance
- −$842
- − Repairs & maintenance
- −$2,031
- − Management
- −$2,031
- − Depreciation
- −$4,902
- Taxable income
- $3,619
- Est. tax owed @ 24.0%
- −$869
- After-tax cash flow
- $5,218/yr
For passive investors: Depreciation is non-cash, so a rental often shows a tax loss while cash-flowing — sheltering income. Rental losses are passive: they offset passive income freely, and up to $25,000/yr can offset ordinary (W-2) income if you actively participate and your MAGI is under $100k (phasing out to $0 by $150k); unused losses carry forward. On sale, claimed depreciation is recaptured at up to 25%, and gains may owe capital-gains tax (a 1031 exchange can defer both). Figures are a year-1 estimate at your 24.0% rate — not tax advice; consult a CPA.
Condition & rehab AI · 10 photos
This multi-family property offers a fair condition with potential for moderate renovations to enhance its curb appeal and value.
Repairs flagged
- Moderate exterior siding — Worn and uneven
- Minor interior walls — Some paint wear
Value-add opportunities
- Both paint exterior — Enhances curb appeal and resale value
- Both repair exterior siding — Improves home's appearance and value
- Both update kitchen and bathrooms — Modernizes the home and increases both resale and rental value
Renovation cost estimate screening
| Repair item | Severity | Est. cost |
|---|---|---|
| exterior siding · Worn and uneven | Moderate | $3,000–15,000 |
| interior walls · Some paint wear | Minor | $500–3,000 |
| Total estimated repair cost · 2 items | $3,500–18,000 |
Value-add ROI direction
- Both paint exterior — Enhances curb appeal and resale value ↑
- Both repair exterior siding — Improves home's appearance and value ↑
- Both update kitchen and bathrooms — Modernizes the home and increases both resale and rental value ↑
ⓘ Cost ranges are severity-bucket heuristics (US national rule-of-thumb). Get contractor quotes + a written scope before underwriting a rehab budget.
Schools (NCES district)
- District
- St. Louis City
- NCES district ID
- 2929280
- Math proficiency
- 10% ▼ -6.00%
- Reading proficiency
- 18% ▼ -3.00%
- Median HH income
- $35,685
- Composite
- 11.54/100
- National rank
- #9699
- State rank
- #312 of 324 in MO
Livability — St. Louis
No livability data for this city. (Only ~50 U.S. cities are tracked.)
Census & demographics
- Census place
- St. Louis, MO
- County
- Saint Louis City · 254,015 people
- City population
- 283,259
- Metro
- St. Louis, MO-IL
- Population (ZIP)
- 25,913
- Household income
- $57,762
- Rent vs Own
- Severe rent burden
- 1495.0
Population outlook (St. Louis County) Hauer SSP2
- Today (2025)
- 315,737 people
- By 2030
- 313,865 · -0.6%
- By 2040
- 305,439 · -3.3%
- By 2050
- 296,529 · -6.1%
- By 2075
- 271,028 · -14.2%
- By 2100
- 255,359 · -19.1%
Race, ethnicity, and origin ACS 2023
- Neighborhood character
- Diverse neighborhood (Simpson 0.63)
- Race & ethnicity
- White 44% Black 41% Two or more races 8% Hispanic / Latino 8% Asian 2%
- Hispanic origin (detail)
- Mexican 6%
- Common ancestry
- Slovak 2% Lithuanian 2% Romanian 2%
- Foreign-born
- 6% · Canada, Vietnam
- Languages at home
- 90% English-only · Spanish 5% Vietnamese 1% French/Haitian/Cajun 1%
Political lean MEDSL · St. Louis
- 2024 margin
- Solid D (+64.7) · D 81.4% · R 16.7% · Other 2.0%
- 2008→2024 swing
- -3.5pp toward R · 2008: 68.2pp · 2024: 64.7pp
- All cycles
- 2024: D+64.7 2020: D+66.2 2016: D+63.7 2012: D+66.6 2008: D+68.2
Not yet ingested
- Civics
- —
Market trends
- HPI YoY
- ▼ -347.51%
- Current HPI
- 171.5963
- Rent YoY
- ▲ 4.89%
- Metro
- St. Louis, MO-IL
- State GDP YoY
- ▲ 1.84%
- F500 in state
- 20
Industry mix (Fortune 500 HQ in MO)
| Industry | F500 HQs | Revenue |
|---|---|---|
| Healthcare | 1 | $163B |
|
||
| Insurance | 1 | $21B |
|
||
| Industrial Technology | 1 | $17B |
|
||
| Retail | 1 | $16B |
|
||
| Industrial Distribution | 1 | $10B |
|
||
| Utilities | 1 | $9B |
|
||
Price history
+0.0% since first listed6 events — show timeline
- 2026-03-31 Price Changed $168,500 MARIS as Distributed by MLS Grid
- 2026-03-19 Listed $184,500 MARIS as Distributed by MLS Grid
- 2025-12-04 Relisted — MARIS as Distributed by MLS Grid
- 2025-10-15 Pending — MARIS as Distributed by MLS Grid
- 2025-10-15 Listed $195,000 MARIS as Distributed by MLS Grid
- 2025-07-02 Listed $168,500 MARIS as Distributed by MLS Grid
Cash-flow waterfall
monthlySold comps — $/sqft
last 12 mo · ≤1 miLoading sold comps…