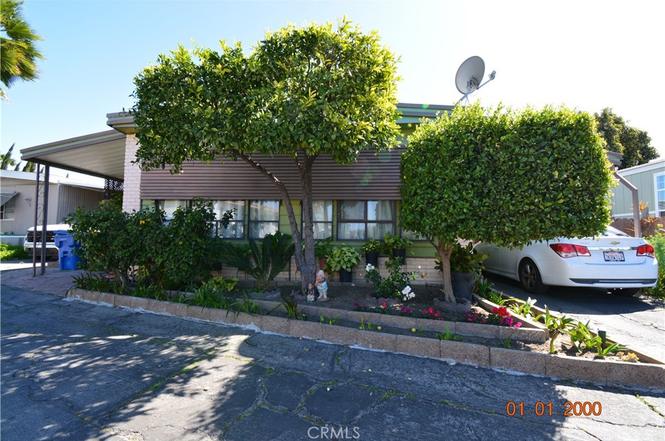
12700 Elliott Ave #406 · El Monte, CA
Flood risk 1/10 · Minimal
- FEMA flood zone
- X (unshaded)
- Chance of flooding over 30 yrs
- 0.0%
- Est. flood insurance / yr
- $507 – $1,088
Fire risk 2/10 · Minimal
- Est. fire insurance / yr
- $659 – $1,223
Heat risk 6/10 · Moderate
- Hot days now (above 100°F)
- 7 days/yr
- Hot days in 30 yrs
- 20 days/yr
Wind risk 1/10 · Minimal
- Chance of severe wind over 30 yrs
- —
Air-quality risk 6/10 · Moderate
- Unhealthy air days now
- 9 days/yr
- Unhealthy air days in 30 yrs
- 10 days/yr
Risk factors via First Street. Map © Google.
Why this score? — see what drove the B grade
The composite is a weighted blend of 9 inputs, each scored 0–100. Each bar is that input's sub-score; the figure is the points it added to the 100-point composite (weight × sub-score).
- Cash flow +30.0/30.0
- ARV discount +12.8/15.0
- 1% rule +10.0/10.0
- DSCR +10.0/10.0
- Livability +3.1/5.0
- Rent growth +2.5/5.0
- Condition / age +2.5/5.0
- Schools +2.1/10.0
- Appreciation +0.0/10.0
$154,900
🖨 Deal sheet 📄 Offer letter ✓ Due diligence
Listing remarks
This 3-bedroom 2-bathroom Mobile home is located in a desirable community in El Monte, this home features an open floor plan with a large living room, separate dining area, separate storage room, large backyard with fruit trees, Avocado tree, Pomegranate tree, Guava tree, Limes, Tangerines, and a Papaya tree. Located in a well-kept community with amenities, residents have access to a refreshing pool and barbecue grills, ideal for family gatherings and weekend fun, and a kid friendly playground, also pet friendly sitting park, conveniently situated near the 605, 60 and 10 freeway.
Key facts
- Open floor plan
- Large backyard
- Large living room
Tags
Property features AI
Finance
- Other: Living area and lot size sourced from assessor data; Parcel number on file
- HOA & community: Land lease ($2,304 monthly) — park-managed; manager approval required
Exterior
- Parking: Carport; Driveway
- Utilities: Public sewer; District/Public water
- Home design: Single-story property; Mobile home (12' x 57') remains on site; Double body type; Located in BROOKSIDE COUNTRY CLUB park
- Construction: Year built (per assessor)
- Exterior features: Community pool; Level lot with lawn and yard; Sidewalks; Dog park in community
Interior
- Bathrooms: 2 full bathrooms
- Interior features: One-level home; Left-side entry; Community spa
- Laundry & utility: Laundry in an individual room
Neighborhood map
What this means for you Summary
Snapshot
- This is a 3-bed/2.0-bath manufactured listed at $155k.
Deal economics
- At list price, monthly cash flow is $1k ($14k/yr) — positive.
- The deal already cash-flows at list — no discount required.
- Meets the 1% rule at list price ($3k rent vs $155k).
- Recommended offer: $150k (3.0% below list) — sets the bar for market timing.
- Cap rate 15.3% vs local median 2.4% in El Monte — top-decile yield for the area; either an underpriced asset or a hidden risk that comps aren't pricing in. Stress-test before assuming the spread holds.
Location & tenants
- Location reads 61/100 on livability (#554 in CA) — a middle-class / working-renter tenant base. Strengths: commute A+; Watch: schools D+, crime D, amenities F.
- Mountain View Elementary (suburban): math 25% / reading 25% proficiency, ranked #417 of 517 in CA (top 81%) — low school quality limits family demand, transient renter base, plan for 1-2y turnover; 80% free/reduced lunch — lower-income household profile, screen leases tightly.
- Market conditions: 84 active listings in the ZIP; 7 comparable units currently listed for rent nearby; rentals leasing fast (median 1d on market — plan ~1-2 weeks tenant-placement turnaround); solid renter incomes; 19,697 units permitted in Los Angeles County in 2024 (9,426 in 5+ unit buildings).
- At $2,834/mo this rent would consume 45% of the median local household income ($75k/yr) (locally 2538% of renters already pay >50% of income on rent) — very limited rent-growth headroom before tenants either downsize or default.
Forward outlook
- Local home prices are declining (-3.0%/yr); year-one equity from $1k of loan paydown is wiped out by about $5k of value loss. Plan a longer hold.
- Los Angeles County population projected at +9% by 2050 — modest demand growth; plan on rents tracking national, not racing it.
- At projected returns (-3.0% appreciation + 3.0% rent growth), your $43k cash investment doubles in ~4 years — after that, you're playing with house money.
Negotiation context
- It's been on market 57 days — a 3% lower offer ($150k) is reasonable based on typical stale-listing flexibility.
- 7 sale attempts since 2y ago; this cycle's ask has dropped $15k (9%) from the opening price — seller is motivated, your offer sets the floor, not the list.
- Current owner paid $130k; 19% above their basis — modest negotiation headroom, anchor on the comps not their cost.
Risks & watch-outs
- Climate carrying-cost: extreme-heat days projected 7→20/yr by 2055 (HVAC capex compounding) — expect insurance premiums to compound above CPI over the hold.
Questions for the listing agent
- It's been on market 57 days. Have you received any prior offers? Is the seller open to a 3% concession, seller financing, or rate buy-down credit?
- Built in 1968 — when were the roof, HVAC, electrical panel, plumbing, and water heater last replaced?
- Is there a deadline driving the sale (1031 exchange, divorce, estate, relocation)? That informs how much negotiation room exists.
- Schools are D-rated, which usually means shorter tenancies and higher turnover. Who's the typical renter profile here, and what's been the actual vacancy rate?
- Crime grade is D in this area — have there been break-ins, vandalism, or insurance claims at this property in the last 3 years? What carrier currently insures it and at what premium?
- What's the average days-on-market for RENTAL listings here right now (not sales)? A rising rental-DOM trend means longer vacancies and softer asking-rent achievability than the comps imply.
- What's the recent tenant-quality profile in this submarket — average credit score on applications, eviction rate, late-payment / NSF rate, and stable-employment percentage? A property-management company in the area should have these aggregated.
- How much new for-sale + rental construction is in the pipeline within 1–3 miles? Heavy new supply typically softens prices + rents 12–24 months out; constrained supply supports both.
Investment metrics
- 1% rule
- 1.83% ✓
- Cap rate
- 15.34%
- Cash-on-cash
- 32.32%
- DSCR
- 2.44
- GRM
- 4.6
CMA / ARV
- ARV (on-the-fly)
- $175,500
- Comps found
- 12
Show comp detail 12 sales within ~0.75 mi
| Address | Dist | Beds/Ba | Sqft | Sold | Price | $/sf | Match |
|---|---|---|---|---|---|---|---|
| 12700 Elliot Ave #415 | 0.15mi | 2/2.0 (-1) | 1,392 (+3%) | 10mo | $135,000 | $97 | 75 |
| 12700 Elliot Ave #454 | 0.15mi | 3/2.0 | 1,257 (-7%) | 9mo | $175,000 | $139 | 74 |
| 12700 Elliot #456 | 0.00mi | 4/2.0 (+1) | 1,200 (-11%) | 5mo | $122,000 | $102 | 72 |
| 12700 Elliott #151 | 0.15mi | 3/2.0 | 1,152 (-15%) | 2mo | $150,000 | $130 | 67 |
| 12700 Elliott Ave #492 | 0.15mi | 3/2.0 | 1,515 (+12%) | 9mo | $220,000 | $145 | 65 |
| 12700 Elliott Ave #219 | 0.15mi | 3/2.0 | 1,152 (-15%) | 7mo | $150,000 | $130 | 63 |
| 12700 Elliott Ave #168 | 0.15mi | 3/2.0 | 1,152 (-15%) | 7mo | $150,000 | $130 | 63 |
| 12700 Elliott Ave #502 | 0.15mi | 4/3.0 (+1) | 1,440 (+7%) | 13mo | $125,000 | $87 | 62 |
| 12700 Elliott Ave #80 | 0.15mi | 4/2.0 (+1) | 1,152 (-15%) | 5mo | $175,000 | $152 | 60 |
| 12700 Elliott Ave #87 | 0.15mi | 4/2.0 (+1) | 1,164 (-14%) | 7mo | $111,000 | $95 | 59 |
| 12700 ELLIOTT #392 | 0.15mi | 3/2.0 | 1,152 (-15%) | 17mo | $168,000 | $146 | 55 |
| 12700 Elliott Ave #205 | 0.15mi | 3/2.0 | 1,152 (-15%) | 18mo | $150,000 | $130 | 54 |
Match score weights: distance 35% · size 25% · config 20% · recency 20%. Top-matched comps best support the ARV.
Projected returns pro-forma
-3.0% appreciation · 3.0% rent growth · sell at horizon
- IRR
- 27.4%
- Equity multiple
- 2.14×
- Total profit
- $49,350
- Equity at exit
- $23,096
- IRR
- 34.9%
- Equity multiple
- 4.20×
- Total profit
- $138,959
- Equity at exit
- $13,393
Cash invested: $43,372 (down + closing). Projections, not guarantees.
Landlord ↔ Tenant lean methodology
- Overall (STATE)
- 18 Strongly Tenant-Friendly
- State California
- 18 Strongly Tenant-Friendly · D+13
- County
- — inherits STATE
- City
- — inherits STATE
ZIP-level market 91732
- Active inventory
- 84
- Price-to-rent
- 4.6×
Monthly cashflow live
- Estimated rent
- $2,834 high interval (Pro) →
- Mortgage (P&I)
- −$812
- Tax est. 1.5%
- −$194 /mo · $2,324/yr
- Insurance
- −$65
- HOA
- −$0
- Vacancy / Maint / Mgmt
- −$595
- Net cashflow
- $1,168
Break-even live
UW: 25.0% down · 7.5% · 30yr · 1.5% tax · 5.0% vac · 8.0% maint · 8.0% mgmt
Financing live
Cash to close
- Down payment
- $38,725
- Closing costs
- $4,647
- Reserves months
- —
- Total cash needed
- —
Loan-product check · same deal, 3 products live
Conventional
25% down · 7.5% · 30yr
- Down + closing
- —
- Monthly P&I
- —
- Monthly cashflow
- —
- DSCR
- —
- Eligible?
- —
Personal DTI + credit; lowest rate.
DSCR
20% down · 8.5% · 30yr
- Down + closing
- —
- Monthly P&I
- —
- Monthly cashflow
- —
- DSCR
- —
- Eligible?
- —
No personal income docs; deal must DSCR.
Hard money
10% down · 12.0% · 12mo
- Down + closing
- —
- Monthly P&I
- —
- Monthly cashflow
- —
- DSCR
- —
- Eligible?
- —
Short-term bridge; refi at stabilization.
Rent comps 7 comps
| Address | Beds | Baths | Sqft | Rent | $/sqft | DOM | Units | Dist |
|---|---|---|---|---|---|---|---|---|
| 2642 Maxson Rd Unit 6 El Monte, CA | 2.0 | 1.0 | 900 | $2,195 | $2.44 | 1d | 1 | 0.58mi |
| 1946 Bryce Rd South El Monte, CA | 2.0 | 1.0 | 950 | $2,300 | $2.42 | 1d | 1 | 0.79mi |
| 2938 Allgeyer Ave El Monte, CA | 4.0 | 3.0 | 1676 | $3,950 | $2.36 | 1d | 1 | 0.83mi |
| 2826 Cogswell Rd Unit A El Monte, CA | 2.0 | 1.5 | 1156 | $2,650 | $2.29 | 16d | 1 | 0.90mi |
| 1024 Bunbury Dr Whittier, CA | 4.0 | 2.0 | 1414 | $1,500 | $1.06 | 2d | 1 | 0.93mi |
| 1842 Whittier Woods Cir Whittier, CA | 4.0 | 2.0 | 1587 | $2,800 | $1.76 | 22d | 1 | 1.13mi |
| 2830 Blossom Ct El Monte, CA | 2.0 | 3.0 | 1490 | $3,100 | $2.08 | 1d | 1 | 1.48mi |
Listing history 26 events
-
2026-06-09days on market $154,900 Active 57 DOM
-
2026-06-08days on market $154,900 Active 56 DOM
-
2026-06-07days on market $154,900 Active 55 DOM
-
2026-06-04days on market $154,900 Active 52 DOM
-
2026-06-03days on market $154,900 Active 51 DOM
-
2026-06-02days on market $154,900 Active 50 DOM
-
2026-06-01days on market $154,900 Active 49 DOM
-
2026-05-31days on market $154,900 Active 48 DOM
-
2026-05-02price $154,900
-
2026-04-16status Active
-
2026-03-12status Pending Sale
-
2026-03-09$169,900 Active
-
2026-03-05historical
-
2025-12-06$166,900 Active
-
2025-11-28historical
-
2025-09-20status Active
-
2025-09-20price $167,900
-
2025-06-28$165,000 Active
-
2024-05-23soldstatus $130,000 Closed Sale
-
2024-05-13status Pending Sale
-
2024-05-01price $134,998
-
2024-04-22status Active
-
2024-04-21status Pending Sale
-
2024-04-11price $134,999
-
2024-04-03price $144,999
-
2024-03-14$149,999 Active
ⓘ Source: listings_history table (triggers on properties + properties_extension) + one-shot
backfill from property_details.listing_events for pre-trigger history.
Climate risk First Street
- Flood 1/10 Low FEMA zone X (unshaded) · 0% chance over 30 yrs
- Wildfire 2/10 Low
- Heat 6/10 Major 7 d/yr ≥100°F today · 20 d/yr by 30 yrs out
- Wind 1/10 Low
- Air quality 6/10 Major 9 unhealthy d/yr today · 10 by 30 yrs out
Nearby sold comps map
Loading sold comps map…
Walkable amenities ~0.75 mi
Loading nearby amenities…
Taxation est. · year 1
- Rental income
- $34,006
- − Mortgage interest
- −$8,677
- − Property taxes
- −$2,324
- − Insurance
- −$774
- − Repairs & maintenance
- −$2,721
- − Management
- −$2,721
- − Depreciation
- −$4,506
- Taxable income
- $12,284
- Est. tax owed @ 24.0%
- −$2,948
- After-tax cash flow
- $11,071/yr
For passive investors: Depreciation is non-cash, so a rental often shows a tax loss while cash-flowing — sheltering income. Rental losses are passive: they offset passive income freely, and up to $25,000/yr can offset ordinary (W-2) income if you actively participate and your MAGI is under $100k (phasing out to $0 by $150k); unused losses carry forward. On sale, claimed depreciation is recaptured at up to 25%, and gains may owe capital-gains tax (a 1031 exchange can defer both). Figures are a year-1 estimate at your 24.0% rate — not tax advice; consult a CPA.
Schools (NCES district)
- District
- Mountain View Elementary
- NCES district ID
- 0626190
- Math proficiency
- 25% ▼ -3.00%
- Reading proficiency
- 25% ▼ -15.00%
- Median HH income
- $41,311
- Composite
- 21.23/100
- National rank
- #8404
- State rank
- #417 of 517 in CA
Livability — El Monte
- Score
- 61/100
- State rank
- #554
- US rank
- #18369
Category grades
Schools grade is shown separately in the Schools card above.
Census & demographics
- Census place
- El Monte, CA
- County
- Los Angeles County · 9,444,647 people
- City population
- 85,051
- Metro
- Los Angeles-Long Beach-Anaheim, CA
- Population (ZIP)
- 57,431
- Household income
- $75,108
- Rent vs Own
- Severe rent burden
- 2538.0
Population outlook (Los Angeles County) Hauer SSP2
- Today (2025)
- 10,940,515 people
- By 2030
- 11,256,481 · +2.9%
- By 2040
- 11,729,929 · +7.2%
- By 2050
- 11,948,407 · +9.2%
- By 2075
- 11,818,114 · +8.0%
- By 2100
- 10,842,928 · -0.9%
Race, ethnicity, and origin ACS 2023
- Neighborhood character
- Predominantly Hispanic (65%)
- Race & ethnicity
- Hispanic / Latino 65% Asian 29% Two or more races 22% White 3% Native American 2%
- Hispanic origin (detail)
- Mexican 57%
- Foreign-born
- 49% · Canada, China, Vietnam
- Languages at home
- 20% English-only · Spanish 54% Chinese 16% Vietnamese 7%
Political lean MEDSL · Los Angeles
- 2024 margin
- Solid D (+32.9) · D 64.8% · R 31.9% · Other 3.3%
- 2008→2024 swing
- -7.4pp toward R · 2008: 40.4pp · 2024: 32.9pp
- All cycles
- 2024: D+32.9 2020: D+44.2 2016: D+48.0 2012: D+40.0 2008: D+40.4
Not yet ingested
- Civics
- —
Market trends
- HPI YoY
- ▼ -1009.25%
- Current HPI
- 413.0584
- Rent YoY
- —
- Metro
- Los Angeles-Long Beach-Anaheim, CA
- State GDP YoY
- ▲ 3.21%
- F500 in state
- 116
Industry mix (Fortune 500 HQ in CA)
| Industry | F500 HQs | Revenue |
|---|---|---|
| Technology | 27 | $1,492B |
|
||
| Financial Services | 3 | $174B |
|
||
| Retail | 3 | $44B |
|
||
| Insurance | 3 | $26B |
|
||
| Media / Entertainment | 2 | $115B |
|
||
| Pharmaceuticals / Biotech | 2 | $62B |
|
||
Price history
+3.3% since first listed18 events — show timeline
- 2026-05-02 Price Changed $154,900 CRMLS
- 2026-04-16 Relisted — CRMLS
- 2026-03-12 Pending — CRMLS
- 2026-03-09 Listed $169,900 CRMLS
- 2026-03-05 Listing Removed — CRMLS
- 2025-12-06 Listed $166,900 CRMLS
- 2025-11-28 Listing Removed — CRMLS
- 2025-09-20 Relisted — CRMLS
- 2025-09-20 Price Changed $167,900 CRMLS
- 2025-06-28 Listed $165,000 CRMLS
- 2024-05-23 Sold (MLS) $130,000 CRMLS
- 2024-05-13 Pending — CRMLS
- 2024-05-01 Price Changed $134,998 CRMLS
- 2024-04-22 Relisted — CRMLS
- 2024-04-21 Pending — CRMLS
- 2024-04-11 Price Changed $134,999 CRMLS
- 2024-04-03 Price Changed $144,999 CRMLS
- 2024-03-14 Listed $149,999 CRMLS
Cash-flow waterfall
monthlySold comps — $/sqft
last 12 mo · ≤1 miLoading sold comps…