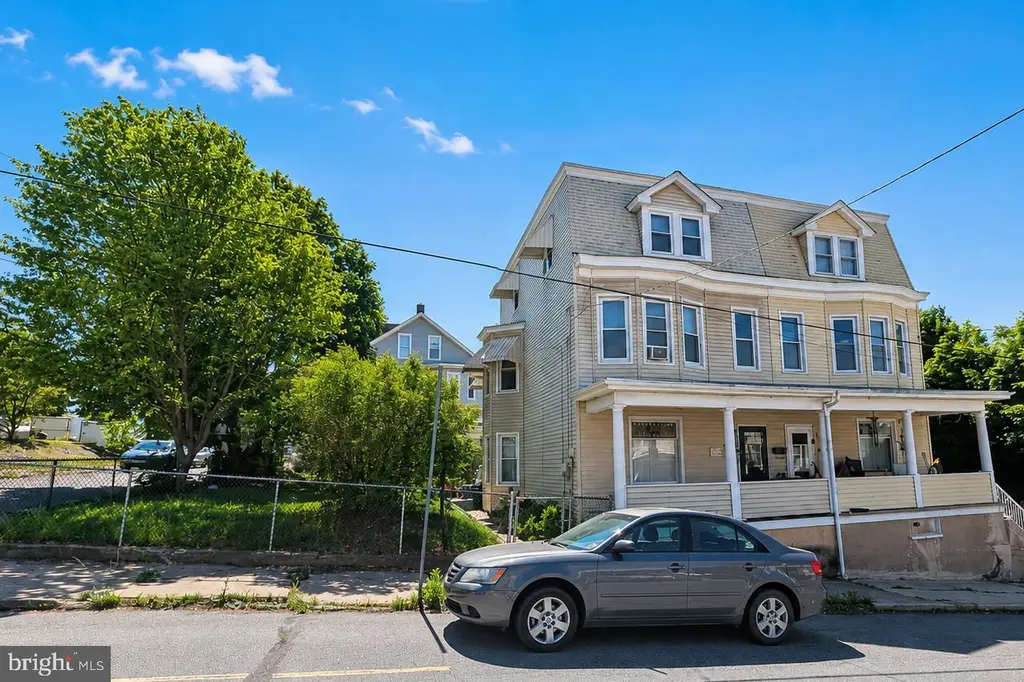
222 S 2nd St · Coaldale, PA
Flood risk 1/10 · Minimal
- FEMA flood zone
- X (unshaded)
- Chance of flooding over 30 yrs
- 0.0%
- Est. flood insurance / yr
- $473 – $860
Fire risk 3/10 · Minor
- Est. fire insurance / yr
- $511 – $949
Heat risk 3/10 · Minor
- Hot days now (above 94°F)
- 7 days/yr
- Hot days in 30 yrs
- 16 days/yr
Wind risk 4/10 · Minor
- Chance of severe wind over 30 yrs
- 9.0%
Air-quality risk 2/10 · Minimal
- Unhealthy air days now
- 1 days/yr
- Unhealthy air days in 30 yrs
- 3 days/yr
Risk factors via First Street. Map © Google.
Why this score? — see what drove the B+ grade
The composite is a weighted blend of 9 inputs, each scored 0–100. Each bar is that input's sub-score; the figure is the points it added to the 100-point composite (weight × sub-score).
- Cash flow +29.4/30.0
- ARV discount +15.0/15.0
- DSCR +10.0/10.0
- 1% rule +8.2/10.0
- Appreciation +5.3/10.0
- Livability +3.5/5.0
- Rent growth +2.5/5.0
- Condition / age +2.5/5.0
- Schools +2.0/10.0
$124,900
🖨 Deal sheet 📄 Offer letter ✓ Due diligence
Listing remarks MLS
Spacious and Affordable 5-Bedroom Semi-Detached Home in Coaldale If you’re looking for space, this is it! Boasting over 2,000 square feet of living space and offering plenty of room for everyone. With 5 generously sized bedrooms, everyone can enjoy their own private retreat. Step into the beautifully remodeled eat-in kitchen, featuring elegant granite countertops and modern finishes. Perfect for daily meals or perfect for entertaining friends, this kitchen is sure to be the heart of your home. The formal dining room provides a sophisticated space for hosting dinner parties and holiday gatherings. Imagine celebrating special occasions in this charming setting, surrounded by your loved ones. Enjoy the outdoors in the fully fenced yard, ideal for pets and gardening enthusiasts. Whether you’re hosting a summer barbecue or simply relaxing on the weekends, this backyard is perfect for all your outdoor activities. This affordably priced gem in Coaldale offers incredible value with its spacious layout, modern amenities, and convenient location. Don’t miss your chance to make this house your home!
Key facts
- Recently remodeled
- Second bathroom
- Move-in-ready
Tags
Property features AI
Exterior
- Parking: On-street parking
- Utilities: Public water; Public septic; Electric for cooling; Oil fuel for heating and hot water
- Home design: Semi-detached property; Pitched roof; Fee simple ownership; Very good condition
- Construction: Vinyl siding exterior; Block foundation; Estimated year built
- Exterior features: Chain link fencing; Corner lot with side yard
Interior
- Kitchen: Eat-in kitchen with island
- Bedrooms: Three bedrooms on the first upper level; Two bedrooms on the second upper level
- Bathrooms: Two full bathrooms (both on upper levels)
- Heating & cooling: Baseboard hot water heating (oil-fired); Ceiling fans for cooling; Hot water heated by oil
- Interior features: Walk-in shower in bathroom; Breakfast area; Ceiling fans; Combination dining and living area; Traditional floor plan; Eat-in kitchen; Kitchen island; Full basement
Neighborhood map
What this means for you Summary
Snapshot
- This is a 5-bed/1.0-bath townhouse listed at $125k.
Deal economics
- At list price, monthly cash flow is $442 ($5k/yr) — positive.
- The deal already cash-flows at list — no discount required.
- Meets the 1% rule at list price ($2k rent vs $125k).
Location & tenants
- Location reads 70/100 on livability (#761 in PA) — a middle-class / working-renter tenant base. Strengths: crime A+, cost of living A+, housing A+; Watch: amenities F, commute F, employment F.
- Panther Valley SD (rural): math 14% / reading 35% proficiency, ranked #477 of 539 in PA (top 88%) — low school quality limits family demand, transient renter base, plan for 1-2y turnover.
- Zoned schools: Panther Valley El Sch (math 27% / reading 42%, grade F, #1,049 of 1,518 statewide, top 71%, 622 students, 100% FRL); Panther Valley Jshs (math 13% / reading 36%, grade F, #376 of 437 statewide, top 86%, 771 students, 100% FRL) — zoned schools average 100% FRL vs 52% district-wide (48 pts higher); higher-poverty schools than district average — tighter screening recommended.
- Market conditions: 12 active listings in the ZIP; 169 units permitted in Schuylkill County in 2024 (0 in 5+ unit buildings).
Forward outlook
- In year one you build about $2k of equity ($864 loan paydown + $636 appreciation (0.5% local appreciation)).
- Schuylkill County population projected at -16% by 2050 — secular population decline; favor cash flow + early exit over multi-decade hold.
- At projected returns (0.5% appreciation + 3.0% rent growth), your $35k cash investment doubles in ~5 years — after that, you're playing with house money.
Negotiation context
- Only 7 days on market — expect competitive offers; lowballing is unlikely to land.
- 3 sale attempts since 2y ago with the ask held roughly flat each time — persistent listings suggest the price (not the market) is what's stuck; bring a comps-based counter.
- Current owner paid $105k; 19% above their basis — modest negotiation headroom, anchor on the comps not their cost.
Risks & watch-outs
- Watch-outs: built in 1913 — expect roof / HVAC / electrical / plumbing capex.
Questions for the listing agent
- Built in 1913 — when were the roof, HVAC, electrical panel, plumbing, and water heater last replaced?
- Is there a deadline driving the sale (1031 exchange, divorce, estate, relocation)? That informs how much negotiation room exists.
- Schools are F-rated, which usually means shorter tenancies and higher turnover. Who's the typical renter profile here, and what's been the actual vacancy rate?
- What's the average days-on-market for RENTAL listings here right now (not sales)? A rising rental-DOM trend means longer vacancies and softer asking-rent achievability than the comps imply.
- What's the recent tenant-quality profile in this submarket — average credit score on applications, eviction rate, late-payment / NSF rate, and stable-employment percentage? A property-management company in the area should have these aggregated.
- How much new for-sale + rental construction is in the pipeline within 1–3 miles? Heavy new supply typically softens prices + rents 12–24 months out; constrained supply supports both.
Investment metrics
- 1% rule
- 1.32% ✓
- Cap rate
- 10.54%
- Cash-on-cash
- 15.18%
- DSCR
- 1.68
- GRM
- 6.3
CMA / ARV
- ARV (on-the-fly)
- $153,624
- Comps found
- 3
Show comp detail 3 sales within ~0.75 mi
| Address | Dist | Beds/Ba | Sqft | Sold | Price | $/sf | Match |
|---|---|---|---|---|---|---|---|
| 222 S Second St | 0.00mi | 5/2.0 | 2,070 (-0%) | 18mo | $105,000 | $51 | 81 |
| 346 Snow Ridge Cir | 0.72mi | 4/3.0 (-1) | 2,049 (-1%) | 16mo | $365,000 | $178 | 38 |
| 341 W Abbott St | 0.72mi | 4/2.0 (-1) | 1,861 (-10%) | 12mo | $137,500 | $74 | 30 |
Match score weights: distance 35% · size 25% · config 20% · recency 20%. Top-matched comps best support the ARV.
Projected returns pro-forma
0.51% appreciation · 3.0% rent growth · sell at horizon
- IRR
- 15.9%
- Equity multiple
- 1.79×
- Total profit
- $27,558
- Equity at exit
- $39,479
- IRR
- 19.8%
- Equity multiple
- 3.29×
- Total profit
- $80,242
- Equity at exit
- $50,101
Cash invested: $34,972 (down + closing). Projections, not guarantees.
Landlord ↔ Tenant lean methodology
- Overall (STATE)
- 62 Landlord-Friendly
- State Pennsylvania
- 62 Landlord-Friendly · EVEN
- County
- — inherits STATE
- City
- — inherits STATE
ZIP-level market 18218
- Home prices YoY
- 0.2%
- Active inventory
- 12
- Price-to-rent
- 6.3×
Monthly cashflow live
- Estimated rent
- $1,652 medium interval (Pro) →
- Mortgage (P&I)
- −$655
- Tax est. 1.5%
- −$156 /mo · $1,874/yr
- Insurance
- −$52
- HOA
- −$0
- Vacancy / Maint / Mgmt
- −$347
- Net cashflow
- $442
Break-even live
UW: 25.0% down · 7.5% · 30yr · 1.5% tax · 5.0% vac · 8.0% maint · 8.0% mgmt
Financing live
Cash to close
- Down payment
- $31,225
- Closing costs
- $3,747
- Reserves months
- —
- Total cash needed
- —
Loan-product check · same deal, 3 products live
Conventional
25% down · 7.5% · 30yr
- Down + closing
- —
- Monthly P&I
- —
- Monthly cashflow
- —
- DSCR
- —
- Eligible?
- —
Personal DTI + credit; lowest rate.
DSCR
20% down · 8.5% · 30yr
- Down + closing
- —
- Monthly P&I
- —
- Monthly cashflow
- —
- DSCR
- —
- Eligible?
- —
No personal income docs; deal must DSCR.
Hard money
10% down · 12.0% · 12mo
- Down + closing
- —
- Monthly P&I
- —
- Monthly cashflow
- —
- DSCR
- —
- Eligible?
- —
Short-term bridge; refi at stabilization.
Listing history 7 events
-
2026-06-13statusdays on market $124,900 Pending 7 DOM
-
2026-06-10days on market $124,900 Active 6 DOM
-
2026-06-09days on market $124,900 Active 5 DOM
-
2026-06-08days on market $124,900 Active 4 DOM
-
2026-06-07days on market $124,900 Active 3 DOM
-
2026-06-05remarks 699-char remark
-
2026-06-05$124,900 Active 1 DOM
ⓘ Source: listings_history table (triggers on properties + properties_extension) + one-shot
backfill from property_details.listing_events for pre-trigger history.
Climate risk First Street
- Flood 1/10 Low FEMA zone X (unshaded) · 0% chance over 30 yrs
- Wildfire 3/10 Moderate
- Heat 3/10 Moderate 7 d/yr ≥94°F today · 16 d/yr by 30 yrs out
- Wind 4/10 Moderate 9% chance of damaging wind over 30 yrs
- Air quality 2/10 Low 1 unhealthy d/yr today · 3 by 30 yrs out
Nearby sold comps map
Loading sold comps map…
Walkable amenities ~0.75 mi
Loading nearby amenities…
Taxation est. · year 1
- Rental income
- $19,829
- − Mortgage interest
- −$6,996
- − Property taxes
- −$1,874
- − Insurance
- −$624
- − Repairs & maintenance
- −$1,586
- − Management
- −$1,586
- − Depreciation
- −$3,633
- Taxable income
- $3,529
- Est. tax owed @ 24.0%
- −$847
- After-tax cash flow
- $4,460/yr
For passive investors: Depreciation is non-cash, so a rental often shows a tax loss while cash-flowing — sheltering income. Rental losses are passive: they offset passive income freely, and up to $25,000/yr can offset ordinary (W-2) income if you actively participate and your MAGI is under $100k (phasing out to $0 by $150k); unused losses carry forward. On sale, claimed depreciation is recaptured at up to 25%, and gains may owe capital-gains tax (a 1031 exchange can defer both). Figures are a year-1 estimate at your 24.0% rate — not tax advice; consult a CPA.
Schools (NCES district)
- District
- Panther Valley SD
- NCES district ID
- 4218450
- Math proficiency
- 14% ▼ -7.00%
- Reading proficiency
- 35% ▼ -14.00%
- Median HH income
- $36,914
- Composite
- 20.31/100
- National rank
- #8613
- State rank
- #477 of 539 in PA
Livability — Coaldale
- Score
- 70/100
- State rank
- #761
- US rank
- #7599
Category grades
Schools grade is shown separately in the Schools card above.
Census & demographics
- Census place
- Coaldale, PA
- Population (ZIP)
- 2,353
Population outlook (Schuylkill County) Hauer SSP2
- Today (2025)
- 137,447 people
- By 2030
- 133,121 · -3.1%
- By 2040
- 124,172 · -9.7%
- By 2050
- 115,611 · -15.9%
- By 2075
- 100,796 · -26.7%
- By 2100
- 86,667 · -36.9%
Race, ethnicity, and origin ACS 2023
- Neighborhood character
- Predominantly White (89%)
- Race & ethnicity
- White 89% Hispanic / Latino 6% Black 4% Two or more races 3%
- Hispanic origin (detail)
- Puerto Rican 2% Dominican 2%
- Common ancestry
- Romanian 9% Polish 4% Iranian 3%
- Foreign-born
- 1% · Canada
- Languages at home
- 94% English-only · Spanish 6%
Political lean MEDSL · Schuylkill
- 2024 margin
- Solid R (+42.1) · D 28.5% · R 70.6%
- 2008→2024 swing
- -33.4pp toward R · 2008: -8.7pp · 2024: -42.1pp
- All cycles
- 2024: R+42.1 2020: R+39.9 2016: R+43.4 2012: R+13.4 2008: R+8.7
Not yet ingested
- Civics
- —
Market trends
- HPI YoY
- ▲ 0.51%
- Current HPI
- 288.42
- Rent YoY
- —
- Metro
- —
- State GDP YoY
- ▲ 1.68%
- F500 in state
- 34
Industry mix (Fortune 500 HQ in PA)
| Industry | F500 HQs | Revenue |
|---|---|---|
| Healthcare | 2 | $309B |
|
||
| Insurance | 2 | $27B |
|
||
| Telecommunications / Media | 1 | $124B |
|
||
| Industrial Distribution | 1 | $22B |
|
||
| Financial Services | 1 | $20B |
|
||
| Chemicals / Materials | 1 | $18B |
|
||
Price history
+4.1% since first listed8 events — show timeline
- 2026-06-04 Listed $124,900 BRIGHT MLS
- 2025-01-08 Sold (Public Records) $105,000 Public Records
- 2024-12-27 Sold (MLS) $105,000 BRIGHT MLS
- 2024-12-09 Pending — BRIGHT MLS
- 2024-10-19 Price Changed $114,900 BRIGHT MLS
- 2024-08-29 Relisted — BRIGHT MLS
- 2024-08-26 Contingent — BRIGHT MLS
- 2024-08-02 Listed $120,000 BRIGHT MLS
Property tax history
+15.1%/yrLatest (2026): $7,790 · +274.4% YoY. Source: county tax records.
Cash-flow waterfall
monthlySold comps — $/sqft
last 12 mo · ≤1 miLoading sold comps…